方案详情文
智能文字提取功能测试中
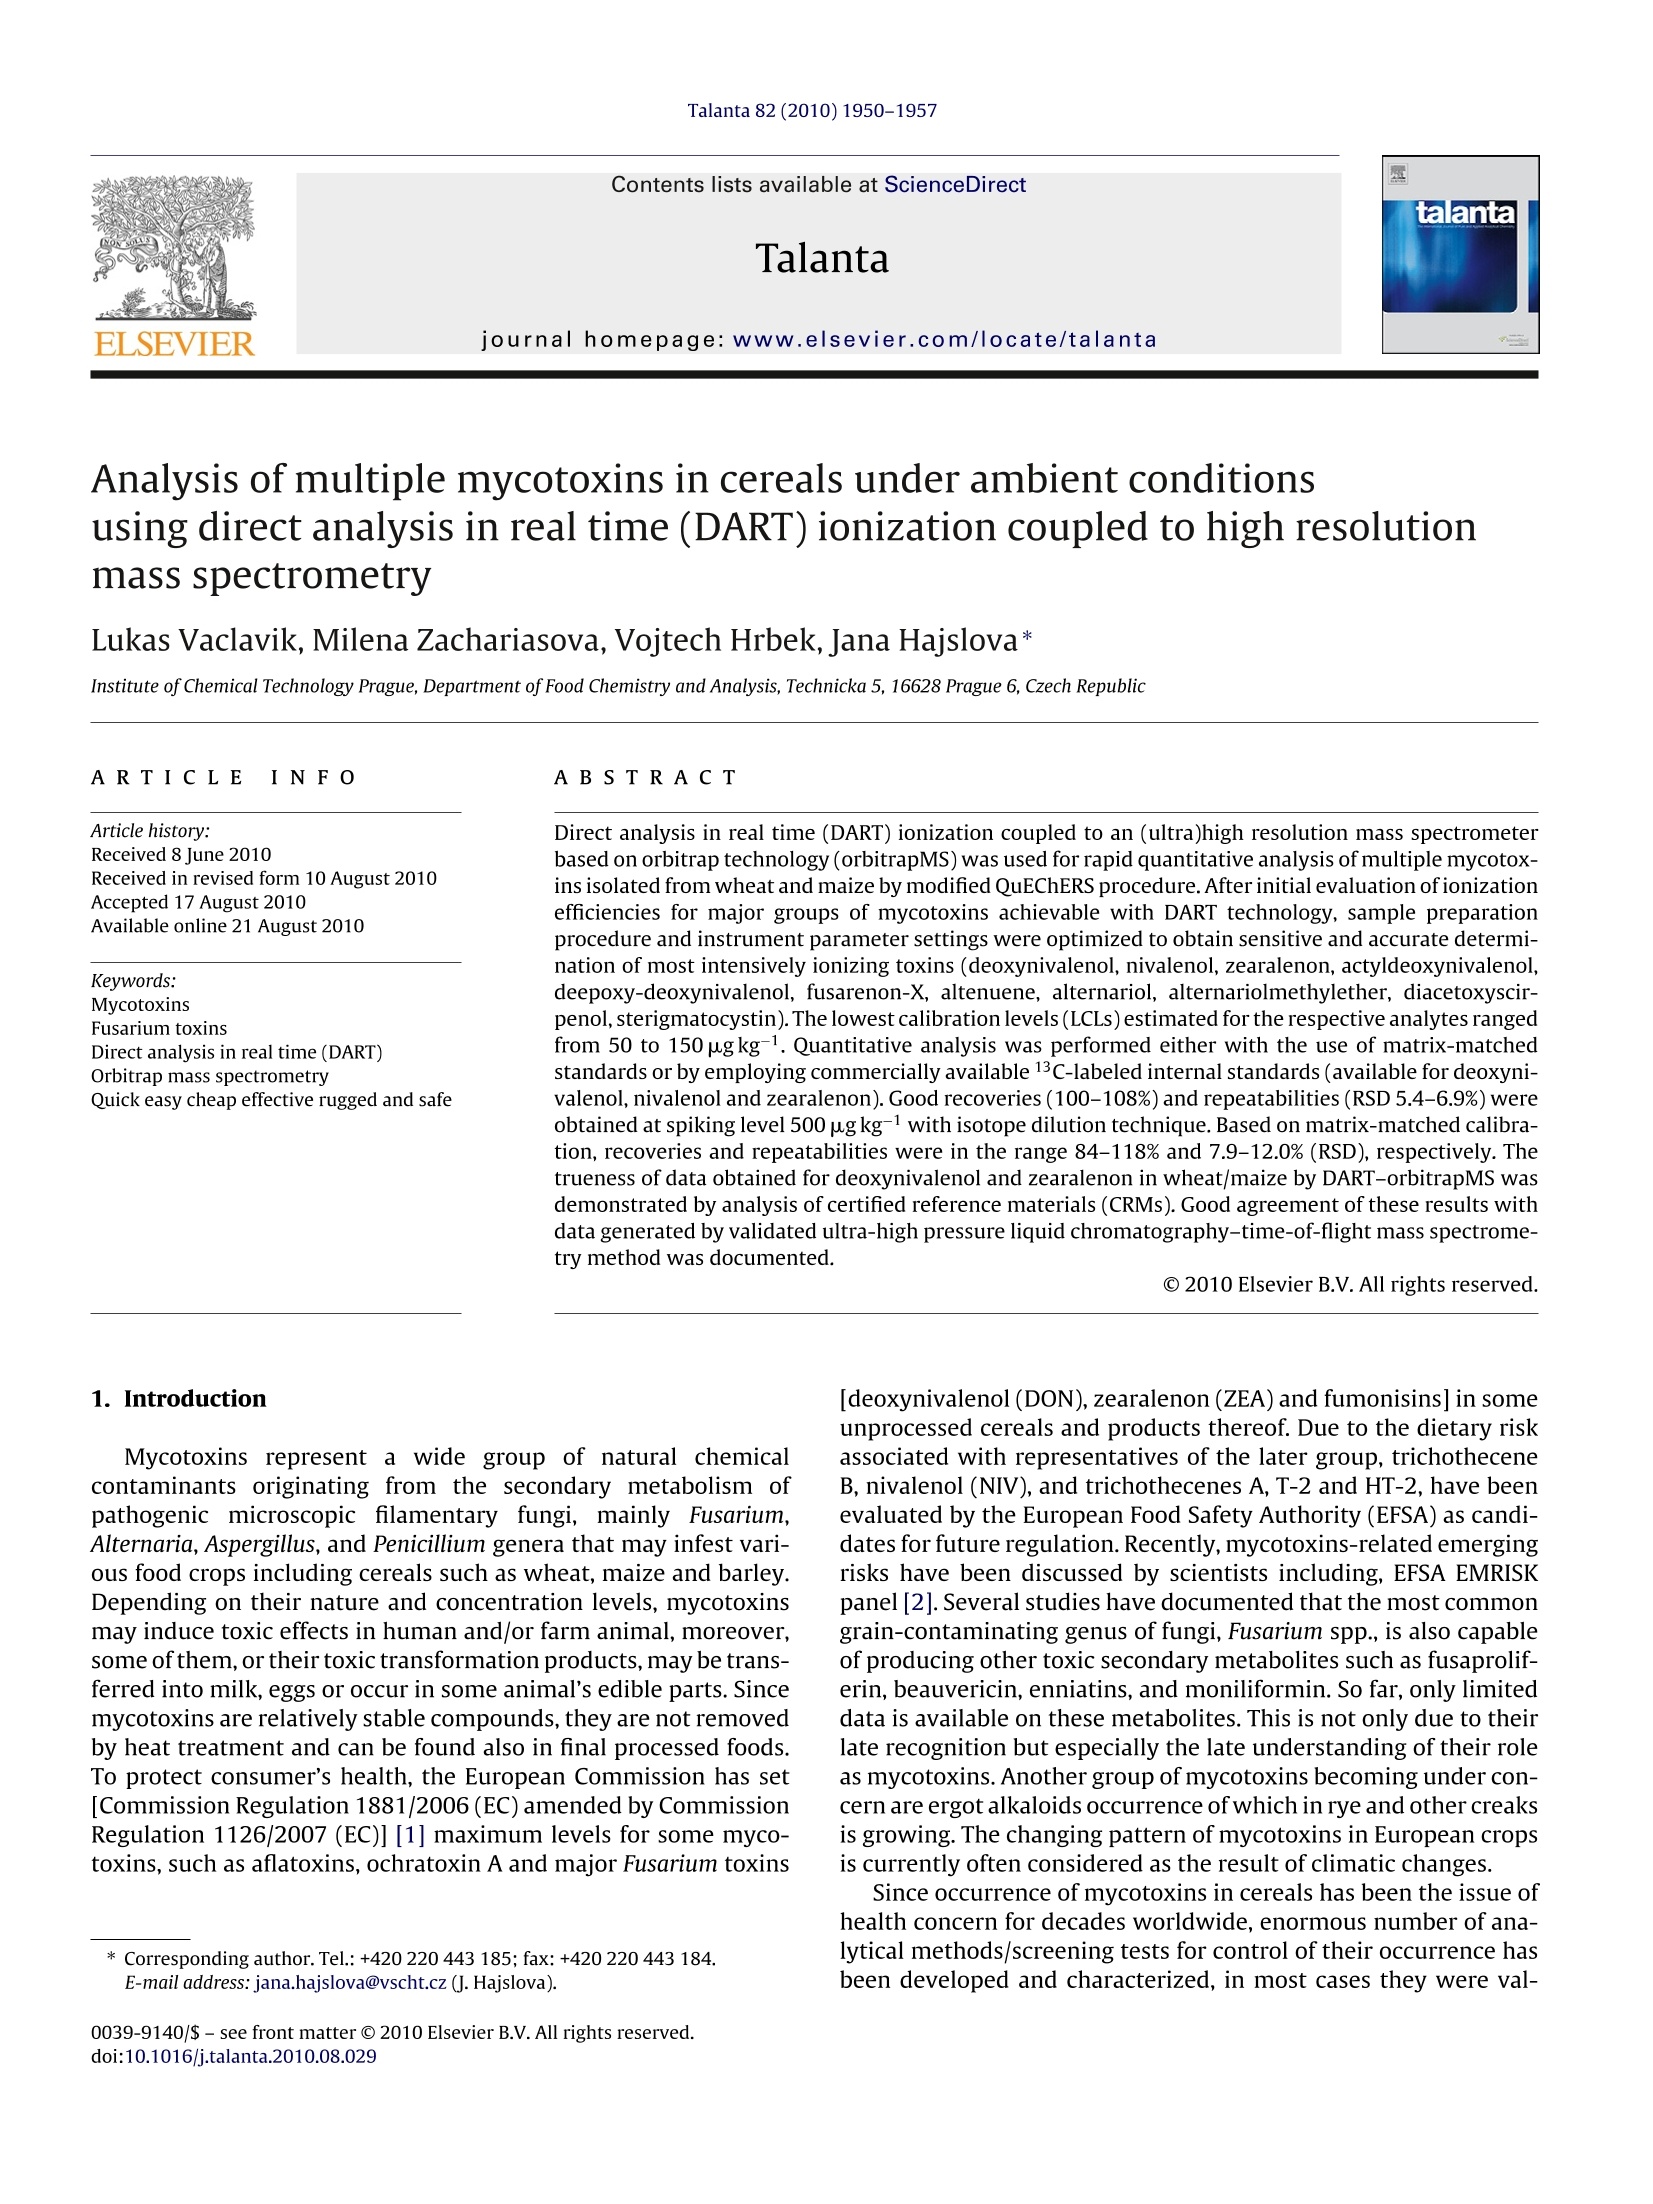
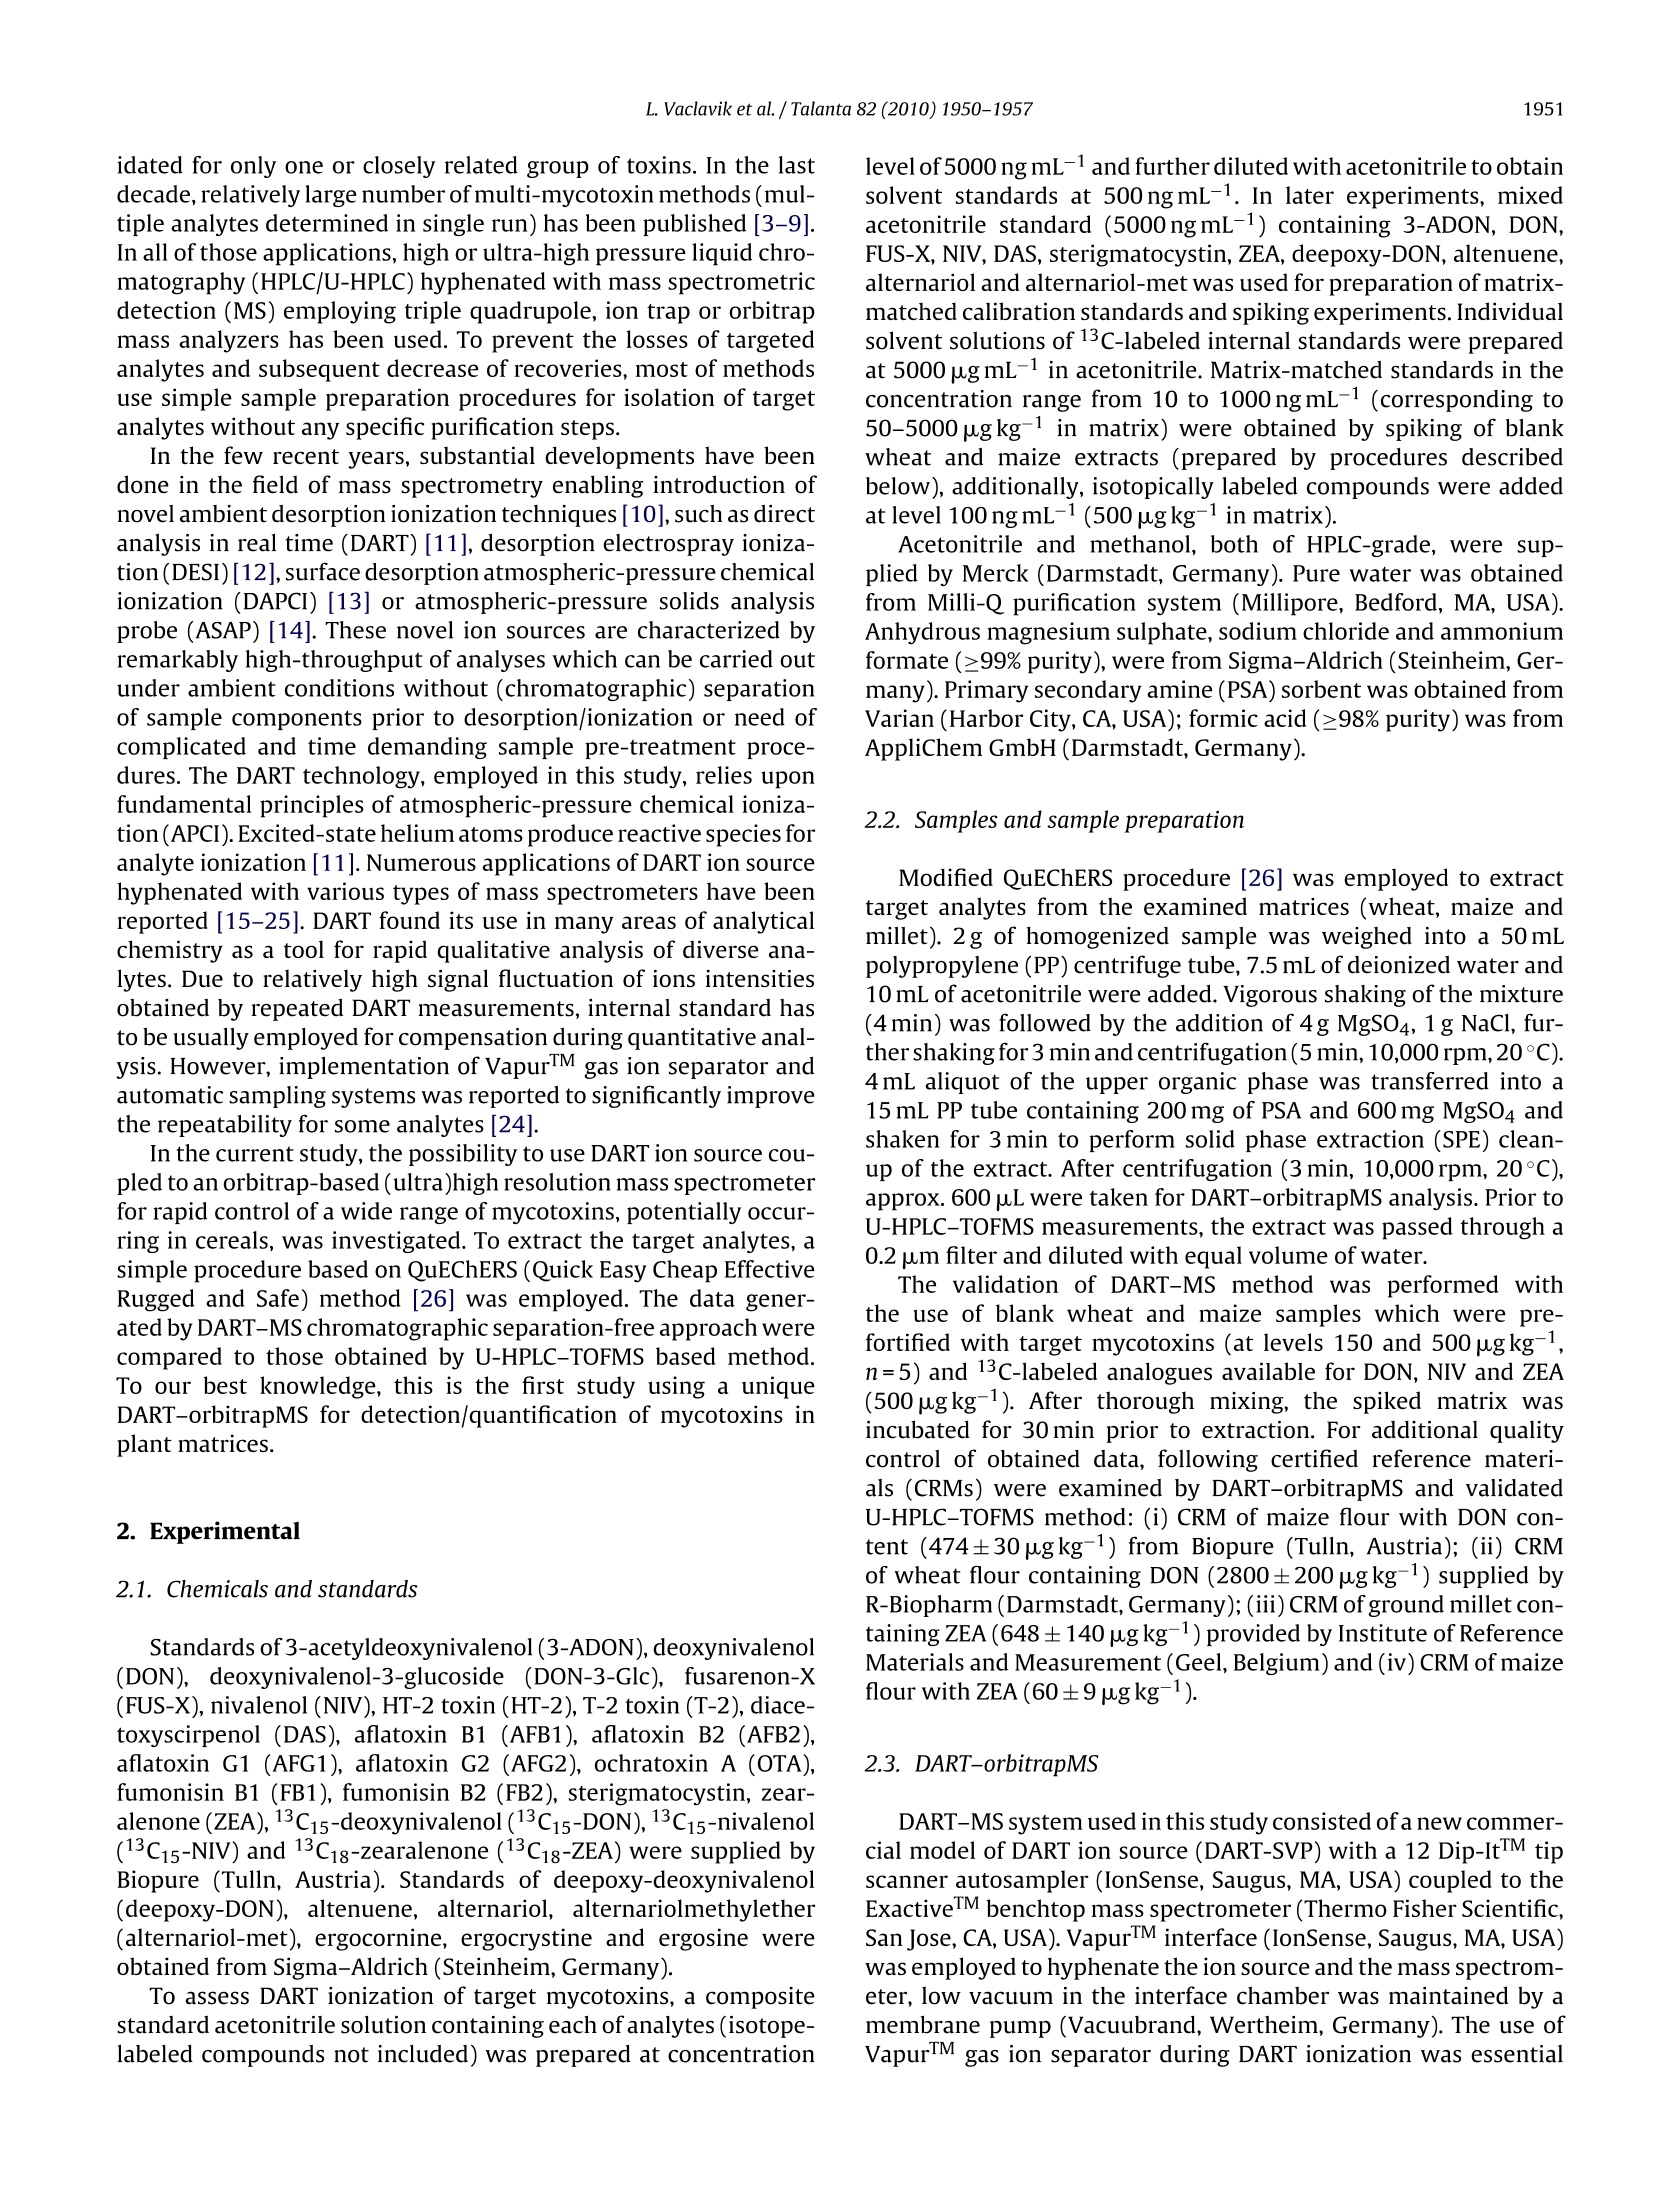
Talanta 82 (2010) 1950-1957Contents lists available at ScienceDirect 1951L. Vaclavik et al. /Talanta 82 (2010)1950-1957 Talanta journal homepage:www.elsevier.com/locate/talanta Analysis of multiple mycotoxins in cereals under ambient conditionsusing direct analysis in real time (DART) ionization coupled to high resolutionmass spectrometry Lukas Vaclavik, Milena Zachariasova, Vojtech Hrbek, Jana Hajslova* Institute of Chemical Technology Prague, Department of Food Chemistry and Analysis, Technicka 5, 16628 Prague 6, Czech Republic Article history:Received 8 June 2010Received in revised form 10 August 2010Accepted 17 August 2010Available online 21 August 2010 Keywords: MycotoxinsFusarium toxinsDirect analysis in real time (DART)Orbitrap mass spectrometry Quick easy cheap effective rugged and safe ABSTRAC T Direct analysis in real time (DART) ionization coupled to an (ultra)high resolution mass spectrometerbased on orbitrap technology (orbitrapMS) was used for rapid quantitative analysis of multiple mycotox-ins isolated from wheat and maize by modified QuEChERS procedure. After initial evaluation ofionizationefficiencies for major groups of mycotoxins achievable with DART technology, sample preparationprocedure and instrument parameter settings were optimized to obtain sensitive and accurate determi-nation of most intensively ionizing toxins (deoxynivalenol, nivalenol, zearalenon, actyldeoxynivalenol,deepoxy-deoxynivalenol, fusarenon-X, altenuene, alternariol, alternariolmethylether, diacetoxyscir-penol, sterigmatocystin). The lowestcalibration levels (LCLs) estimated for the respectiveanalytes rangedfrom 50 to 150 pgkg-1. Quantitative analysis was performed either with the use of matrix-matchedstandards or by employing commercially available 13C-labeled internal standards (available for deoxyni-valenol, nivalenol and zearalenon). Good recoveries (100-108%) and repeatabilities (RSD 5.4-6.9%) wereobtained at spiking level 500 ug kg-1 with isotope dilution technique. Based on matrix-matched calibra-tion, recoveries and repeatabilities were in the range 84-118% and 7.9-12.0% (RSD), respectively. Thetrueness of data obtained for deoxynivalenol and zearalenon in wheat/maize by DART-orbitrapMS wasdemonstrated by analysis of certified reference materials (CRMs). Good agreement of these results withdata generated by validated ultra-high pressure liquid chromatography-time-of-flight mass spectrome-try method was documented. O 2010 Elsevier B.V. All rights reserved. 1. Introduction Mycotoxins represent a wide group of natural chemicalcontaminants originating from the secondary metabolism ofpathogenic microscopic filamentary fungi, mainly Fusarium,Alternaria, Aspergillus, and Penicillium genera that may infest vari-ous food crops including cereals such as wheat, maize and barley.Depending on their nature and concentration levels, mycotoxinsmay induce toxic effects in human and/or farm animal, moreover,some of them, or their toxic transformation products, may be trans-ferred into milk, eggs or occur in some animal's edible parts. Sincemycotoxins are relatively stable compounds, they are not removedby heat treatment and can be found also in final processed foods.To protect consumer's health, the European Commission has set[Commission Regulation 1881/2006 (EC) amended by CommissionRegulation 1126/2007 (EC)][1] maximum levels for some myco-toxins, such as aflatoxins, ochratoxin A and major Fusarium toxins ( * C orresponding author.Tel.: +420 220 443 185; f ax: +420 220443184. E-mail address: jana.ha j slova@vscht.cz (J. Hajslova). ) ( 0 039-9140/$ - see front matter O 2010 Elsevier B.V. All rights reserved. ) ( doi:10.1 0 16/j.talanta.2010. 0 8.029 ) [deoxynivalenol (DON), zearalenon (ZEA) and fumonisins] in someunprocessed cereals and products thereof. Due to the dietary riskassociated with representatives of the later group, trichotheceneB, nivalenol (NIV), and trichothecenes A, T-2 and HT-2, have beenevaluated by the European Food Safety Authority (EFSA) as candi-dates for future regulation. Recently,mycotoxins-related emergingrisks have been discussed by scientists including, EFSA EMRISKpanel [2]. Several studies have documented that the most commongrain-contaminating genus of fungi, Fusarium spp., is also capableofproducing other toxic secondary metabolites such as fusaprolif-erin, beauvericin, enniatins, and moniliformin. So far, only limiteddata is available on these metabolites. This is not only due to theirlate recognition but especially the late understanding of their roleas mycotoxins. Another group of mycotoxins becoming under con-cern are ergot alkaloids occurrence of which in rye and other creaksis growing. The changing pattern of mycotoxins in European cropsis currentlyoften considered as the result of climatic changes. Since occurrence of mycotoxins in cereals has been the issue ofhealth concern for decades worldwide, enormous number of ana-lytical methods/screening tests for control of their occurrence hasbeen developed and characterized, in most cases they were val- idated for only one or closely related group of toxins. In the lastdecade, relatively large number of multi-mycotoxin methods (mul-tiple analytes determined in single run) has been published [3-9].In all of those applications, high or ultra-high pressure liquid chro-matography (HPLC/U-HPLC) hyphenated with mass spectrometricdetection (MS) employing triple quadrupole, ion trap or orbitrapmass analyzers has been used. To prevent the losses of targetedanalytes and subsequent decrease of recoveries, most of methodsuse simple sample preparation procedures for isolation of targetanalytes without any specific purification steps. In the few recent years, substantial developments have beendone in the field of mass spectrometry enabling introduction ofnovel ambient desorption ionization techniques [10], such as directanalysis in real time (DART) [11], desorption electrospray ioniza-tion(DESI)[12], surface desorption atmospheric-pressure chemicalionization (DAPCI) [13] or atmospheric-pressure solids analysisprobe (ASAP) [14]. These novel ion sources are characterized byremarkably high-throughput of analyses which can be carried outunder ambient conditions without (chromatographic) separationof sample components prior to desorption/ionization or need ofcomplicated and time demanding sample pre-treatment proce-dures. The DART technology, employed in this study, relies uponfundamental principles of atmospheric-pressure chemical ioniza-tion(APCI). Excited-state helium atoms produce reactive species foranalyte ionization [11]. Numerous applications of DART ion sourcehyphenated with various types of mass spectrometers have beenreported [15-25]. DART found its use in many areas of analyticalchemistry as a tool for rapid qualitative analysis of diverse ana-lytes. Due to relatively high signal fluctuation of ions intensitiesobtained by repeated DART measurements, internal standard hasto be usually employed for compensation during quantitative anal-ysis. However, implementation of VapurIM gas ion separator andautomatic sampling systems was reported to significantly improvethe repeatability for some analytes [24]. In the current study, the possibility to use DART ion source cou-pled to an orbitrap-based (ultra)high resolution mass spectrometerfor rapid control of a wide range of mycotoxins, potentially occur-ring in cereals, was investigated. To extract the target analytes, asimple procedure based on QuEChERS (Quick Easy Cheap EffectiveRugged and Safe) method [26] was employed. The data gener-ated by DART-MS chromatographic separation-free approach werecompared to those obtained by U-HPLC-TOFMS based method.To our best knowledge, this is the first study using a uniqueDART-orbitrapMS for detection/quantification of mycotoxins inplant matrices. 2. Experimental 2.1. Chemicals and standards Standards of 3-acetyldeoxynivalenol (3-ADON), deoxynivalenol(DON), deoxynivalenol-3-glucoside (DON-3-Glc), fusarenon-X(FUS-X), nivalenol (NIV), HT-2 toxin (HT-2), T-2 toxin (T-2), diace-toxyscirpenol (DAS), aflatoxin B1 (AFB1), aflatoxin B2 (AFB2),aflatoxin G1 (AFG1), aflatoxin G2 (AFG2), ochratoxin A (OTA),fumonisin B1 (FB1), fumonisin B2 (FB2), sterigmatocystin, zear-alenone(ZEA), 13C15-deoxynivalenol (13C15-DON),13C15-nivalenol(13C15-NIV) and 13Ci8-zearalenone (13C18-ZEA)were supplied byBiopure (Tulln, Austria). Standards of deepoxy-deoxynivalenol(deepoxy-DON), altenuene, alternariol, alternariolmethylether(alternariol-met), ergocornine, ergocrystine and ergosine wereobtained from Sigma-Aldrich (Steinheim, Germany). To assess DART ionization of target mycotoxins, a compositestandard acetonitrile solution containing each of analytes (isotope-labeled compounds not included) was prepared at concentration level of 5000 ng mL-1 and further diluted with acetonitrile to obtainsolvent standards at 500ng mL-1. In later experiments, mixedacetonitrile standard (5000 ngmL-1) containing 3-ADON, DON,FUS-X,NIV, DAS, sterigmatocystin,ZEA, deepoxy-DON, altenuene,alternariol and alternariol-met was used for preparation of matrix-matched calibration standards and spiking experiments.Individualsolvent solutions of 13c-labeled internal standards were preparedat 5000 ug mL-1 in acetonitrile. Matrix-matched standards in theconcentration range from 10 to 1000 ng mL-1 (corresponding to50-5000 ugkg-1 in matrix) were obtained by spiking of blankwheat and maize extracts (prepared by procedures describedbelow),additionally, isotopically labeled compounds were addedat level 100 ng mL-1(500 pg kg-1 in matrix). Acetonitrile and methanol, both of HPLC-grade, were sup-plied by Merck (Darmstadt, Germany). Pure water was obtainedfrom Milli-Q purification system (Millipore, Bedford, MA, USA).Anhydrous magnesium sulphate, sodium chloride and ammoniumformate (99% purity), were from Sigma-Aldrich (Steinheim, Ger-many). Primary secondary amine (PSA) sorbent was obtained fromVarian (Harbor City, CA, USA); formic acid (≥98% purity) was fromAppliChem GmbH (Darmstadt, Germany). 2.2. Samples and sample preparation Modified QuEChERS procedure [26] was employed to extracttarget analytes from the examined matrices (wheat, maize andmillet). 2g of homogenized sample was weighed into a 50 mLpolypropylene (PP) centrifuge tube, 7.5 mL of deionized water and10 mL of acetonitrile were added. Vigorous shaking of the mixture(4min) was followed by the addition of 4g MgSO4, 1g NaCl, fur-ther shaking for 3 min andcentrifugation(5 min, 10,000rpm,20°C).4mL aliquot of the upper organic phase was transferred into a15 mL PP tube containing 200 mg of PSA and 600 mg MgSO4 andshaken for 3 min to perform solid phase extraction (SPE) clean-up of the extract. After centrifugation (3 min, 10,000 rpm, 20°C),approx. 600 pL were taken for DART-orbitrapMS analysis. Prior toU-HPLC-TOFMS measurements, the extract was passed through a0.2 um filter and diluted with equal volume of water. The validation of DART-MS method was performed withthe use of blank wheat and maize samples which were pre-fortified with target mycotoxins (at levels 150 and 500 ugkg,n=5) and 13C-labeled analogues available for DON, NIV and ZEA(500pgkg-1). After thorough mixing, the spiked matrix wasincubated for 30 min prior to extraction. For additional qualitycontrol of obtained data, following certified reference materi-als (CRMs) were examined by DART-orbitrapMS and validatedU-HPLC-TOFMS method: (i) CRM of maize flour with DON con-tent (474±30 ugkg-) from Biopure (Tulln, Austria); (ii) CRMof wheat flour containing DON (2800±200pgkg-)supplied byR-Biopharm (Darmstadt,Germany); (iii) CRM of ground millet con-taining ZEA (648±140pgkg-) provided by Institute of ReferenceMaterials and Measurement (Geel, Belgium)and (iv) CRM of maizeflour with ZEA (60±9pgkg). 2.3. DART-orbitrapMS DART-MS system used in this study consisted of a new commer-cial model of DART ion source (DART-SVP) with a 12 Dip-ItTM tipScanner autosampler (IonSense, Saugus, MA, USA) coupled to theExactivelM benchtop mass spectrometer (Thermo Fisher Scientific,San Jose, CA, USA). VapurTM interface (IonSense, Saugus,MA, USA)was employed to hyphenate the ion source and the mass spectrom-eter, low vacuum in the interface chamber was maintained by amembrane pump (Vacuubrand, Wertheim, Germany). The use ofVapurTM gas ion separator during DART ionization was essential in order to maintain stable vacuum within the operating pres-sure limits of the ExactiveTM instrument. VapurTM interface alsoimproved transport efficiency of ions from the sampling area tothe atmospheric-pressure interface inlet of the mass spectrometer,thus enhancing both sensitivity and reproducibility of the mea-surement. The distance between the exit of the DART gun and theceramic transfer tube of the VapurTM was set to 10 mm, the gapbetween the ceramic tube and the inlet to the heated capillary ofthe ExactiveTM was 2 mm. DART-MS instrument was operated either in positive or nega-tive ionization mode, optimized settings of the system parameterswere as follows: (i) DART positive ionization: helium flow:2.5 L min-1; gas temperature: 350C; discharge needle voltage:-5000V; grid electrode: +200V; (ii) DART ionization negativeionization: helium flow: 2.5 Lmin-1; gas temperature: 350°C; dis-charge needle voltage:-5000V; grid electrode: +350V; (iii) massspectrometric detection: capillary voltage: ±55V; tube lens volt-age:±130V; capillary temperature: 250°C. Sheath, auxiliary andsweep gases were disabled during DART-MS analysis. The acqui-sition rate was set according to desired resolving power of theorbitrap mass analyzer, and was 10 spectra s-1 at 10,000 FWHM(full width at half maximum), 4 spectra s-1 at 25,000 FWHM and2 spectra s-1 at 50,000 FWHM. In all cases, the mass resolvingpower was calculated for m/z 200. Semi-automatic analysis of liquid samples was carried out withthe use of 12 Dip-ItTM tip scanner autosampler. Dip-ItTM tips (Ion-Sense,Saugus,MA,USA) were inserted into a holder and immersedin sample extracts placed in deepwell micro-plate (Life SystemsDesign,Merenschwand,Switzerland). The holder was mounted onthe body of the autosampler. Subsequently, the Dip-ItTM tips auto-matically moved at a constant speed of 0.5 mms-1 through thehelium gas beam in perpendicular direction to the axis leading fromDART gun exit to the mass spectrometers inlet.Using the abovemoving speed, the time of desorption from the surface of each tipwas 9 s; total run time of 12 analyses was approx. 4.2 min.To enableand/or enhance ionization of certain analytes, 2 mL autosamplervial containing dopant solution was placed in the distance of 20 mmfrom the DART gun exit. Aqueous solution of ammonia (25%,w/w,Penta, Chrudim,Czech Republic) and neat dichloromethane(Schar-lau,Barcelona, Spain) were used in positive and negative ionizationmode,respectively. 2.4. U-HPLC-TOFMS For the critical assessment/comparison of new method per-formance characteristics,U-HPLC-TOFMS method employingAcquitylM Ultra Performance LC system equipped by AcquityTMUPLC HSS T3 column for sample separation and LCT Premier XE TOF(Waters,Bedford, MA, USA) mass spectrometer (resolving power of12,000 FWHM) with electrospray ionization for analytes detectionwas used. More details are available in our recent paper [27]. 3. Results and discussion 3.1. DARTionization of mycotoxins In the initial phase of this study, the efficiency and practi-cal applicability of DART technology for ionization of aflatoxins,Fusarium toxins, Alternaria toxins, ochratoxins, ergot alkaloids, andsterigmatocystin (analytes possessing relatively largely differingphysico-chemical properties) was evaluated. For this purpose, sol-vent standards (acetonitrile) containing respective mycotoxin atlevel 500 ng mL-1 were analyzed (when considering sample prepa-ration procedure described in Section 2, this corresponds to arelatively high concentration in matrix -2500 ugkg-1). In the first step, various settings of ionization gas temperature (100-400°C),which represents one of the key parameters influencing the out-come of DART-MS analysis, were tested. The aim was to achieve asmuch as possible efficient thermo-desorption of analytes.As shownbelow, most mycotoxins could be transferred into gaseous phaseat temperature 350°Cwhich was found as an optimal compromisebetween signal intensity and analytes thermal desorption speed(when this process is too fast, the number of points per desorptionpeak might be insufficient). Another optimized DART parameterwas the grid electrode voltage. While the use of lower voltage(200V) in positive ionization mode enabled approx. 50% intensityincrease compared to 350V setting, 350V potential was optimalfor analytes ionized in negative mode. In line with several studiesconcerned with ionization processes occurring in DART ion source[11,23], the benefit for ionization of some mycotoxins resultingfrom introducing dopant vapours (dichloromethane or ammonia)into the region between the ion source exit and VapurM interfaceceramic tube inlet was demonstrated. Searching for target analyteions in DART mass spectra was based on compliance of accuratelymeasured masses and with their expected elemental composition;for confirmation, isotope patterns were taken into consideration.In following paragraphs,experimental data are presented in detail. The list of ions generated by DART, when analyzing mycotoxinstandard solutions, is provided in Table 1. As can be seen, mostof the examined type B trichothecenes (3-ADON, DON, deepoxy-DON, FUS-X and NIV) could be effectively ionized in negative ionmode, forming anion adducts supposing dichloromethane vapourswere present in the ionization region. No deprotonation of theirmolecules (process otherwise typical for DART ionization) tookplace, only signals corresponding to ions [M+Cl]- accompanied bythe M+2 mass spectral peaks characteristic for chlorine-containingions (see Fig. 1.), were originated. Unfortunately, the DON-3-Glc, apolar (poorly volatile) metabolite formed via glycosylation of DONdid not provide detectable signal under any experimental condi-tions employed in this study. Contrary to type B trichothecenes,tested toxins of type A group were ionized in a positive polaritymode, yielding either single [M+NH4]* adduct ion (HT-2, T-2) orboth [M+NH4]+and [M+H]*(DAS).Again, the presence of dopantvapours (aqueous ammonia in this case) was needed to assist theDART ionization. The intensities of HT-2 and T-2 toxin adduct ionswere low thus making the detection of their trace levels in matrixsamples rather difficult. On the other hand,DAS, thanks to intensiveionization yield, could be detected easily. DART ionization of Alternaria toxins (altenuene, alternariol andalternariol-met) was enabled in negative mode,[M-H]-ions ofanalytes were formed. Additionally, [M+Cl]- adducts occurred inthe presence of dichloromethane. While deprotonated moleculesof alternariol and alternariol-met were approximately four timesmore intensive compared to corresponding chlorine adducts,altenuene yielded respective ions in an inverse intensity ratio. Anal-ogous ions types,[M-H]- and [M+Cl]-, were obtained also for ZEA. Aflatoxins, another group of investigated compounds, wererepresented by AFB1,AFB2, AFG1 and AFG2. Unfortunately, poorionization efficiencies were obtained under positive DART modesetting for all these very hazardous mycotoxins, no negative ionswere formed. The intensity of [M+H]+ ions declined in orderAFB2>AFB1>AFG1~AFG2.Poorefficiency of aflatoxins ionizationby DART(APCI-likeionization technique) complies to results of sev-eral studies concerned with sensitivity of LC-MS analyses of thesenatural contaminants.Compared to APCI [10,11],electrosprayion-ization (ESI) [28,29] was documented to be the much better optionfor their control at ultra-trace levels which are of regulatory ofinterest (due to their high toxic potential maximum limits are in therange 0.0025-15.000pgkg-1, depending on matrix). On the otherhand, sterigmatocystin, in spite of structural similarity with afla-toxins, is known to provide better sensitivity with an APCI interface Overview of most intensive mycotoxins ions detected under optimized DART-orbitrapMS conditions in solvent standard (500 ng mL-1) and matrix effects observed duringanalysis of spiked wheat extract (500 ng mL-1); expressed as % of analyte response in net solvent. a Signal not detected (n.d.). DMatrix effects in extract cleaned with PSA 50mg mL-1. [28]. In line with that fact, sterigmatocystin was effectively ionizedand detected as [M+H]+ by the DART-orbitrapMS. No protonated/deprotonated molecules, their adduct or frag-ment ions were obtained under tested conditions for othermycotoxins (OTA, FB1, FB2, ergocornine, ergocrystine and ergo-sine) in net solvent. Similarly to DON-3-Glc, also these compoundsare relatively polar, and, especially in case of fumonisins and ergotalkaloids, have relatively high molecular weight(MW), what mayhamper a transfer of such analytes into gaseous phase. Of course,polarity and MW are not the only factors influencing the DARTionization of target analyte. For example, NIV and AFB1 are bothpolar and have similar MW;nevertheless, the latter one providesmuch lower signal (see Table 1). Unfortunately, fairly incompletecurrent knowledge on processes occurring during DART ioniza-tion does not allow us to explain these phenomena. In general,considering the analogy between DART and APCI techniques, ourexperimental results could be linked to behaviour of the aboveanalytes under ESI/APCI conditions. While DART-amenable myco-toxins are well ionized in APCI, for the‘problematic'compounds,ESIwas reported to be much more suitable ionization technique [29].To facilitate and/or enhance DARTionization of troublesome myco-toxins, derivatization of polar functional groups, which enablesavoiding hydrogen bonding, may represent a conceivable strategy.This approach (trimethylsilylation in particular case) has been suc-cessfully employed in the recent study by Zhou et al.[30] in order toenable DART ionization of some metabolites occurring in biologicalsamples. Taking into account the DART ionization feasibility (shownin Table 1),occurrence in food crops and maximum limits ofmycotoxins established in Regulation No 1881/2006 (EC) and its amendments, further optimization and validation experimentswere carried out only for 11 selected analytes (DON, NIV,ZEA,3-ADON,deepoxy-DON, FUS-X, altenuene, alternariol, alternariol-met, DAS and sterigmatocystin). 3.2. Optimization of sample preparation procedure and massspectrometer settings To isolate rapidly multiple mycotoxins from tested cerealswith satisfactory recoveries and to discriminate co-isolation ofpotentially interfering matrix as much as possible, modifiedQuEChERS-like procedure was employed. The target analytespresent in a crude aqueous-acetonitrile extract were transferredduring phases separation induced by anhydrous inorganic salts(MgSO4 and NaCl added), into upper organic layer, while mostof matrix components (mainly polar ones) were left in a bottomaqueous phase. However, some portion of (in crude extract abun-dant) matrix was, unavoidably, co-isolated into acetonitrile layerand interfered with DART ionization of target mycotoxins, signalsuppression was very serious for most of them. To reduce, at leastpartly, such adverse phenomena, dispersive SPE clean-up utilizingPSA and MgSO4 had to be employed. In this way, most of residualsugars, fatty and other organic acids could beremoved. In Fig. 2,the improvement of DON signal (m/z 331.0943) in dependenceon the amount of added PSA sorbent (0-100 mg/mL of extract) isillustrated. Considering sorbent cost/matrix effect decrease ratio,addition 50 mg PSA per 1ml of acetonitrile extract (containing200mg matrix equivalent) was found as optimal. As shown inTable 1, under these conditions, the signal intensities of myco-toxin ions were in the range 11.6-39.0% intensity compared to Fig. 1. Mass spectra of examined mycotoxins obtained by DART-orbitrapMS analyses of wheat extract (spike 500 pg kg-) at mass resolving power setting 50,000 FWHM.(▲)Ions yielded by target analytes. those measured in net solvent. Worth to notice,matrix effects weremore severe in DART-orbitrapMS compared to LC-MS methodswhich are commonly used for mycotoxins analysis. The extent ofion suppression in the latter approach was shown to be matrix-dependent [3,27],e.g. pronounced differences were documentedbetween wheat and maize, obviously due to different nature ofco-eluting matrix components. Contrary to that, in this study, theintensity of target analytes ionization was comparable for bothtested matrices,wheat and maize. We assume this complies toalmost identical total ion current, that was recorded for respectiveextracts, in spite of differences in co-extracts pattern observed inDART-orbitrapMS spectra (mainly pronounced in negative mode). As documented in Fig. 1,numerous ions of matrix componentswith m/z values very close to both ions and isotope ions of analytes were present in the mass spectra of purified sample extracts. Toachieve accurate mass measurement needed for unbiased identi-fication and to ensure reliable quantitation, high resolving powerof the instrument was utilized. The ExactiveTM mass spectrome-ter employed in our study enabled acquisition under four differentmass resolving power settings, ranging from 10,000 to 100,000FWHM. While the sensitivity of measurement was not influencedby the selected mass resolving power, this parameter defined theacquisition rate. Based on performed experiments, resolving power50,000 FWHM was chosen optimal for the analyses, as it offeredboth satisfactory resolution of analyte/interference spectral peaksand reasonable acquisition rate (2 spectra s-1). Since the typi-cal width of the ‘desorption' peak of target mycotoxins at lowestcalibration levels (LCLs, discussed below) was no less than 6 s,min- a Lowest calibration levels (LCLs). Relative standard deviation (RSD) calculated from 5 repeated analyses. imum 12 points per peak were recorded. In case resolving power of100,000 FWHM was set, the number of scans across the peak waslower than 9, thus not sufficient for quantitation.Employing 50,000FWHM resolving power, good mass accuracy, with mass errors inthe range from -3.6 to +3.8 ppm, was routinely obtained for testedcompounds in examined samples, including extracts spiked atLCLs. 3.3. Quantitative analysis Worth to notice, that most of published studies in the fieldof ambient mass spectrometry have employed DART-MS tech-nique mainly for screening/profiling purpose, only few of themhave documented its use for quantification of target analyte(s)con-sidering general requirements for quality parameters of obtainedresults [31]. To fill in this gap, in the final phase of our study, we focused on demonstration of possible use of DART-orbitrapMStechnique for reliable direct quantitative control of some myco-toxins in wheat and maize extracts prepared in a simple, quickway. For quantitative purposes, the most abundant ions yieldedby respective mycotoxins (see Table 1) were used.With regard toachieved mass accuracy at resolving power setting 50,000 FWHM,narrow isolation window of 4ppm could be employed to extraction records (chronograms) of target analytes with high selectiv-ity. For evaluation of repeatability (expressed as relative standarddeviation,RSD,n=5)ofDART-orbitrapMS method, peak areas werepreferred since they were shown to give better results comparedto calculations based on peak heights. Typical RSDs for cerealsspiked by mycotoxins at 500 ugmL-1 level ranged from 8.1% to14.3%, depending on respective compound, see Table 2. Furtherdecrease of RSDs (4.7-8.7%) and improved linearity of calibra-tion plots compared to external calibration, was obtained when Fig. 2. The impact of dispersive SPE clean-up employing PSA and MgSO4 on DON (m|z 331.0943±4ppm) signal intensity in wheat extract (spike 500 ug kg). Given sorbentamounts were used for 4 ml of acetonitrile extract containing equivalent 800 mg of matrix; solvent standard concentration was 100 ng mL-. isotopically labeled internal standards were employed for compen-sation of absolute signal fluctuation (Fig. 3). Regardless the use ofisotope dilution technique for calibration,regression coefficients>0.99 were obtained for all 11 target analytes (measured in therange 50-5000gkg-). To characterize sensitivity of measure-ments,LCLs (concentrations which could be routinely detected andquantified within the long term period) were estimated,see Table 2.The common calculation of detection (LODs) and quantification(LOQs) limits based on signal-to-noise ratio could not be employed,as under narrow extraction window setting (4ppm in particu-lar case) no chemical noise was present in the record. Neededto emphasize that in case of regulated mycotoxins (DON, ZEA),DART-MS method LCLs allowed a reliable control of maximum lim-its established for tested matrices [1]. The recoveries of all target DON concentration (rg kg) Fig. 3. Calibrations employing matrix-matched standards and isotope dilution.(A) Extracted target ion record: DON (m|z 331.0943±4ppm), concentration in the range50-2500 ugkg-1;(B)extracted target ion record:13C15-DON(m|z346.1446±4ppm),concentration 500 pg kg-1;(C)externalcalibration curve.(D)Isotope dilution calibrationcurve. Error bars are standard deviations calculated from three repeated injections. Table 3Comparison of trueness of data obtained by DART-orbitrapMS and U-HPLC-TOFMS analysis of certified reference materials. Material description Analyte (assigned/certified value) DART-orbitrapMS U-HPLC-TOFMSC External calibration/isotope dilution Mean(ugkg-) RSD (%) Mean (pgkg-1) RSD(%) CRM, maize flour DON (474±30 pgkg-) 459/486 9.0/5.9 500 4.1 CRM, wheat flour DON (2800±200pgkg-) 2608/2819 6.7/5.4 2754 2.2 CRM, ground millet ZEA (648±140pgkg) 5839/613 7.5/6.0 637 3.4 CRM, maize flour ZEA (60±9pgkg-1)
-
1/8
-
2/8
还剩6页未读,是否继续阅读?
继续免费阅读全文产品配置单
华质泰科生物技术(北京)有限公司为您提供《谷物中霉菌毒素检测方案(液质联用仪)》,该方案主要用于食用农产品中霉菌毒素检测,参考标准《暂无》,《谷物中霉菌毒素检测方案(液质联用仪)》用到的仪器有null。
我要纠错
相关方案


 咨询
咨询