

方案详情文
智能文字提取功能测试中
Light Metals 2009 Edited by: Geoff BearneTMS (The Minerals, Metals & Materials Society),2009 Xiangwen Wang Alcoa Primary Metals Alcoa Technical Center,PA USA Keywords: Alumina, Alumina Dissolution, Aluminum Smelting Alumina dissolution in cryolitic electrolytes has been a subjectof intensive studies, and its relation to the alumina physicalproperties had been attempted through various studies over pastdecades as reported in the open literature. The findings fromthese reported lab studies have been proved to be difficult torelate alumina dissolution rate in industrial operating cells due tolack of similarities between the two settings.Alcoa has beenusing a different experimental approach to measure aluminadissolution rate to monitor ore quality changes for providingnecessary information to our smelting operations. This paperbriefly describes the background for alumina dissolution studies,experimental setup and procedures for measuring dissolutionrate. Some comparison results of typical good and bad aluminaores in term of dissolution rate are presented. Introduction Alumina has been the only feed material to electrolysis cells sincethe invention and industrial adoption of the Hall -Heroult processfor aluminum metal production. It is one of the most studied andyet least understood materials used for aluminum smelting.Alumina ores not only affect the produced aluminum metalquality, but importantly have different dissolution rates into thecryolitic bath, which in turn influences the smelter operation andperformance. Alumina must dissolve in the bath before it canundergo electrolysis. Dissolution rate of alumina in cryolitic electrolyte relates to itsphysicochemical properties. These physicochemical propertiesmay include commonly specified and measurable parameters:particle size distribution, density, surface area, angle of repose,alpha (a) phase content, attrition index (AI), water content(moisture, LOI) and chemical composition (soda content andother impurities). Each of these properties, to a certain degree,affects how it is dissolved in the molten bath. Alumina particle size distribution is one of the most closelymonitored specifications by refineries and smelters (1, 2). IItseffect to dissolution rate is controversial: Some studies reportedthat increased alumina particle size favors a faster dissolution rate(3, 4) while a high percentage of fines tends to lead to lowereddissolution rate due to poor wetting (5). Some studies pointed tothat no correlation can be drawn between the dissolution rate andthe particle size (6) or median size (7). A few studies (8) foundthat alumina with a higher fraction of coarser content (100 to 160um) and highest o content (up to 40%) has the highest dissolutionrate. Studies (9, 10) also reported an increase in the fines content(up to 30%) of -325 mesh (-45 um) does not affect the dissolutionrate and beyond the level, dissolution rate is increased. Theseinconclusive and often contradictory findings are warranted for afurther study to clarify the alumina size effect. The process of dissolution takes place across solid/liquidinterface. The greater the area and the reactivity of the interface,the faster the rate of the mass transfer and therefore betterdissolution (1). There is a general indication that dissolution rateincreases with higher surface areas (6, 11 -13). It is also reportedthat for particular families of aluminas, there isi a strongcorrelation between total dissolution time and surface area. Thehigher the BET surface area, the greater the dissolution rate (7).However, it was also reported in studies (3, 14) that BET surfacearea iss notof major importance for promoting aluminadissolution. Again, similar to the particle size effect, inconclusiveand contradictory findings are the case on the surface area effecton dissolution rate. The effect of o-phase content has been widely investigated. Sincea-Al2O is the most stable form of metallurgical alumina, itdissolves slower than the less stable y-Al2O3. The dissolution ratedecreases as the alpha alumina content increases (6, 10, 15-18).Heavilycalcined aluminaadissolvesthe slowest (3, 14).Observation in a study (19) indicates that over-calcined alphaalumina fell to the bottom of the cell immediately, while under-calcined alumina floated on the surface and then traveled throughthe melt gradually in the form of agglomerates.The under-calcined alumina dissolves faster than o-Al2O3 due to a thermal-stress-induced shattering of individual particles into fragments inthe melts. There is a general consensus that high a-Al2Os contentimpedes dissolution, but there is no clear indication as how andwhat magnitude of the dissolution the a-phase impacts Low alpha alumina dissolves quicker than high alpha alumina.But low alpha alumina may also have high volatiles and high BETsurface area (11, 12), which make one suspect if other parameterssuch as BET and LOI also contribute to the higher dissolutionrate.The study (8) found little effect of a content (phasecomposition) on the dissolution rate.Other studies indicatemoisture content affected alumina dissolution favorably (1, 6, 7,20).A dramatic increase in dissolution rate was achieved byusing aluminas which release volatile in the bath (11, 12,21).Moisture contentwas claimed to beetheeimostinfluentialparameter. .Fluoride content does not appear to enhance thedissolution rate. Since alumina is actually composed of individual aluminaparticles and each particle has its own size, microstructure andmorphology, the physicochemical properties are closely inter-dependent. No single parameter can be clearly isolated and usedin correlating alumina dissolution to its properties.S.Aluminadissolution and its relation to alumina properties still represent avery complex and poorly understood area. A novel approach in studying alumina dissolution ratewasrecommended several years ago (22). Since then, few papers havebeen published in the open literature which offers neither newexperimentalapproachnornewinsights iinto theealumina dissolution mechanism or dissolution rate. An excellent reviewwas published recently offering some new insights which wereunfortunately drawn from some experimental data of studies yearsago (23). Lack of new reported studies does not mean this is no longerimportance of the topic. On the contrary, it is a widely held viewthat the alumina dissolution still represents very important issueeven for modern smelters in which more advance controlalgorithms may be employed: alumina quality aside, highamperage, less bath cavity requires alumina readily dissolves inbath once being added. Alcoa has been involved in the alumina dissolution study using adifferent approach for several years. This paper describes theexperimental method and procedures we developed.l.Somecomparison results of typical good and bad alumina ores in termof dissolution rate are presented. Experimental Procedures There are two major considerations in experimental proceduresfor alumina dissolution study: A proper experimental technique toaccurately measure alumina dissolution rate and selection ofstrictly controlled test conditions.s.The factors except for thealumina properties may all be classified as test conditions: 1.)Composition and temperature of the bath; 2.) Bath dynamics (amount of bath used and with/outstirring); 3.) Alumina introduction technique (fast and slow, largeand small quantities). 4.) Alumina sample preheat temperature before beingdumped onto molten bath surface. The bathconditions, i.e., composition, temperature, and itsdynamics, greatly alter the alumina dissolution rate. Oncealumina is fed onto the bath, the degree of dispersion of thealuminapparticlesanddthiee magnitudee ofbathsuperheat(temperature) can change the magnitude of the dissolution rate(24). Bath motion by mechanical stirring controls the bathdynamics and therefore significantly affects the dissolution rate(11, 12). Additionally, lab crucible size will also impact bathdynamics. Inconsistency in these test conditions can have a verybig negative impact on results of dissolution rate, one of majorreasons we are having contradictory results as seen in the openliterature. The major equipment and the overall arrangement for aluminadissolution are shown schematically in Figure 1. The techniquereported in this paper combines some of major methods reportedin the open literature with some new approaches. Major methodsand experimental procedures are explained below. Video Observation: A video camera was used in place of visualobservation techniques as reported (6, 9,10,15,16,19,22). Thelive video allows us to observe the stages of alumina powdersgoing through after being introduced into molten bath but beforethey completely disappeared (either dissolved or submergedbelow molten bath). The visual observation is incorporated in theother simultaneous measurementtto) understand the overalldissolution mechanisms. Ann example of video pictures ispresented in Figure 2 showing the stages of ore on the top of themolten bath1 (order from left to right and top to bottom): 1.) Ore sample was just dropped onto molten bath; 2.) after 10 seconds;3.) after 15 seconds; 4.) after 20 seconds; 5.) after 30 seconds; and6.) after 60 seconds of ore sample addition. Figure 1 Schematic showing the alumina ore dissolution ratemeasurement apparatus. Figure 2 Video pictures showing time sequence events of ore“raft”formation and subsequent dissolution in bath. Linear Voltammetry to Measure Dissolved Alumina Species: Theelectrochemical method has been the most preferred and mostused method in recent studies (3,7,14,20,24 - 26).).Thetheoretical aspect of the linear voltammetry in measuring activespecies concentration is fully described in the literature (27). Thetechnique and its accuracy in measuring alumina concentration incryolitic electrolyte were further reviewed by Richards et al (28). Thetypical voltammetric scans formeasuring aluminaconcentration in cryolitic bath are shown in Figure 3. As shownin Figure 3, when an applied anodic potential exceeds the Al2decomposition potential on a carbon anode, the anodic reactioninvolving formation of CO, occurs.As the applied potential(overpotential) further increases, the rate of the anode reactionincreases and reaches the transport rate of the O to the anodesurface, i.e., the rate of the reaction becomes concentrationdiffusion controlled. Further increase of the applied potential nolonger increases the anode current or CO formation. Once thepotential reaches that required for F ion discharge, the electrodeis immediately passivated and an anode effect occurs. The anodecurrent reaches a maximum value (the so-called critical current, ior i) and then immediately decreases to zero. The ic is a functionof dissolved Ospecies or alumina concentration in bath. Andtherefore, the alumina concentration change can be monitoredcontinuously by applying a series of cyclic scans starting from theintroduction of alumina into molten bath to the complete of allsolid alumina dissolved. Rotating Disk Electrode System: Different from all previousstudies that used some similar designs of stationary graphiteanode, a rotating disk graphite electrode was developed and usedfor this study.y. Use of rotating disk electrode can offer severalunique advantages: increased reproducibility by increasing the sharpness ofeither limiting current or critical current (peak current)on site of anode effect and therefore the accuracy of thetechnique. 2.) Independency of the measured dissolution kinetics andalumina concentration on the stirring condition (moltenbathdynamics),cellsizeaanddissolutionvesseFconfiguration. Figure 3 Anodic voltammetric scans in determining dissolvedalumina in cryolitic bath. Method of Introducing Alumina: The method of alumina additioninto the bath also impacts the dissolution rate. The height ofalumina drops (from a dropper), the velocity and angle at whichalumina first impact molten bath may affect how alumina powdersdispersion or crust (raft) formation and therefore its dissolution rate (dissolution curve) (6, 21). Because of these reasons, aspecial feeder was developed to allow the alumina addition shotmore representative to the point fed operations of Hall cells.Figure 4 shows how an alumina ore was fed and then spread overthe molten bath. Figure 4 Video pictures showing alumina being fed into thedissolution vessel and then spreading over the molten bath As shown in the series of photos from left to right and from top tobottom in Figure 4, using the specially designed feeding tube, oresample, once dropped, it spread quickly and uniformly over theopen molten bath less than 1 second.. The feeding was suchdesigned that the ore velocity and angle right impacting on themolten bath surface were a simulation of point feeder operationand consistent in all dissolution tests. Use of Immersed Thermocouple (TC) to Monitor BathTemperature: Under the same experimental condition, differentores with various physical properties will behave differently oncebeing dropped onto a molten cryolitic bath - such as formingdifferent initial curst/raft, readily dispersed right after addition,just simply sinking under the molten bath or combination of suchphenomena. Additionally, once an ore is being added,somewould experience phase changes before being dissolved. All ofthese processes impact the heat balance of the dissolution vessel,the temperature profile of the molten bath, and therefore theoverall dissolution dynamics..Monitoring the bath temperaturefrom the instant of the ore being added on the bath to the end ofthe total dissolution, would help in understanding the dissolutionmechanism. Figure 5 shows bath temperatures response of threekinds of ores after being dropped onto molten bath. Figure 5 Bath temperature responses upon introduction of sameamount of ores samples onto molten bath. Shown in Figure 5 are temperature responses to three differentkinds of ores after being fed onto the molten bath: ore 1 floated onthe top and forming raft/crust, resulted smallest temperature dropwhile ore 3 sank into the bath, having the greatest initialtemperature drop. The temperature for ore 2 was in between ore 1and ore 3, apparently resulting from partially forming raft whilepart either dispersed in or sank below bath. These three aluminasamples have three different dissolution rates as anticipated. Results and Discussion Alumina Dissolution Curve and Dissolution Rate: The rate of dissolution of an alumina ore varies during the courseof dissolution process once being introduced onto molten bath.There are no unique criteria and depending on the nature of study,several parameters may be used to measure the dissolution rate: 1.) Initial dissolution rate: the rate of the dissolution withina few seconds to up to 30 seconds once alumina powderis dropped/introduced into molten bath, 2.) Average dissolution rate: The rate is equal to the totalalumina ore divided by the total time needed. While ithas some practical application, the parameter may notbe the one for evaluating different aluminas. 3.) Dissolution rate at middle point: The rate occurred athalf of the added ore being dissolved.The termrepresents measures of dissolution rate, however, morethan likely, the time take in dissolve the first half andsecond half will be different. 4.) Dissolution rate at 75% of complete dissolution: like thedissolution at middle point, the term represents measureof dissolution rate, but has more practical use. 5.) Maximum dissolution rate: In the overall dissolutionprocess, as described previously that dissolution ratevaries, there is a maximum rate at some point of thedissolution process and may be used as a criterion injudging the overall dissolution rate of the alumina ore. Any of these terms or combination of these terms can be used inmeasuring alumina dissolution rate. The maximum dissolution rate is adopted in this study. The termis defined and derived from: Where CAl203 is the alumina concentration in bath at a time t. It isobtained through best fitting to the experimental data which aremeasured using the experimental methods described previously.Figure 6 shows typical dissolution curves for two aluminas. Theconcentration of alumina in bath is first plotted against time of thealumina addition. The kinetics of the alumina dissolution maythen be investigated. Figure 6 Two alumina concentration curves as a function of time. Shown in Figure 6 are two aluminas which exhibit very differentbehavior in their dissolution: ore 1 dissolves very rapidly andmost of it dissolved in bath within three minutes after addition.Ore 2 had a relatively slow dissolving process, lasting over tenminutes after addition. The two dissolution rate corresponding to the concentrationcurves were obtained and plotted in Figure 7. Not surprisingly,the maximum dissolution rate for ore 1 (also its initial dissolutionrate) is over 2.5 times higher than ore 2: 0.26 vs. 0.095%Al2O3/min. Figure 7 Dissolution rate as obtained from the dissolution curvesin Figure 6. In general, the greater the maximum dissolution rate, the faster theoverall dissolution rate, and the less time required for dissolvingall the alumina added in bath. For identical test conditions, thedifference in dissolution rate apparently results from differencesof alumina ores which may have very different physicochemicalproperties. Evaluation of Alumina Ores: Because of little practical information available from the openliterature and because of continuous ore quality changes fromrefineries, Alcoa has been evaluating ore qualities by measuringalumina dissolution rate in the past few years. Research activitiesincluded: Investigation of“good" and “bad” ores from potoperation perspective by relating to alumina dissolutionrate: Bench marking aluminas from internal refineries; Dissolution rate measurement of ores after specialcontrolled conditioning and treatments; Dissolution study simulating Soderberg side break andprebaked point fed operations; Design of experiment (DOE) studies to investigateeffect of particle size distribution (PSD); DOE studies to investigate impact of overall properties And studies to investigate root causes for accelerated orreduced dissolution processand relate to smelterprocess study. Examples of Dissolution Results: All aluminas are not created equal. For a specific smelter, SGAores from some refineries are preferred to ones from others.When a smelter has an option of ore supply from severalrefineries, choosing the best one (or better one) is important tosmelter’s key performance indicators. Bench mark of these SGAores first in term of dissolution rate becomes an economical andefficient way for the process. An example of such benchmark process is shown in Figures 8 and9..IFigure 8 shows the alumina maximum dissolution rate andFigure 9 the time needed to complete a 75% of dissolution of theore added for dissolution. It is noted that ore No.4 has the highestdissolution rate while Ore No.1 toke the least time in dissolving75% of the total addition. Ore No. 2 has the slowest rate and tokethe longest time to dissolve. Apparently in this case, smelter wants to try first ores No.1 andNo.4 on their pots to finally decide which ore they will use. “Good”Ores from Pot Operation Perspective: “Good”or“bad”ores are often being heard from pot operators onpotroom floor.From potroom perspective, a“bad"ore oftenrefers to increased operation difficulties such as increasedfrequency ofanode effect (AE), increased mucking and dustiness,reduced metal production due to reduced current efficiency,higher energy consumption and pot thermal imbalance. A processstudy was carried out to evaluate how variations in alumina orequality impact pot performance, specifically to relate the "good"and "bad" alumina ores to its dissolution rate, and at the sametime, the “good”and “bad”ores were comprehensively analyzedfor their properties. A statistical correlation analysis was thenperformed on the experimental data of ore dissolution ratemeasurements. Done at the “allowed”variables in the analysisare the ore physical properties; i.e., PSD, especially superfines (- 21 um), fines (-45 um), angle of repose, flowability, density,surface area, moisture, a-phase contents, and total fluorides.Variables of experimental conditions including initial aluminaconcentration in bath and bath flow (stirring conditions) are alsoconsidered. Those independent variables which have the mostsignificant influence on the alumina dissolution rate,e,wereidentified. Figure 8 lMaximum dissolution rate measured for several SGAores. Figure 9 Time Taken to dissolve 75% of total ore addition forseveral SGA ores which showing various dissolution rate (Fig. 8). Figure 10 summarizes the process flow chart of muck formation,AE frequency rate, pot instability, and pot key indicator changespossibly resulting from changes in key properties of alumina ores.In this case, the negative consequence (CE loss) was due to theunfavorable pot conditions as caused by unfavorable alumina oreproperties. As illustrated in Figure 10, the impact of ore properties to potperformance iss actually coming from slowed alumina oredissolution rate and crust formation. Once alumina ore is addedor fed into a pot, the ore has to be dissolved in a certain period oftime at a rate fast enough to maintain the alumina requirement andalso maintain a fairly consistent alumina concentration in bath. Ifthe dissolution rate is low and if a relatively higher density solidcrust forms, the crust would fall to the bottom of the pot and resultmuck formation.The consequence of the actions is loweredalumina concentration in bath and once the alumina concentration drops below a critical concentration level, an AE will occur. Theundissolved crust (due to relatively heavy density due tounfavorable ore properties) would lead to muck formation. Heavymuck would result higher pot resistance and altered current flow,which will increase pot instability. Pot muck formation, highinstability and high frequent AE will result in pot operatingdifficulties and thermal imbalance (higher pot temperature andbath superheat). The result would be loss of bath chemistry andthermal balance control, and worst of all, loss of current efficiency(29) and even early failure of pots. Impact of“Bad"Reacted Alumina Ore Abnormal PotTemperature Figure 10Reaction chain of negative impact of alumina ore on potperformance. Summaries Alumina dissolution still represents one of very important issueseven for modern smelters primarily due to continuously changingof SGA alumina quality and smelters’drive for higher efficiency.A novel technique was developed and has been used at Alcoa inevaluating alumina ores from the perspective of dissolution rate.The technique combines some of major methods including videorecording for visual observation, anodic scanning voltammetry,rotating disk electrode, and other innovative methods.S.Thecombination of the methods allows us to study and understanddissolution mechanisms in order to get to the root causes ofreduced dissolution rate. When smelters’inefficiency such as increased anode effect rateand reduced current efficiency is linked to alumina quality, theroot cause is the slowed dissolution rate which can be a result ofone or more properties changes of the alumina ore. All aluminas are not created equal and smelters often prefer onesto others. The dissolution rate of several SGA alumina ores forseveral refineries is presented and compared. The dissolution ratehas a quite large difference. Apparently, if given other physicalproperties being the same, the ones with higher dissolution rateare preferred. ( Y B ertaud and A Lectard: Light Metals, 1984, 667-686. ) ( 1 2 P. Homsi: Proc. 6" A ust. Al Smelting Workshop, ed. B. J. James et al, 1998, p73. ) ( R. K . J ain et al. : Ligh t Metals , 1983, 609-622. ) ( S.Rolseth, et al: Light Metals, 1994,351-357. ) ( H. P ham, et a l : R ev. int. H aut., R efract,1 0 , 1 9 73,37. ) ( H. Maeda, et al: Light Metals, 1985,763-780. ) ( Bagshaw and B. J. Welch: Light Metals, 19 8 6, 35-39. ) ( N. M . D r obot a n d T. I.Ol’gina: The Soviet J. of N o n- Ferrous M etals, 1 2 (English e d.), 1972, 37-39. ) ( R Johnson: Light Metals, 1981,373-387. ) ( R Johnson: JOM, No. 3,1982,63-68 ) ( G. I . K uschel and B . J. Welch: Proceed. 2nd Internationa l Alumin a Quality Workshop, P e rth,Western Australia,Oct. 14-19, 58-69. ) ( 12. T . J. Johnston and N. E. Richards: JOM , NO. 1 1,1 9 83,48-52. ) ( I.S. Kachanovskaya et al: Ts vet. Metal. 4 4, 1971, p40. ) ( R. K Jain t a l.: Proc. Of 1 5 Internationa Sy mp. On Molten Salt Chem a nd Tech., 5 9-64, Kyoto, Japan, April 20-22. ) ( J. Thonstad, et al: Light Metals, 1 971,213-222. ) ( Winkhaus: L ight Metals, 1970,1-11. ) ( J. Gerlach e t al.: Metallurgical Trans. 6B, 1975,83-86.L. N. Less: Light Metals, 1976, 315-331. ) ( X. Liu, et al: Light Metals, 1994,359-364. ) ( R. G. Haverkamp, et al: L ight M etals, 1 994, 365-370. ) ( A. N. Badshaw et a.: Light Metals, 1985, 649-659. ) ( X. Wang: Light M etals CIM 2000, 41-54. ) ( B. Welch a nd G . I . Kuschel: JOM N o.57,May 2007, p50. ) ( 24. R. G . H averkamp, B. et al : Bu l leti n of El e ctrochem., 8(7), 1992,334-340. ) ( 25. R. Hovland, et al: Proceed.Of International Symposiumon Light M etals P rocessdings and Applications, ed. C. Bickert et al. , 32d Annual C onf. O f Metallurgists o f CIM, Quebec, Can, Aug. 1 9 93, 3-16. ) ( 26. G. I. Kuschel and B.J.Welch: L ight Metals, 1991, 299-305. ) 27. A. J. Bard and L. R. Faulkner: Electrochemical Methods- Fundamentals and Applications, John Wiley & Sons,New York, 1980. N. E. Richards et al:Light Metals, 1995, 391-404.28 X. Wang: Alcoa Internal Tech Report 02-057, May 3,2002. Alumina dissolution in cryolitic electrolytes has been a subject of intensive studies, and its relation to the alumina physicalproperties had been attempted through various studies over past decades as reported in the open literature. The findings fromthese reported lab studies have been proved to be difficult to relate alumina dissolution rate in industrial operating cells due tolack of similarities between the two settings. Alcoa has been using a different experimental approach to measure aluminadissolution rate to monitor ore quality changes for providing necessary information to our smelting operations. This paper
关闭-
1/6

-
2/6

还剩4页未读,是否继续阅读?
继续免费阅读全文产品配置单
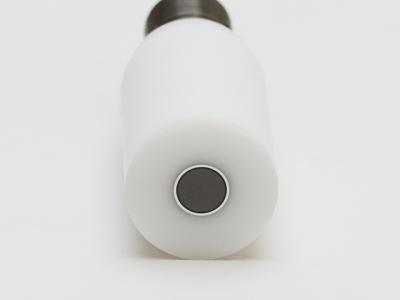
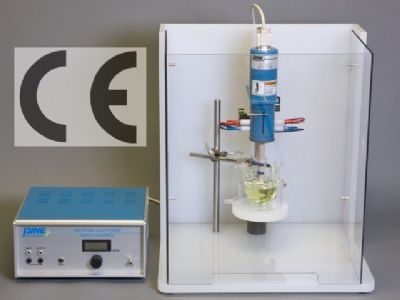
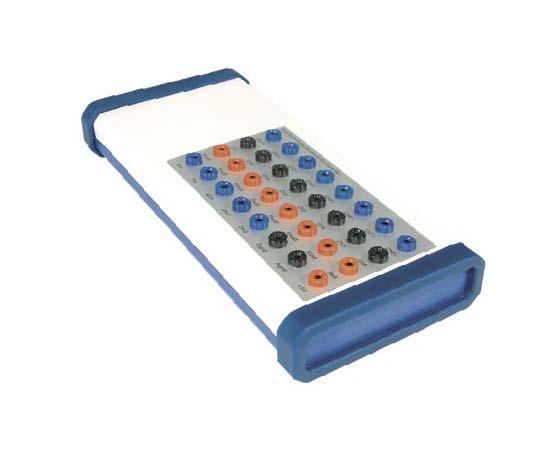
理化(香港)有限公司为您提供《旋转圆盘电极装置在冶金方面的应用-铝冶金中氧化铝溶出电解法研究》,该方案主要用于贵金属中null检测,参考标准《暂无》,《旋转圆盘电极装置在冶金方面的应用-铝冶金中氧化铝溶出电解法研究》用到的仪器有旋转圆盘圆环电极_美国PINE型号E7R9_电化学配件_理化香港、美国PINE_旋转圆盘电极装置_MSR(经典款)_RRDE电化学仪器。
我要纠错
推荐专场
电化学仪器部件、外设
更多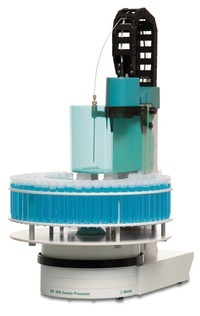
相关方案
 咨询
咨询