方案详情文
智能文字提取功能测试中
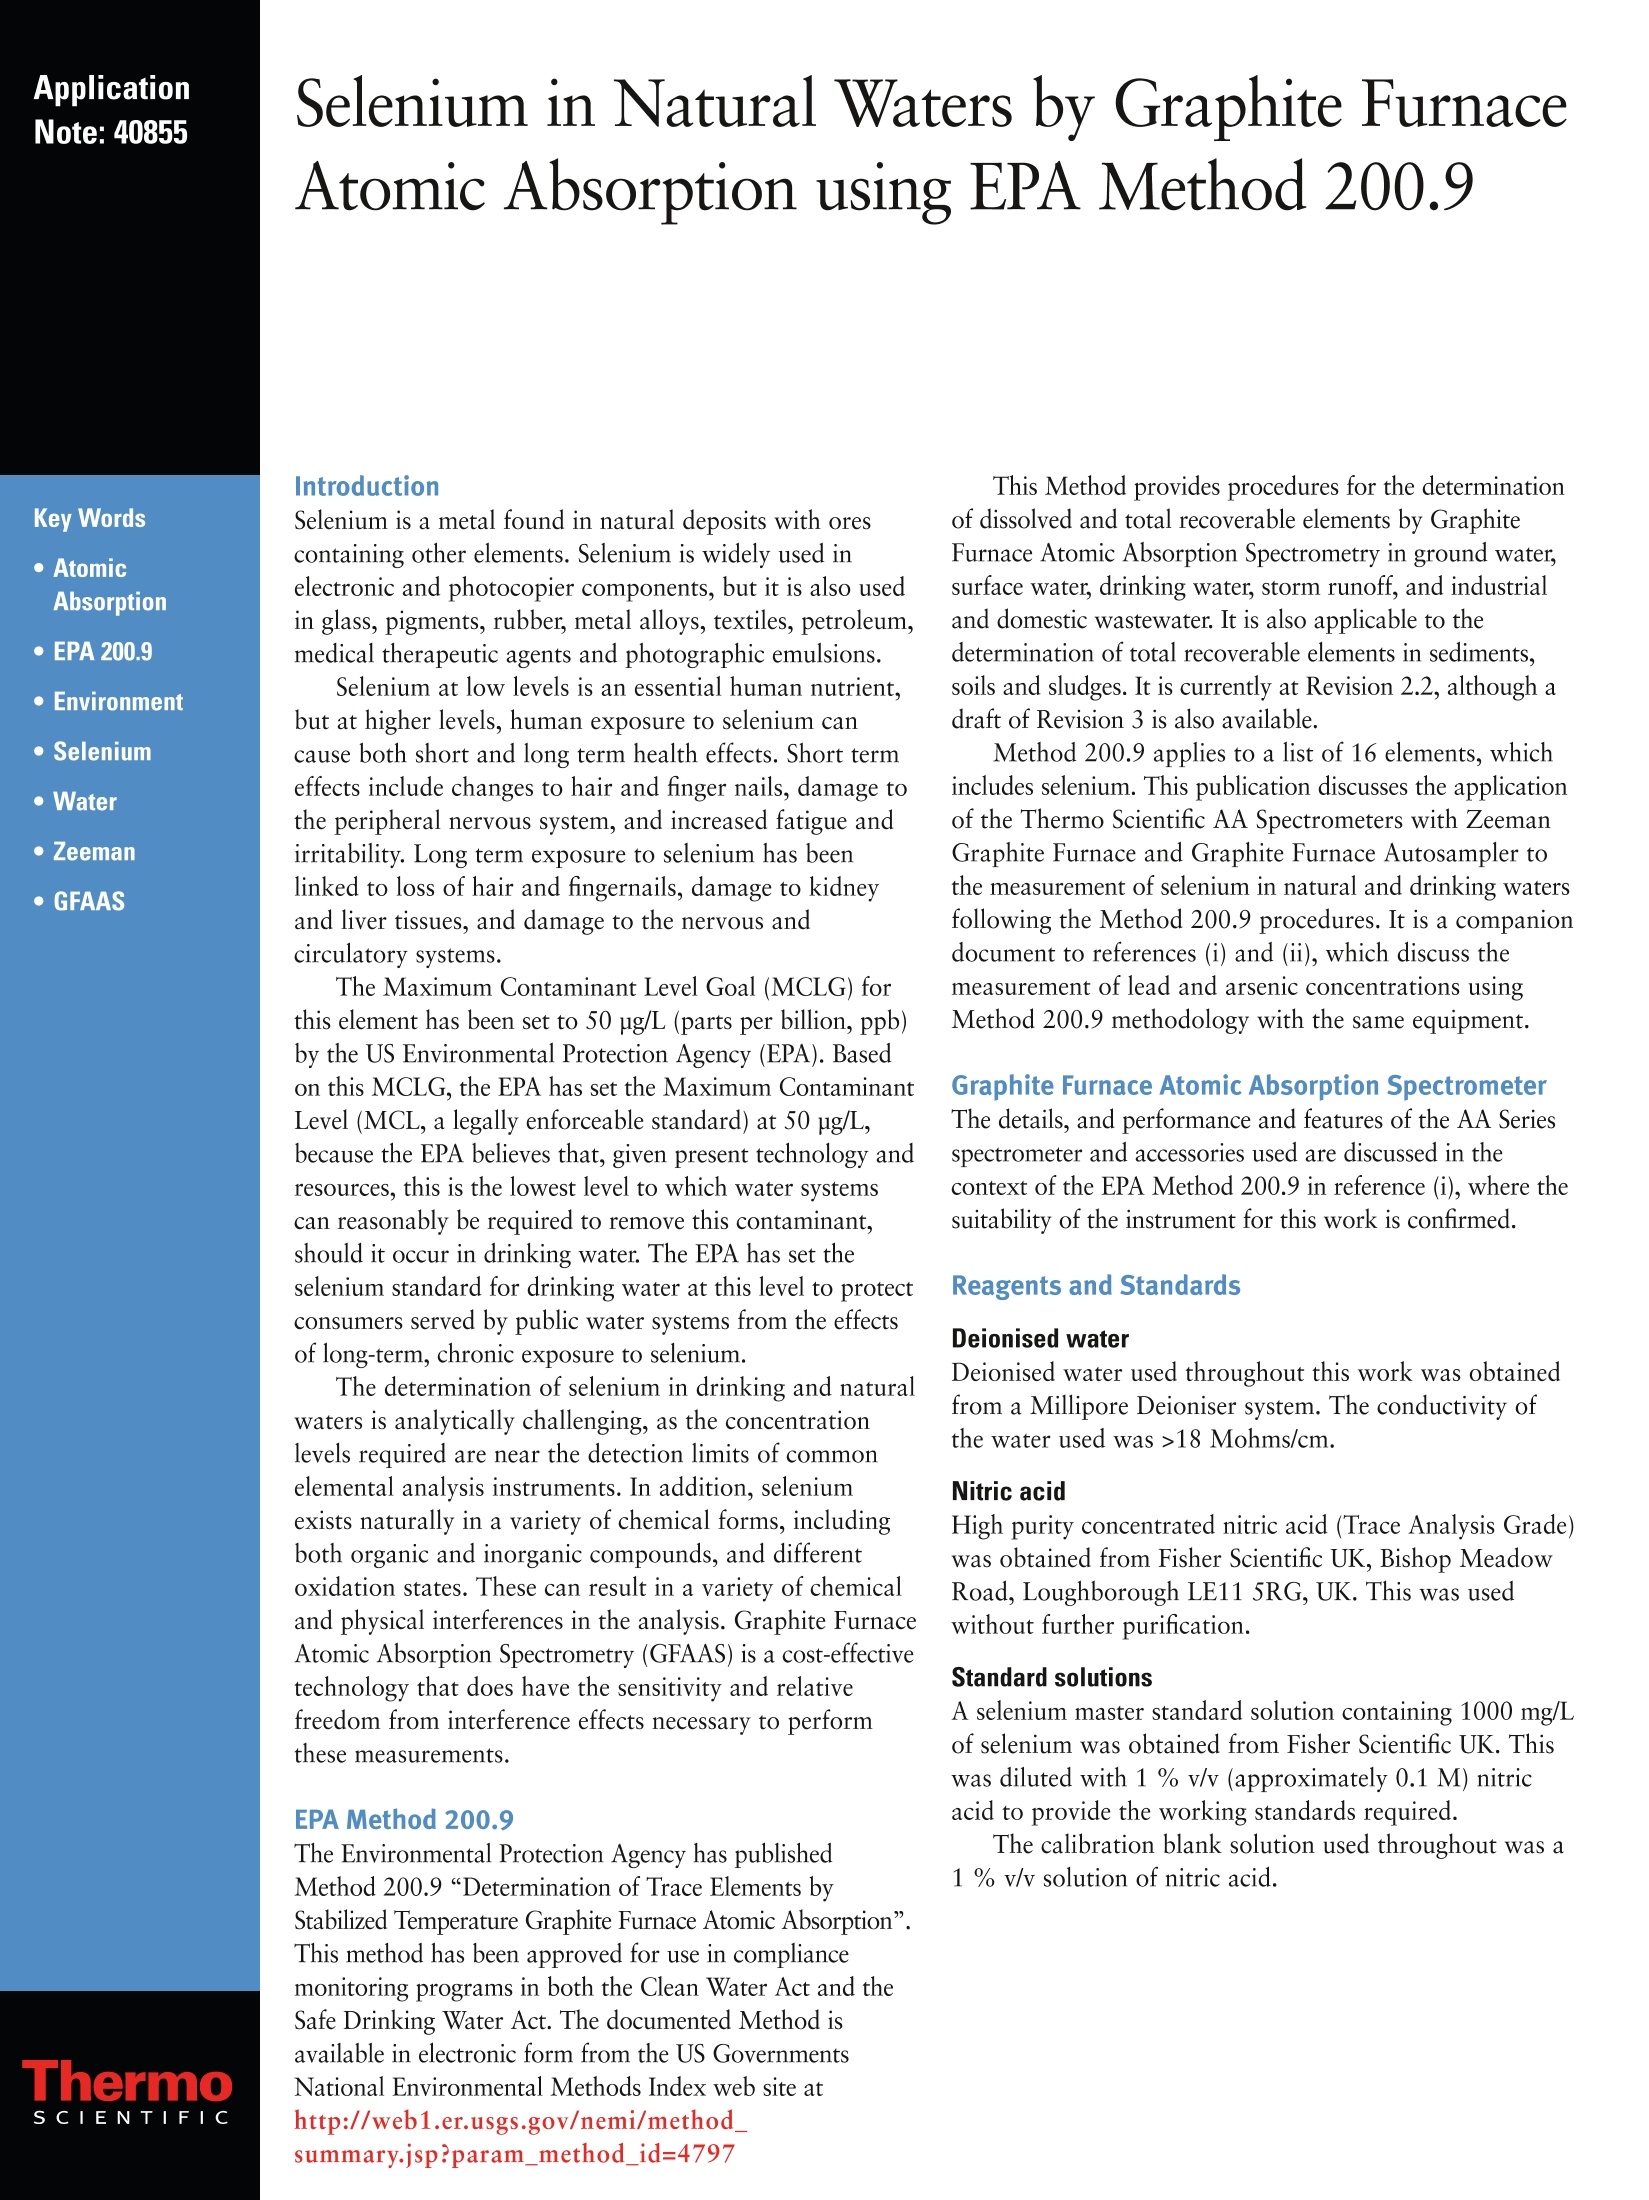
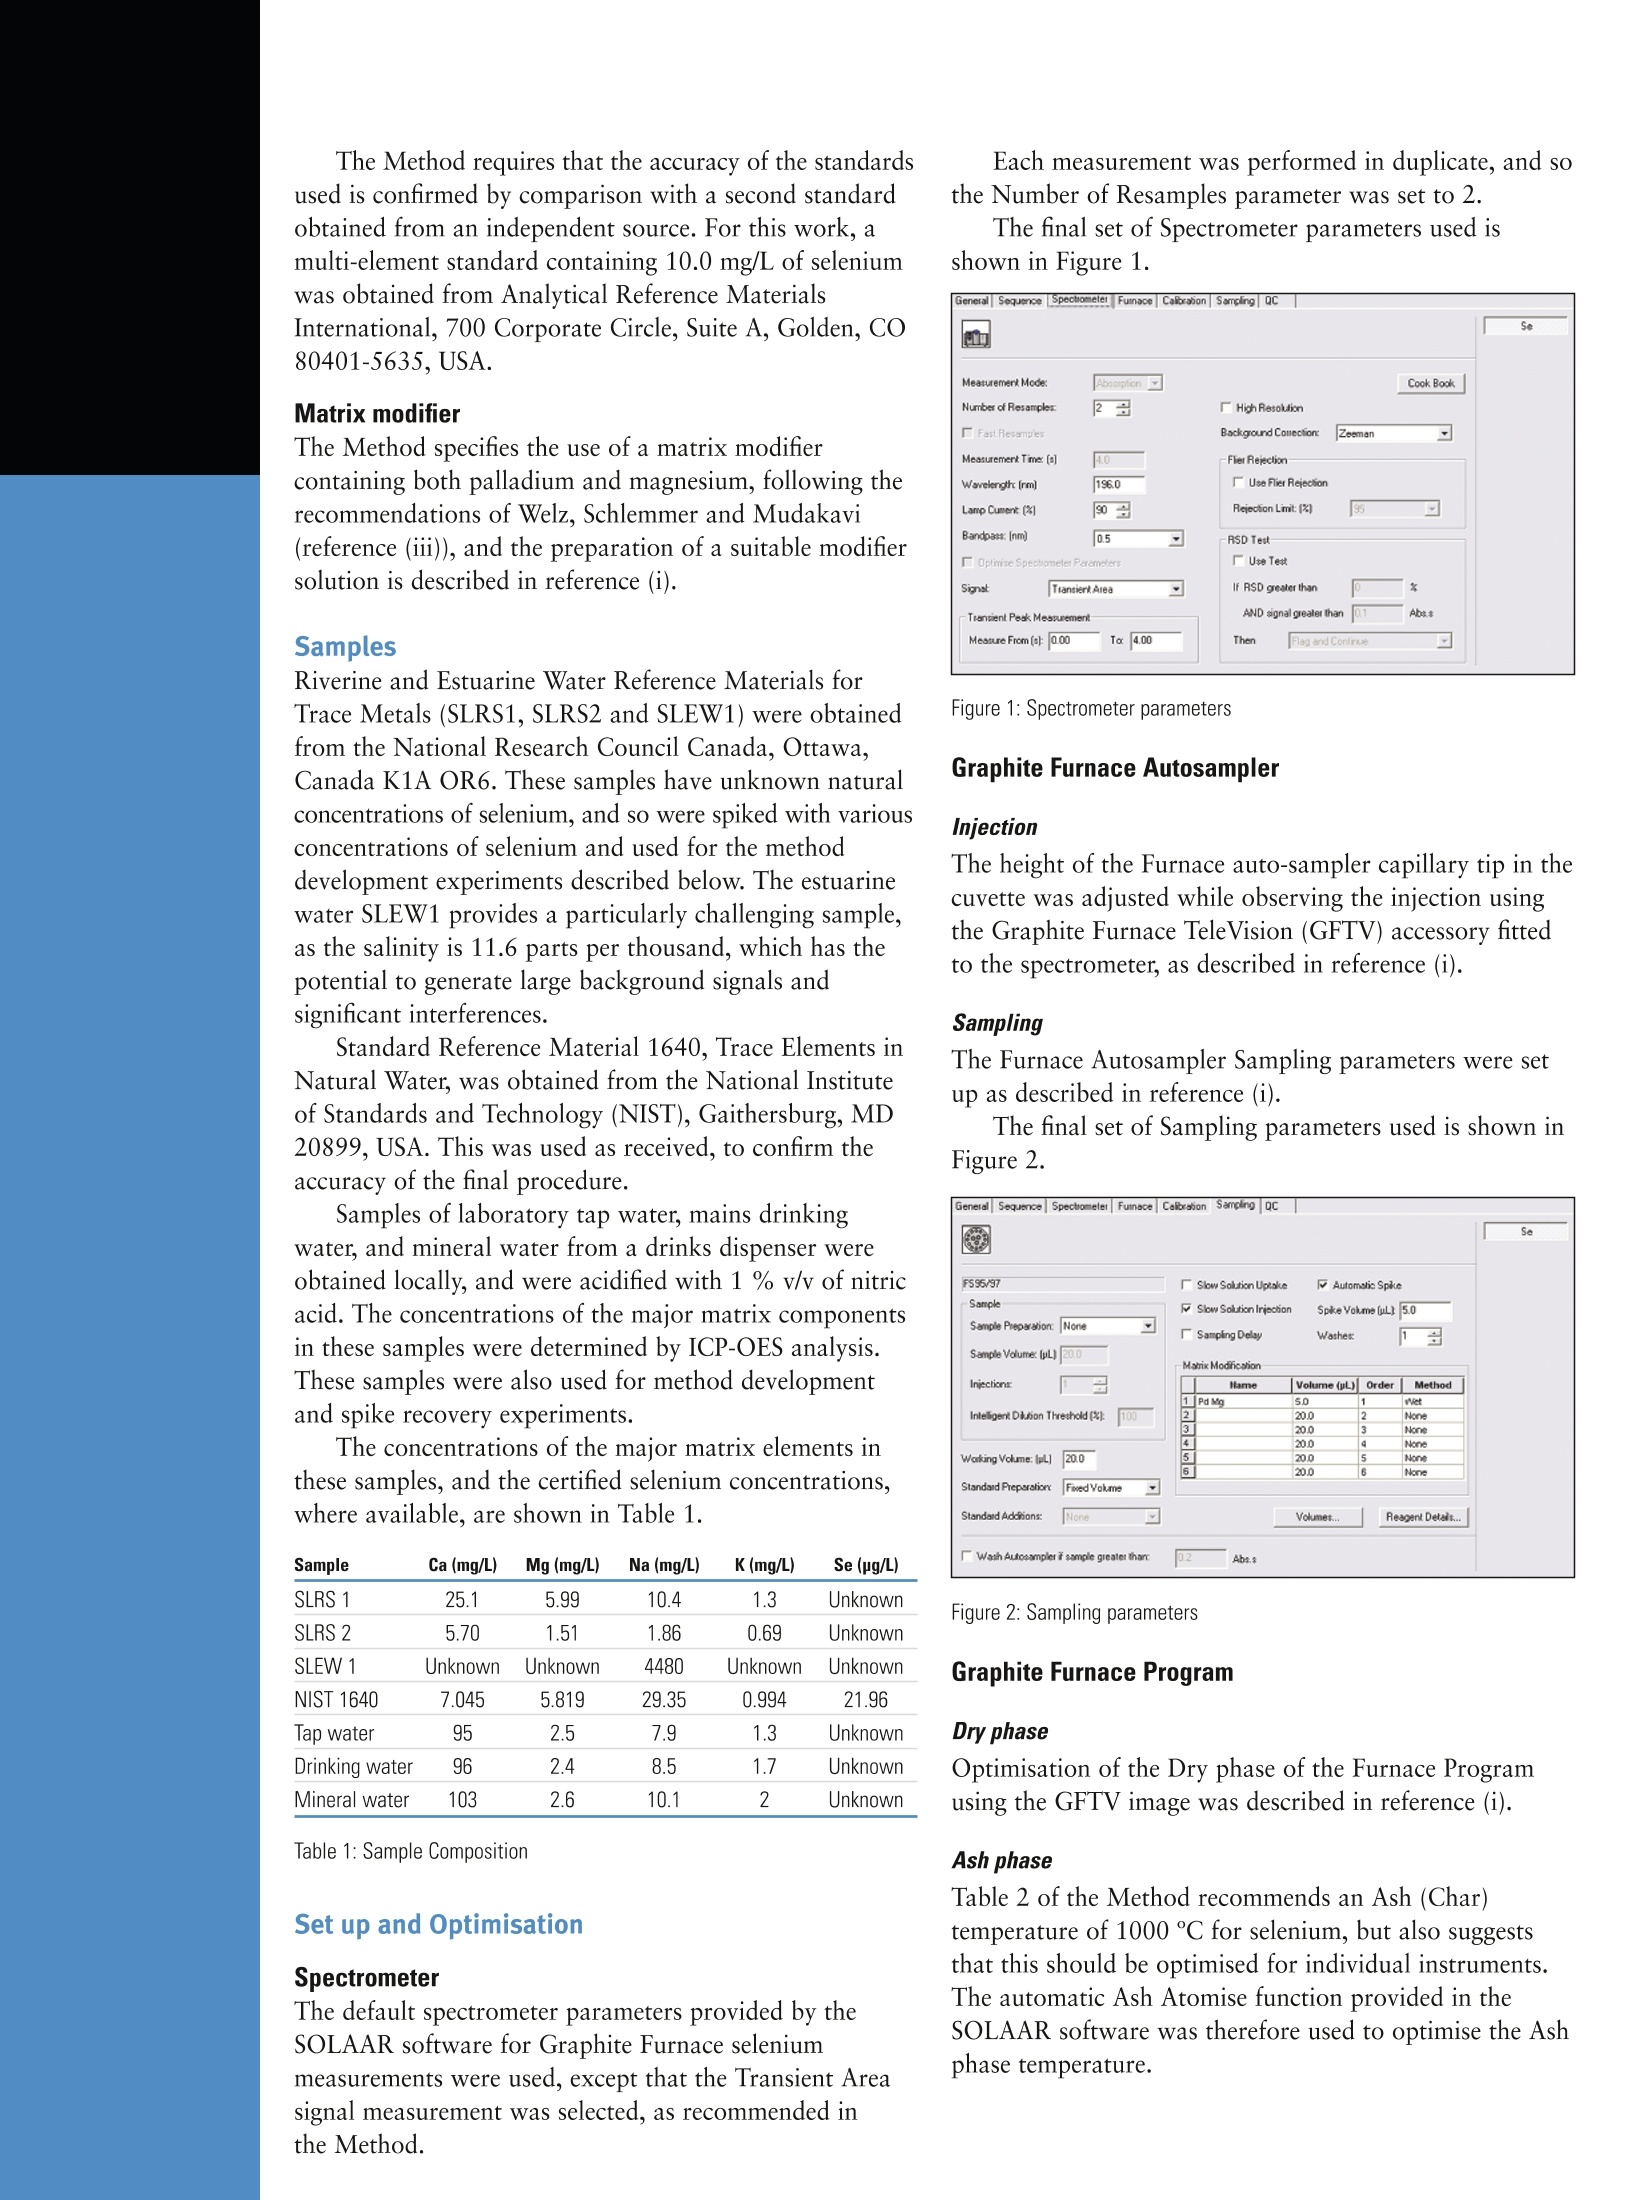
The results obtained are shown in Table 2 and Figure 9.C2008 Thermo Fisher Scientific Inc. All rights reserved. All other trademarks are the property of Thermo Fisher Scientific Inc. and its subsidiaries. Specifications, terms and pricing are subject tochange. Not all products are available in all countries. Please consult your local sales representative for details.SCIENTIFICPart of Thermo Fisher Scientific Selenium in Natural Waters by Graphite FurnaceAtomic Absorption using EPA Method 200.9 Introduction Selenium is a metal found in natural deposits with orescontaining other elements. Selenium is widely used inelectronic and photocopier components, but it is also usedin glass, pigments, rubber, metal alloys, textiles, petroleum,medical therapeutic agents and photographic emulsions. Selenium at low levels is an essential human nutrient.but at higher levels, human exposure to selenium cancause both short and long term health effects. Short termeffects include changes to hair and finger nails, damage tothe peripheral nervous system, and increased fatigue andirritability. Long term exposure to selenium has beenlinked to loss of hair and fingernails, damage to kidneyand liver tissues, and damage to the nervous andcirculatory systems. The Maximum Contaminant Level Goal (MCLG) forthis element has been set to 50 pg/L (parts per billion,ppb)by the US Environmental Protection Agency (EPA). Basedon this MCLG, the EPA has set the Maximum ContaminantLevel (MCL, a legally enforceable standard) at 50 ug/L,because the EPA believes that, given present technology andresources, this is the lowest level to which water systemscan reasonably be required to remove this contaminant,should it occur in drinking water. The EPA has set theselenium standard for drinking water at this level to protectconsumers served by public water systems from the effectsof long-term, chronic exposure to selenium. The determination of selenium in drinking and naturalwaters is analytically challenging, as the concentrationlevels required are near the detection limits of commonelemental analysis instruments. In addition, seleniumexists naturally in a variety of chemical forms, includingboth organic and inorganic compounds, and differentoxidation states. These can result in a variety of chemicaland physical interferences in the analysis. Graphite FurnaceAtomic Absorption Spectrometry (GFAAS) is a cost-effectivetechnology that does have the sensitivity and relativefreedom from interference effects necessary to performthese measurements. EPA Method 200.9 This Method provides procedures for the determinationof dissolved and total recoverable elements by GraphiteFurnace Atomic Absorption Spectrometry in ground water,surface water, drinking water, storm runoff, and industrialand domestic wastewater. It is also applicable to thedetermination of total recoverable elements in sediments,soils and sludges. It is currently at Revision 2.2,although adraft of Revision 3 is also available. Method 200.9 applies to a list of 16 elements, whichincludes selenium. This publication discusses the applicationof the Thermo Scientific AA Spectrometers with ZeemanGraphite Furnace and Graphite Furnace Autosampler tothe measurement of selenium in natural and drinking watersfollowing the Method 200.9 procedures. It is a companiondocument to references (i) and (ii), which discuss themeasurement oflead and arsenic concentrations usingMethod 200.9 methodology with the same equipment. Graphite Furnace Atomic Absorption SpectrometerThe details, and performance and features of the AA Seriesspectrometer and accessories used are discussed in thecontext of the EPA Method 200.9 in reference (i), where thesuitability of the instrument for this work is confirmed. Reagents and Standards Deionised water Deionised water used throughout this work was obtainedfrom a Millipore Deioniser system. The conductivity ofthe water used was >18 Mohms/cm. Nitric acid High purity concentrated nitric acid (Trace Analysis Grade)was obtained from Fisher Scientific UK, Bishop MeadowRoad,Loughborough LE11 5RG, UK. This was usedwithout further purification. Standard solutions A selenium master standard solution containing 1000 mg/Lof selenium was obtained from Fisher Scientific UK. Thiswas diluted with 1 % v/v (approximately 0.1 M) nitricacid to provide the working standards required. The calibration blank solution used throughout was a1% v/v solution of nitric acid. The Method requires that the accuracy of the standardsused is confirmed by comparison with a second standardobtained from an independent source. For this work, amulti-element standard containing 10.0 mg/L of seleniumwas obtained from Analytical Reference MaterialsInternational, 700 Corporate Circle, Suite A, Golden, CO80401-5635, USA. Matrix modifier The Method specifies the use of a matrix modifiercontaining both palladium and magnesium, following therecommendations of Welz, Schlemmer and Mudakavi(reference (iii)), and the preparation of a suitable modifiersolution is described in reference (i). Samples Riverine and Estuarine Water Reference Materials forTrace Metals (SLRS1, SLRS2 and SLEW1) were obtainedfrom the National Research Council Canada, Ottawa,Canada K1A OR6. These samples have unknown naturalconcentrations of selenium, and so were spiked with variousconcentrations of selenium and used for the methoddevelopment experiments described below. The estuarinewater SLEW1 provides a particularly challenging sample,as the salinity is 11.6 parts per thousand, which has thepotential to generate large background signals andsignificant interferences. Standard Reference Material 1640, Trace Elements inNatural Water, was obtained from the National Instituteof Standards and Technology (NIST), Gaithersburg, MD20899,USA. This was used as received, to confirm theaccuracy of the final procedure. Samples of laboratory tap water, mains drinkingwater, and mineral water from a drinks dispenser wereobtained locally, and were acidified with 1% v/v of nitricacid. The concentrations of the major matrix componentsin these samples were determined by ICP-OES analysis.These samples were also used for method developmentand spike recovery experiments. The concentrations of the major matrix elements inthese samples, and the certified selenium concentrations,where available, are shown in Table 1. Sample Ca (mg/L) Mg (mg/L) Na(mg/L) K (mg/L) Se (pg/L) SLRS1 25.1 5.99 10.4 1.3 Unknown SLRS 2 5.70 1.51 1.86 0.69 Unknown SLEW 1 Unknown Unknown 4480 Unknown Unknown NIST 1640 7.045 5.819 29.35 0.994 21.96 lap water 95 2.5 7.9 1.3 Unknown Drinking water 96 2.4 8.5 1.7 Unknown Mineral water 103 2.6 10.1 2 Unknown Table 1: Sample Composition Set up and Optimisation Spectrometer The default spectrometer parameters provided by theSOLAAR software for Graphite Furnace seleniummeasurements were used, except that the Transient Areasignal measurement was selected, as recommended inthe Method. Each measurement was performed in duplicate, and sothe Number of Resamples parameter was set to 2. The final set of Spectrometer parameters used isshown in Figure 1. Figure 1: Spectrometer parameters Graphite Furnace Autosampler Injection The height of the Furnace auto-sampler capillary tip in thecuvette was adjusted while observing the injection usingthe Graphite Furnace TeleVision (GFTV) accessory fittedto the spectrometer, as described in reference (i). Sampling The Furnace Autosampler Sampling parameters were setup as described in reference (i). The final set of Sampling parameters used is shown inFigure 2. Figure 2: Sampling parameters Graphite Furnace Program Dry phase Optimisation of the Dry phase of the Furnace Programusing the GFTV image was described in reference (i). Ash phase Table 2 of the Method recommends an Ash (Char)temperature of 1000 ℃ for selenium, but also suggeststhat this should be optimised for individual instruments.The automatic Ash Atomise function provided in theSOLAAR software was therefore used to optimise the Ashphase temperature. A typical, automatically generated Ash plot for a spikedsample of the drinking water is shown in Figure 3. Thisplot shows that Ash (Char) temperatures up to 1350 ℃can be used without significant loss of the analyte. However,it also reveals a small decrease in the signal that takes placeabove 1100C. This decrease is not present in the Ash plotfor the calibration standard, and so slightly low recoveryof the analyte from this sample will be seen if Ash phasetemperatures above 1100C are used. For this work,therefore, the Ash phase temperature of 1000 ℃ that issuggested in Table 2 of the Method was used. Figure 3: Automatic Ash Atomize plot for a spiked Drinking Water sample The change in the background signal from the spikedDrinking Water sample with the time of the Ash phasewas investigated, and the results are shown in Figure 4. Figure 4: Ash phase time optimization results. From these results, an Ash phase time of 30 secondswas selected. As discussed in reference (i), the 200.9 Method specifiesthe use of an internal cuvette gas containing 5 % hydrogenin argon for the Dry and Ash phases of the furnace program,to assist in the removal of halide ions, and to reduce thepalladium contained in the modifier to the metallic formwhich stabilises the analytes most efficiently. However, ithas been shown in reference(iii) that the presence ofhydrogen in the cuvette during the atomization phase depresses the selenium signal. Section 4.4 of the Methodtherefore recommends that an additional furnace programphase to purge residual hydrogen from the cuvette withpure argon should be used before the Atomize phase. The signal from a selenium standard solution measuredwithout using hydrogen in any phase was compared withthe signals from measurements using the hydrogen inargon mixture for the Dry and Ash phases, with a Purgephase at the same temperature as the Ash phase, and ofvarying duration. The results are shown in Figure 5. Figure 5: Purge phase optimisation results A 10 second Purge phase restores around 95 % of thesignal, but it was not possible to eliminate the signalsuppression caused by the hydrogen entirely. Atomize phase The Method recommends an atomization temperature of2000℃ for selenium. However, detailed investigations usingthe automatic Ash Atomize facilities provided by the SOLAARsoftware revealed that this temperature was rather low.More importantly, the optimum atomization temperaturewas found to vary significantly between the different samples,and between the samples and the standard solutions. This isshown in Figure 6, where the atomize plots for a simplestandard solution, a spiked drinking water sample, and theNIST1640 CRM sample are compared. Figure 6: Atomize plots for different samples Figure 6 shows that the optimum atomize temperaturesfor the standard and NIST 1640 samples are 2150 ℃ and2200℃ respectively, but the spiked Drinking Water samplerequires at least 2300 ℃. This implies that it is not possibleto choose a single optimum temperature that is suitablefor all types of sample, and a compromise atomizetemperature of 2250 ℃ was finally selected. With thistemperature, an atomize time of 4 s was found to besufficient to capture the entire signal. A typical selenium signal from the NIST 1640 CRMmeasured under these conditions is shown in Figure 7. Figure 7: Selenium signal with final atomization parameters The final set of Graphite Furnace parameters used isshown in Figure 8. Figure 8: Optimised Furnace Program Initial Demonstration of Performance Each laboratory using the 200.9 Method is required tooperate a formal Quality Control (QC) program, includingan Initial Demonstration of Performance. This is discussedin detail in reference (i). Linear Dynamic Range The details of the experiments used to determine theLinear Dynamic Range (LDR) using the automatic standardpreparation facilities provided by the Furnace auto-samplerare described in reference (i). concentration response response estimation error (pg/L) (abs.s) (abs.s) (abs.s) 0 0.00578 30 0.12799 60 0.25166 90 0.37402 120 0.48452 150 0.60954 0.60985 0.00031 0% 180 0.70851 0.73020 0.02169 3% 210 0.81261 0.85055 0.03794 4% 240 0.90727 0.97090 0.06363 7% 270 0.99318 1.09125 0.09807 9% 300 1.03934 1.21160 0.14226 12% Table 2: LDR Results Figure 9: LDR Estimation The results show that the calibration is slightly curvedat the higher signal values. A least squares linear fit to theblank and first four calibration points gave an excellentstraight line, with a correlation coefficient (R2 value) of0.9996. The signal response for the 270 pg/L standard is9 % down from the value estimated by extrapolating thisline, and so the upper limit of the LDR is at this level. Calibration parameters Based on the results of the LDR estimation and the MCLthat is required to be measured, a top standard concentrationof 100 ug/L was used. This is well below the upper limitof the LDR defined by the Method, and the calibrationgraph shows a very small amount of curvature. TheFurnace auto-sampler was used to automatically dilute a100 ug/L standard to provide three calibration points, andthe Segmented Curve calibration algorithm provided inthe SOLAAR software was used to eliminate the effects ofthe residual curvature. The final calibration parameters used are shown inFigure 10, and a typical calibration graph measured withthese parameters is shown in Figure 11. Figure 10: Calibration parameters Figure 11: Typical calibration graph Quality Control Sample The Method specifies that the calibration standards andacceptable instrument performance must be verified by thepreparation and analysis of a Quality Control Sample(QCS). The QCS used in this work contained 20.0 ug/L ofselenium, and was prepared from a Test Standard suppliedby Analytical Reference Materials International, asdescribed in reference (i). Five separate samples of the QCS were analysed atvarious times throughout this work, and the results areshown in Table 3. Sample Measured concentration (pg/L) QCS 1 22.0 QCS 2 21.0 QCS 3 20.9 QCS 4 20.7 QCS 5 20.7 Mean 21.1 Relative standard deviation 2.6% Recovery 105.3 % Table 3: QCS Analysis Results The signal response recorded for the QCSmeasurements was approximately 0.08 abs.s.The Methodrequires that the analytical signal measured for the QCSshould be approximately 0.1 abs.s, and the measured concentration should be within ±10 % of the stated value.These results confirm that the calibration standards andinstrument performance are acceptable. Method Detection Limit The Method requires that the Method Detection Limit(MDL) must be established for all analytes, and theprocedure for doing this is described in detail in reference (i). The Check Instrument Performance Wizard providedin the SOLAAR software was first used to estimate theInstrumental Detection Limit. The Wizard reported anIDL of 1.9 pg/L, with a characteristic concentration of0.8 ug/L, a Drift factor of 0 and no warnings. The IDL forselenium measured under the conditions described hastherefore has been shown to be 1.9 pg/L. The procedure for estimating the MDL requires thatthe laboratory blank (1 % nitric acid) should be fortifiedwith the analyte at a level of 1-3 times the estimated IDL.For initial estimates of the MDL, the laboratory blankwas therefore fortified with 2.0 pg/L of selenium. TheMethod requires that the relative standard deviation of theseven replicate results used to calculate the MDL shouldbe greater than 10 %, to confirm that the analyteconcentration in the fortified blank is not inappropriatelyhigh. The result of a typical set of 7 replicate analyses ofthese solutions is shown in Table 4. MDL1 2.39 MDL2 2.61 MDL3 2.62 MDL4 3.08 MDL5 2.50 MDL6 2.65 MDL7 2.17 Mean Method Detection Limit Relative Standard Deviation 10.8% Table 4: MDL Results The MDL was estimated four times during this work,as part of other analytical runs. All estimates met thecriteria set out in the Method. The mean value of all theestimates was 1.2 ug/L, which can be considered to berepresentative of the performance of the laboratory andthe instrument. The relative standard deviation of thesefour MDL estimates was 30 %. The upper limit of the LDR for selenium has beenshown to be 270 pg/L. Recovery of the selenium containedin the QCS sample was 105.3 %, and the Method DetectionLimit was found to be 1.2 pg/L. These results obtained confirm that the Thermo ScientificGFAAS instrument meets or exceeds the requirements setout for the Initial Demonstration of Performance in theEPA 200.9 Method for the determination of selenium. Assessing Laboratory Performance Section 9.3 of the Method sets out a number of QCprocedures intended to assess the laboratory performance.These must followed for each batch of samples that areanalysed, and are discussed in detail in reference (i). Several typical batches of samples were analysed duringthis work, using the analysis parameters developed asdescribed above, and the specified QC procedures wereincluded in the Analysis Sequence. The QC procedureswere implemented using the automatic QC Test functionalityprovided in the SOLAAR software. All QC Tests routinelypassed the acceptance criteria. The database filtering functions provided by theSOLAAR software were used to automatically collate theresults for the Continuing Instrument Performance Checkresults for the sample runs performed over a three weekperiod, and present them as QC Control Chart, shown inFigure 12. Figure 12: Continuing IPC results over 3 weeks All the results are comfortably within the control limits,and show that the analysis is under control. Analyte Recovery and Data Quality Section 9.4 of the Method defines a series of procedures fordetermining the analyte recovery of Laboratory FortifiedMatrix (LFM) samples. Analyte recoveries must be in therange 70 -130 %. The Method also specifies that thebackground absorbance signal from the samples must be<1.0 abs.s before the results can be considered to be reliable. For this work, analyte recoveries for all the sampleanalysed were assessed by automatically spiking the samplesusing the Furnace auto-sampler facilities. The spike increasedthe sample concentration by an amount equivalent to 25 pg/Lin the original sample. Typical results obtained are shownin Table 5. Sample Background Measured Measured LFM Analyte signal sample sample Recovery (abs.s) concentration concentration (pg/L) (pg/L) SLRS 1 0.06 1.6 25.3 95% SLRS 2 0.07 nd 23.8 95% SLEW 1 0.55 1.5 10.4 36% lap water 0.08 nd 23.6 94% Drinking water 0.08 1.4 23.1 87% Mineral water 0.07 nd 22.9 92% nd= not detected. The measured result was below the MDL of 1.2 pg/L.Table 5: LFM results The background signals recorded for these samplesare all well below the 1.0 abs.s limit, and so the resultscan be considered to be reliable. The recoveries for allsamples except the high salinity estuarine water sampleSLEW1 are within the acceptable range, and so thisimplementation of the Method has been shown to giveacceptable analyte recoveries for the range of low salinitywater samples examined. The Method goes on to define procedures that shouldbe used when the analyte recoveries fall outside theacceptable limits. The SLEW1 sample, and an LFMprepared from it with a spike concentration of 20 ug/L,were therefore analysed using the Method of StandardAdditions (MSA), as defined in Section 11.5 of theMethod. The results obtained are shown in Table 6. signal (abs.s) concentration (pg/L) SLEW1 0.48 nd SLEW1 LFM 0.38 20.7 103.5 % nd= not detected. The measured result was below the MDL of 1.2 ug/L. Table 6: Results using MSA calibration The Standard Additions calibration graph for theSLEW1 LFM is shown in Figure 13. Figure 13:SLEW1 LRM using MSA calibration As a further check on the Data Quality, a sample ofthe NIST 1640 Certified Reference Material (Trace Elementsin Natural Water) was analysed five times over a period ofthree weeks. The selenium concentration in this material iscertified at 21.96±0.51 pg/Kg. The mean measured resultobtained was 23.3 ug/L. This is 106 % of the Certified value. The Analyte Recovery criteria set out in the 200.9Method have been easily achieved with a range of lowsalinity samples analysed using the Thermo Scientificinstrument. The recovery was below the lower limit of thecriteria for one high salinity sample investigated, butcalibration using the Method of Standard Additions resultedin full recovery. The Data Quality of the measurementsystem has been further confirmed by the acceptable recoveryof the analyte from a Certified Reference Material. Conclusions The Thermo Scientific AA Spectrometer fitted with aZeeman Graphite Furnace and Graphite Furnace auto-sampler is entirely suitable for the determination ofselenium concentrations in natural water samples usingthe EPA 200.9 methodology. The Method DevelopmentTools provided, particularly the Graphite FurnaceTeleVision accessory and the automatic Ash Atomizeexperiment, allow the instrument parameters to be quicklyand reliably optimised. The analytical performance of the system meets theperformance criteria set out in the Method, and thecomprehensive QC Tests facilities provided in theSOLAAR software permit the detailed Quality Controlrequirements of the Method to be quickly and simply setup. The flexible Calibration functions, together withFurnace Autosampler facilities, allow the Method ofStandard Additions calibration strategy to be easilyimplemented if necessary. i) Lead in Natural Waters by Graphite Furnace Atomic Absorption usingEPA Method 200.9. Thermo Scientific publication number AN40849 ii) Arsenic in Natural Waters by Graphite Furnace Atomic Absorption usingEPA Method 200.9. Thermo Scientific publication number AN40849 ( iii) Palladium Nitrate-Magnesium Nitrate M o difier for ElectrothermalAtomic Absorption Spectrometry. Welz, Schlemmer and Mudakavi, Journalof Analytical Atomic Spectrometry, vol. 7 ,p1257, 19 9 2. ) In addition to these offices, Thermo FisherScientific maintainsa network of represen-tative organizationsthroughout the world. Africa +43 1 333 5034127 Australia +61 2 8844 9500 Austria +43133350340 Belgium +32 2 482 30 30 Canada +1800 530 8447 China +86 10 8419 3588 Denmark +45 70 23 62 60 Europe-Other +43 1 333 5034 127 France +33160 92 48 00 Germany +4961034081014 India +91 226742 9434 ltaly +39 02 950 591 Japan +81 454539100 Latin America +1 6082765659 Middle East +43 1 333 5034 127 Netherlands +3176 579 55 55 South Africa +27 11 570 1840 Spain +34914 845 965 Sweden/Norway/Finland+46 8 556 468 00Switzerland+41 6148784 00UK+441442 233555USA+1 800 5324752www.thermo.com Thermo Electron ManufacturingLtd(Cambridge) is ISO Certified. AN40855 E 03/08C The analytical performance of the system meets theperformance criteria set out in the Method, and thecomprehensive QC Tests facilities provided in theSOLAAR software permit the detailed Quality Controlrequirements of the Method to be quickly and simply setup. The flexible Calibration functions, together withFurnace Autosampler facilities, allow the Method ofStandard Additions calibration strategy to be easilyimplemented if necessary.Referencesi) Lead in Natural Waters by Graphite Furnace Atomic Absorption usingEPA Method 200.9. Thermo Scientific publication number AN40849ii) Arsenic in Natural Waters by Graphite Furnace Atomic Absorption usingEPA Method 200.9. Thermo Scientific publication number AN40849iii) Palladium Nitrate-Magnesium Nitrate Modifier for ElectrothermalAtomic Absorption Spectrometry. Welz, Schlemmer and Mudakavi, Journalof Analytical Atomic Spectrometry, vol. 7, p1257, 1992.Part
关闭-
1/7
-
2/7
还剩5页未读,是否继续阅读?
继续免费阅读全文产品配置单
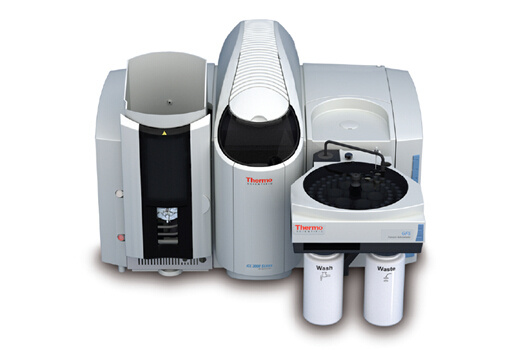
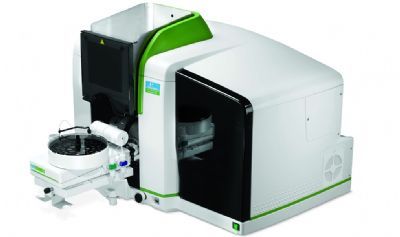
深圳市瑞盛科技有限公司为您提供《自然水中硒元素检测检测方案(原子吸收光谱)》,该方案主要用于环境水(除海水)中(类)金属及其化合物检测,参考标准《暂无》,《自然水中硒元素检测检测方案(原子吸收光谱)》用到的仪器有Thermo Fisher ICE-3500 原子吸收光谱仪。
我要纠错
推荐专场
相关方案


 咨询
咨询