方案详情文
智能文字提取功能测试中
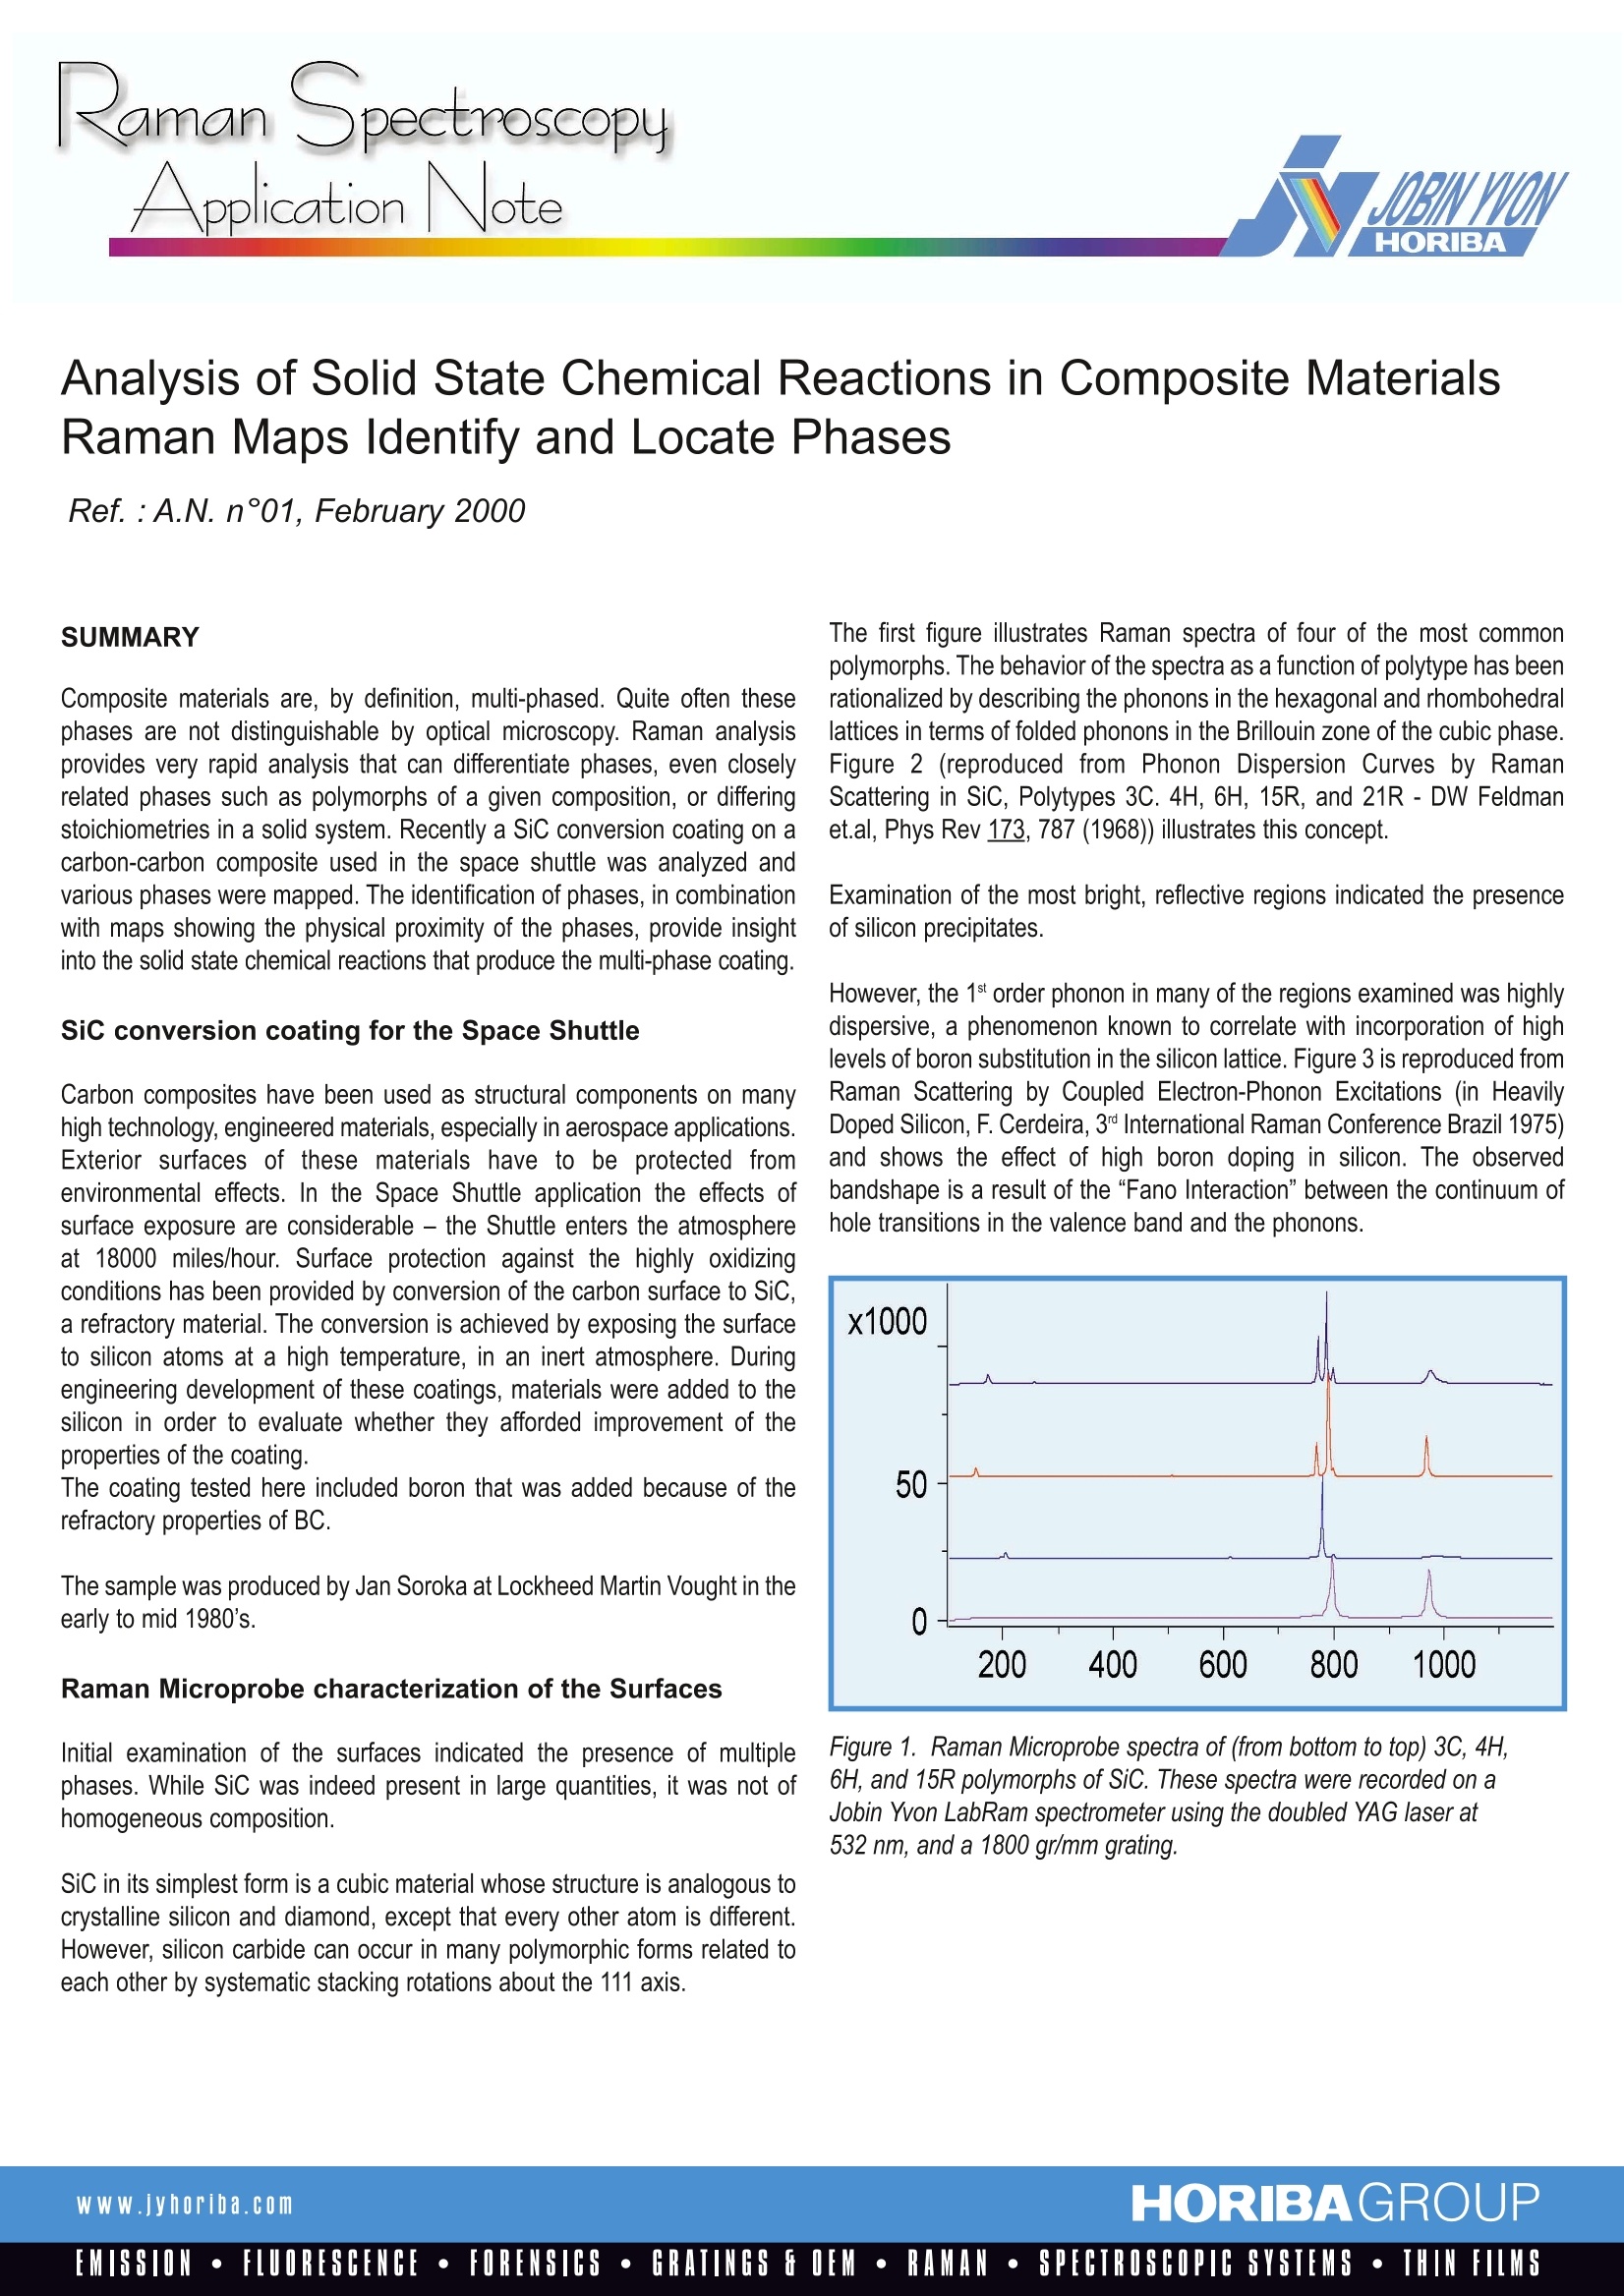
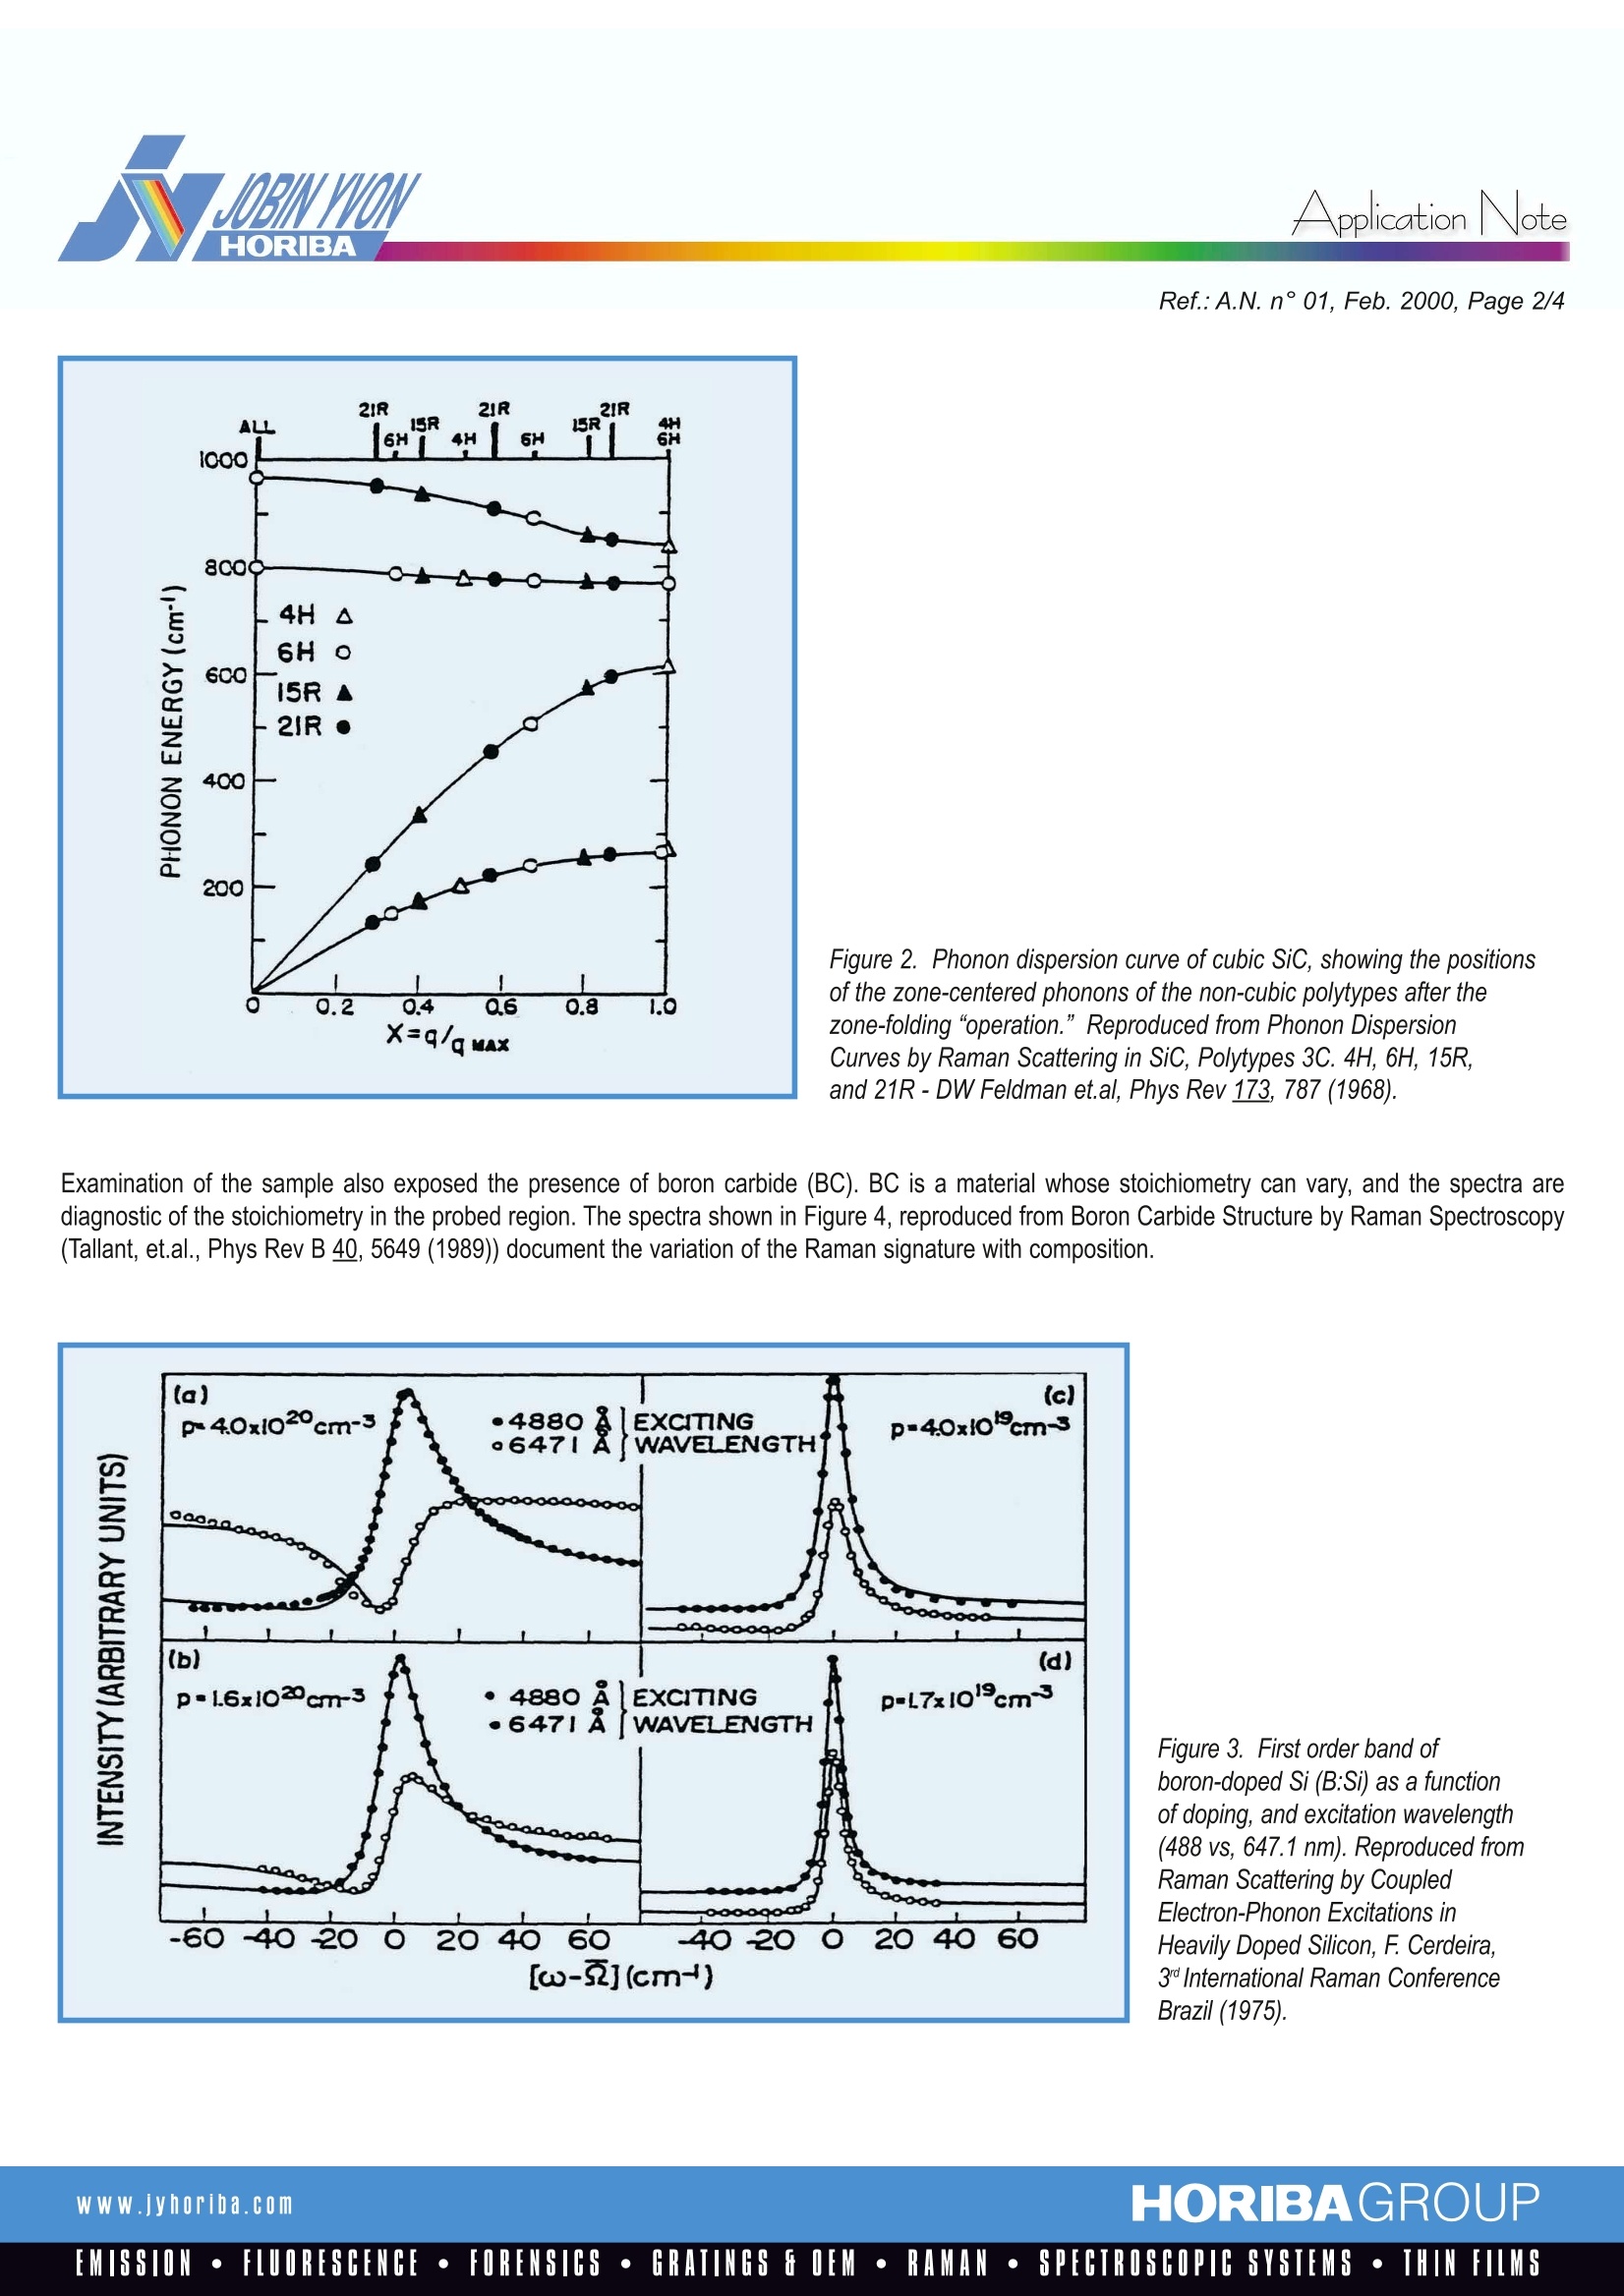
RamanlSpectroscopyApplicationNote Application Note Analysis of Solid State Chemical Reactions in Composite MaterialsRaman Maps Identify and Locate Phases Ref.:A.N. n°01, February 2000 Composite materials are, by definition, multi-phased. Quite often thesephases are not distinguishable by optical microscopy. Raman analysisprovides very rapid analysis that can differentiate phases, even closelyrelated phases such as polymorphs of a given composition, or differingstoichiometries in a solid system. Recently a Sic conversion coating on acarbon-carbon composite used in the space shuttle was analyzed andvarious phases were mapped. The identification of phases, in combinationwith maps showing the physical proximity of the phases,provide insightinto the solid state chemical reactions that produce the multi-phase coating. SiC conversion coating for the Space Shuttle Carbon composites have been used as structural components on manyhigh technology, engineered materials, especially in aerospace applications.Exterior surfaces of these materials have to be protected fromenvironmental effects. In the Space Shuttle application the effects ofsurface exposureare considerable- the Shuttle enters the atmosphereat 18000 miles/hour. Surface protection against the highly oxidizingconditions has been provided by conversion of the carbon surface to SiC,a refractory material. The conversion is achieved by exposing the surfaceto silicon atoms at a high temperature, in an inert atmosphere. Duringengineering development of these coatings, materials were added to thesilicon in order to evaluate whether they afforded improvement of theproperties of the coating. The coating tested here included boron that was added because of therefractory properties of BC. The sample was produced by Jan Soroka at Lockheed Martin Vought in theearly to mid 1980's. Raman Microprobe characterization of the Surfaces Initial examination of the surfaces indicated the presence of multiplephases. While SiC was indeed present in large quantities, it was not ofhomogeneous composition. SiC in its simplest form is a cubic material whose structure is analogous tocrystalline silicon and diamond, except that every other atom is different.However, silicon carbide can occur in many polymorphic forms related toeach other by systematic stacking rotations about the 111 axis. The first figure illustrates Raman spectra of four of the most commonpolymorphs. The behavior of the spectra as a function of polytype has beenrationalized by describing the phonons in the hexagonal and rhombohedrallattices in terms of folded phonons in the Brillouin zone of the cubic phase.Figure 2 (reproduced from Phonon Dispersion Curves by RamanScattering in SiC, Polytypes 3C. 4H, 6H, 15R, and 21R - DW Feldmanet.al, Phys Rev 173, 787 (1968)) illustrates this concept. Examination of the most bright, reflective regions indicated the presenceof silicon precipitates. However, the 1st order phonon in many of the regions examined was highlydispersive, a phenomenon known to correlate with incorporation of highlevels of boron substitution in the silicon lattice. Figure 3 is reproduced fromRaman Scattering by Coupled Electron-Phonon Excitations (in HeavilyDoped Silicon, F. Cerdeira, 3 International Raman Conference Brazil 1975)and shows the efect of high boron doping in silicon. The observedbandshape is a result of the“Fano Interaction” between the continuum ofhole transitions in the valence band and the phonons. Figure 1. Raman Microprobe spectra of (from bottom to top) 3C, 4H,6H, and 15R polymorphs of SiC. These spectra were recorded on aJobin Yvon LabRam spectrometer using the doubled YAG laser at532 nm, and a 1800 gr/mm grating. Ref.:A.N. n°01, Feb. 2000, Page 2/4 Figure 2. Phonon dispersion curve of cubic SiC, showing the positionsof the zone-centered phonons of the non-cubic polytypes after thezone-folding “operation.”Reproduced from Phonon DispersionCurves by Raman Scattering in SiC, Polytypes 3C. 4H, 6H, 15R,and 21R-DW Feldman et.al, Phys Rev 173, 787 (1968). Examination of the sample also exposed the presence of boron carbide (BC). BC is a material whose stoichiometry can vary, and the spectra arediagnostic of the stoichiometry in the probed region. The spectra shown in Figure 4, reproduced from Boron Carbide Structure by Raman Spectroscopy(Tallant, et.al., Phys Rev B 40, 5649 (1989)) document the variation of the Raman signature with composition. Figure 3. First order band ofboron-doped Si (B:Si) as a functionof doping, and excitation wavelength(488 vs, 647.1 nm). Reproduced fromRaman Scattering by CoupledElectron-Phonon Excitations inHeavily Doped Silicon, F. Cerdeira,3nInternational Raman ConferenceBrazil (1975). Figure 4. Raman spectra of BC, of various stoichiometries (BC, B, Czand B,C from bottom to top), reproduced from Boron Carbide Structureby Raman Spectroscopy-Tallant, et al., Phys Rev B 40, 5649 (1989). Raman maps of SiC conversion coatings onCarbon-Carbon composites Raman maps indicated the richness of variability of the composition of thephases in this coating. It was, of course, anticipated that there would beSiC over most of the surface, as well as some BC. We observed multiplephases of SiC as well as BC. However, the most interesting observationwas that of the presence of small crystals of silicon. According to theLockheed Martin engineer, silicon precipitates were present only whenboron was added to the coating mix. It can be inferred that the presence ofthe B stabilised the silicon lattice enough to allow these precipitates to format the expense of some SiC. Apparently the high solubility of boron inthe silicon lattice (ca. 0.8% at room temperature which is about 4 timeshigher than stated dopant values of 102 carriers/cc) stabilised the B:Si(boron-doped silicon) lattice, preventing some of the silicon from reactingwith the carbon composite. Figure 5 shows spectra acquired from a region that was subsequentlymapped. The bottom spectrum, plotted in blue shows the silicon carbide.The middle spectrum, shown in red, is that of B:Si, and the top figure is thatof BC (the B.C phase). Figure 5. Raman microprobe spectra of SiC (bottom, in blue), boron-dopedSi (middle, in red) and BC (top, in green). The LabSpec software was used to map the various phases. The final mapwas color-coded, using the colors in Figure 5, for easy correlation betweenphases.The most fundamental function of LabSpec was used to create themap. Cursors are set to span the wavenumber-shift region of interest, andthe intensity between the cursors is used in the Raman map. Up to threephases can be mapped simultaneously using the colors red, blue andgreen. The results of such a map are illustrated in Figure 6, side-by-sidewith the TV image. Figure 6. TV image (left) and Raman map (right) of SiC (blue), B:Si (red)and BC (green) in a region of the SiC conversion coating. Ref.: A.N.n°01, Feb.2000, Page 4 /4 [A more sophisticated method of mapping, not implemented in this note,uses models in which “pure" spectra would be used to calculate amount ofeach species at each point in the image.] The blue part of the image showshorizontal linear texture which is most certainly a “ghost" image of theoriginal fibers. The final figure shows a map created by bracketing linesof 2 different phases of SiC. The map shows a coherent change of phase along a horizontal line nearthe bottom of the figure. This type of information can certainly byrelevant to the process engineer trying to control the process,because the phase formed must be related to the physical conditionsof the sample during the process. Figure 7. Color coded map(right) of same region of composite as shownin Figure 6. In this case the green and blue represent different phases ofSiC, as shown in the spectra The LabRam Raman Microprobe has been successfully used to determinecomposition and phase of areas that appear in varying shades of grey inTV-captured images. In addition, confocal maps enable correlation ofspatial features with composition. Because of the subtle differencesin phase, composition, and doping, that are observed in this sample,it is clear that a Raman microprobe with confocal imaging capabilitiescan provide information difficult to acquire with other techniques. www.jyhoriba.com HORIBAGROUPEMISSION·FLUORESCENCE·FORENSICS·GRATINGS FOEM·RAMAN·SPECTROSCOPIC SYSTEMS· THIN FILMS
关闭-
1/4
-
2/4
还剩2页未读,是否继续阅读?
继续免费阅读全文产品配置单
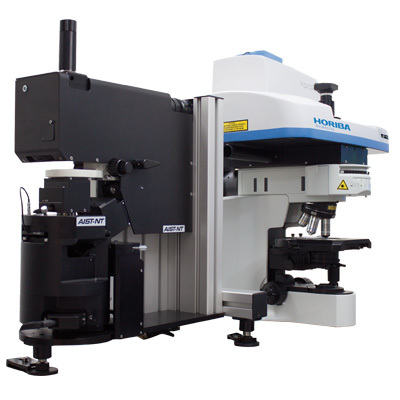
HORIBA(中国)为您提供《Analysis Solid State Chemical Reactions》,该方案主要用于无机非金属基复合材料中null检测,参考标准《暂无》,《Analysis Solid State Chemical Reactions》用到的仪器有HORIBA HE科研级便携拉曼光谱仪、HORIBA XploRA Nano原子力-拉曼联用系统。
我要纠错
推荐专场


相关方案
 咨询
咨询