酸,碱,盐溶液中水溶性酸,碱,盐溶液表面统一的分子图像检测方案(其它光谱仪)
检测样品 基础有机原料
检测项目 水溶性酸,碱,盐溶液表面统一的分子图像

 金牌会员
752 篇解决方案
方案详情文
智能文字提取功能测试中
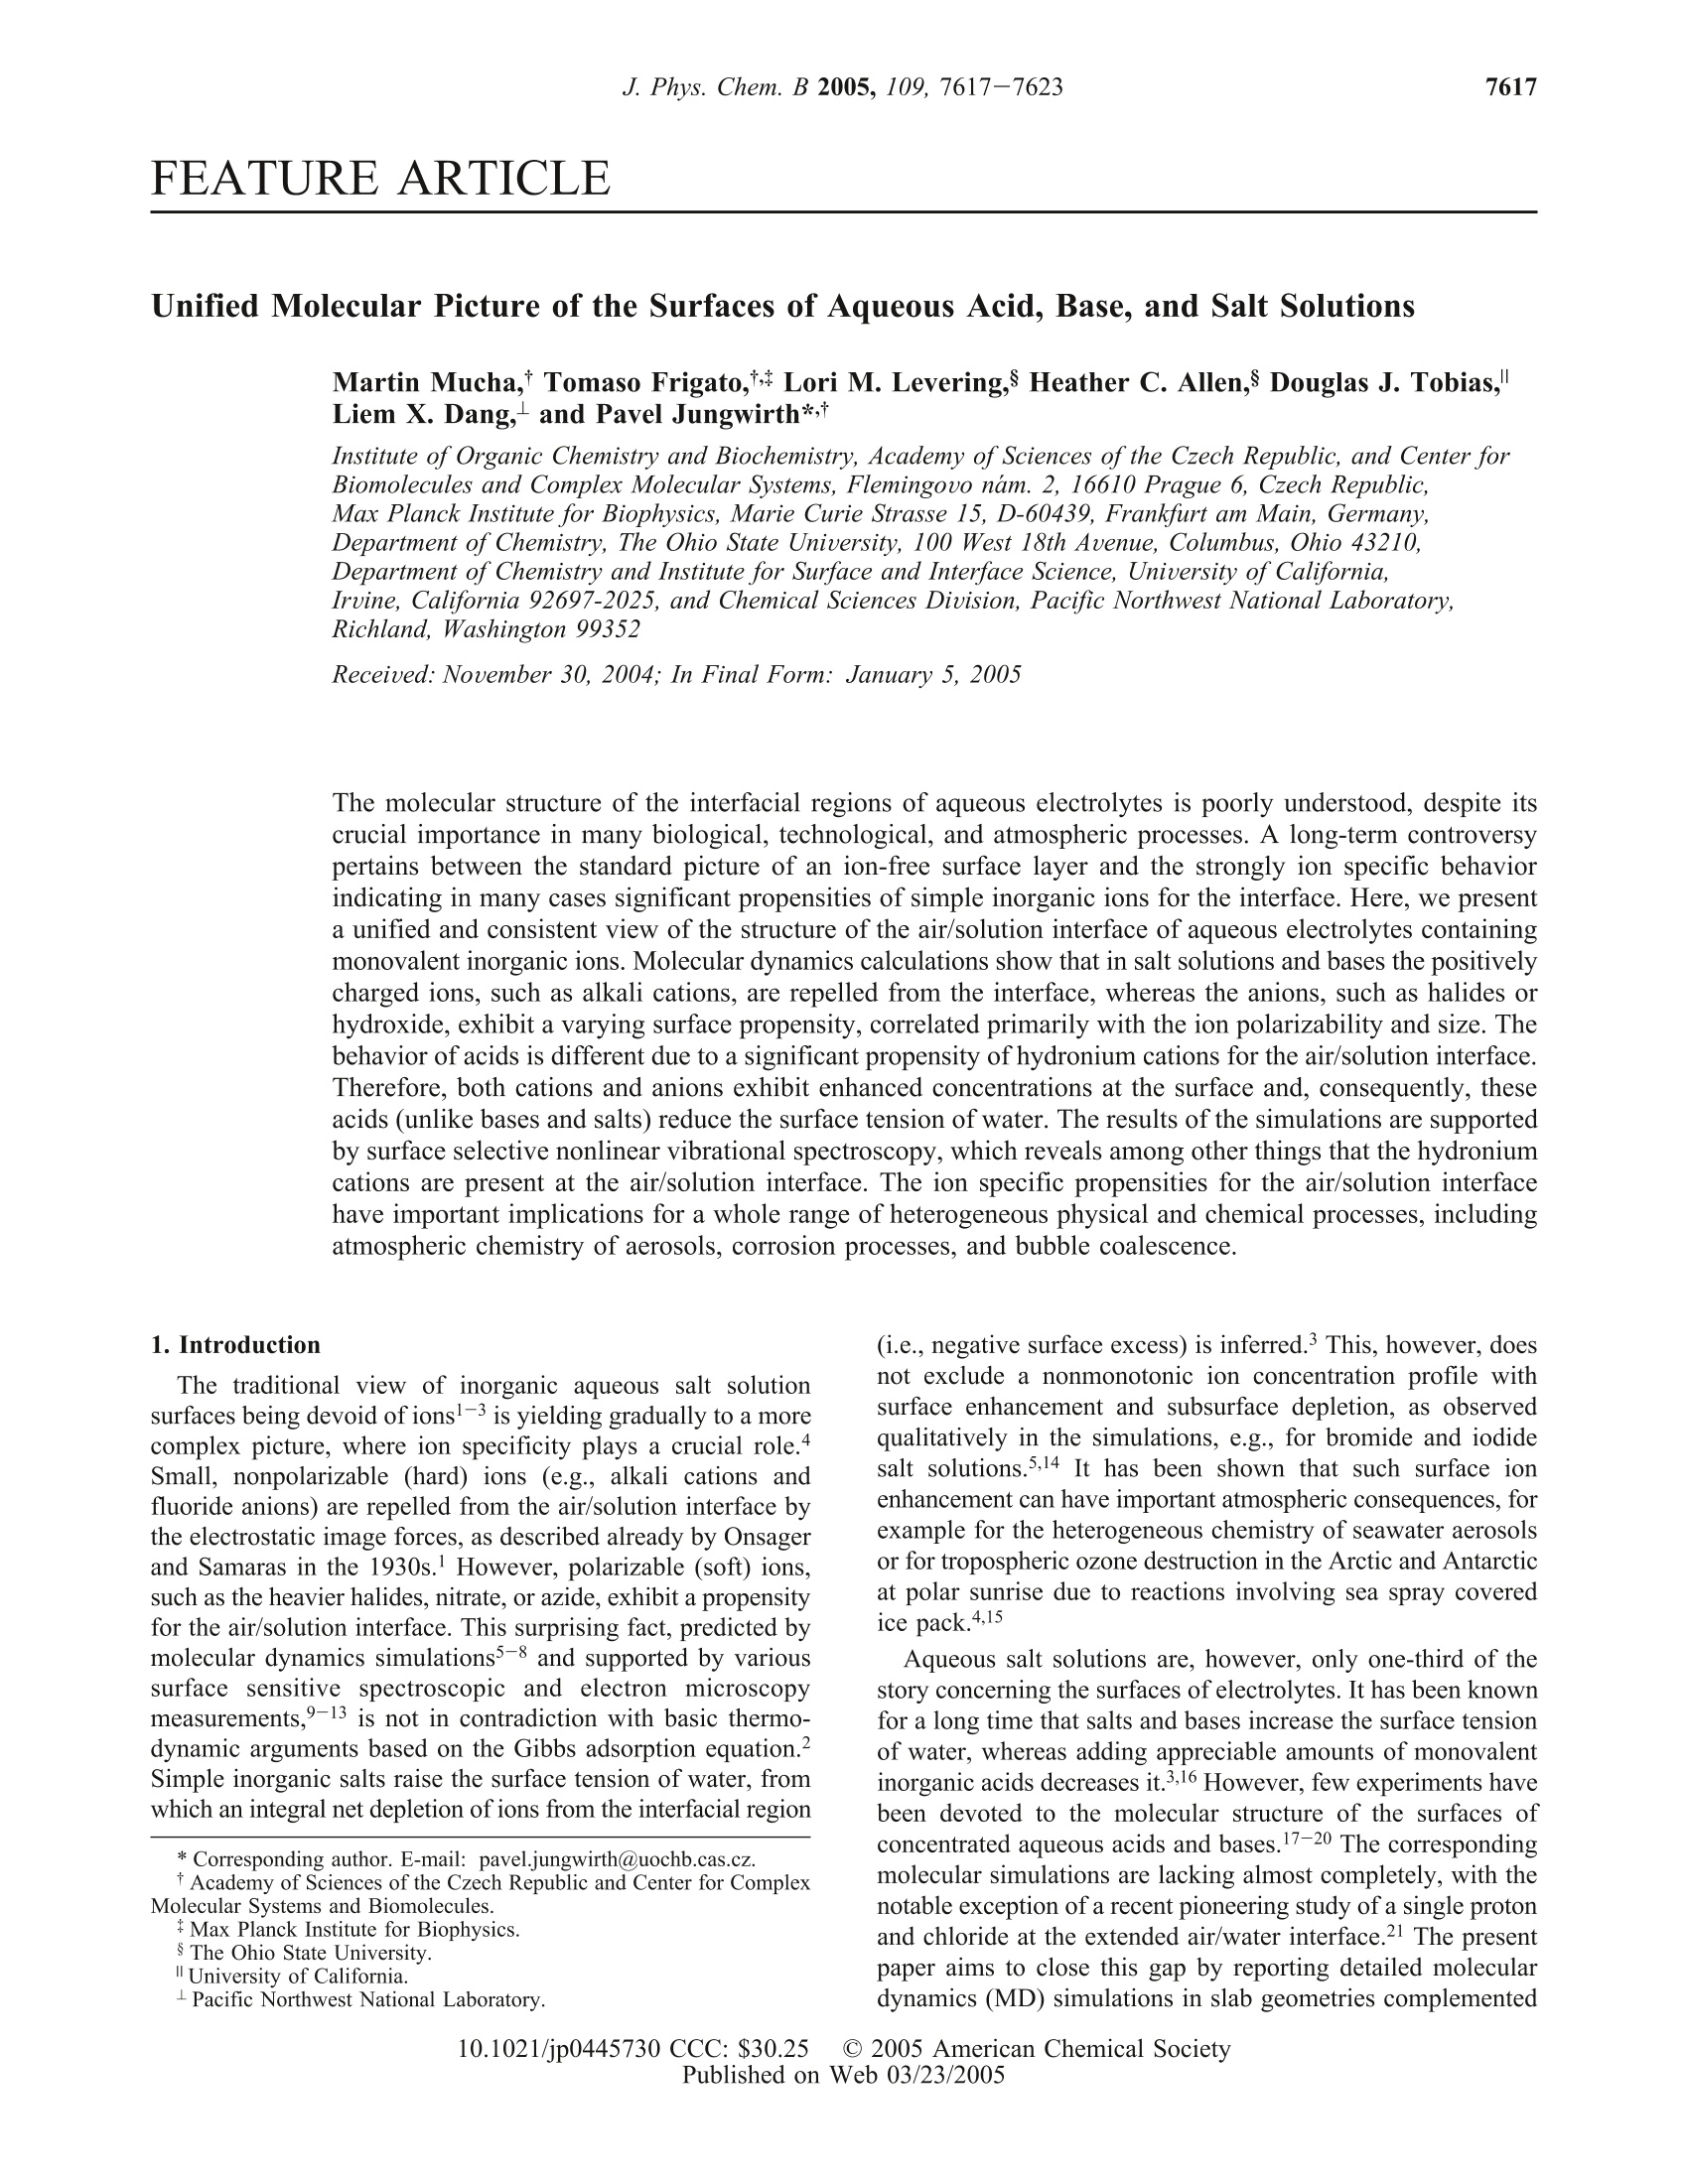
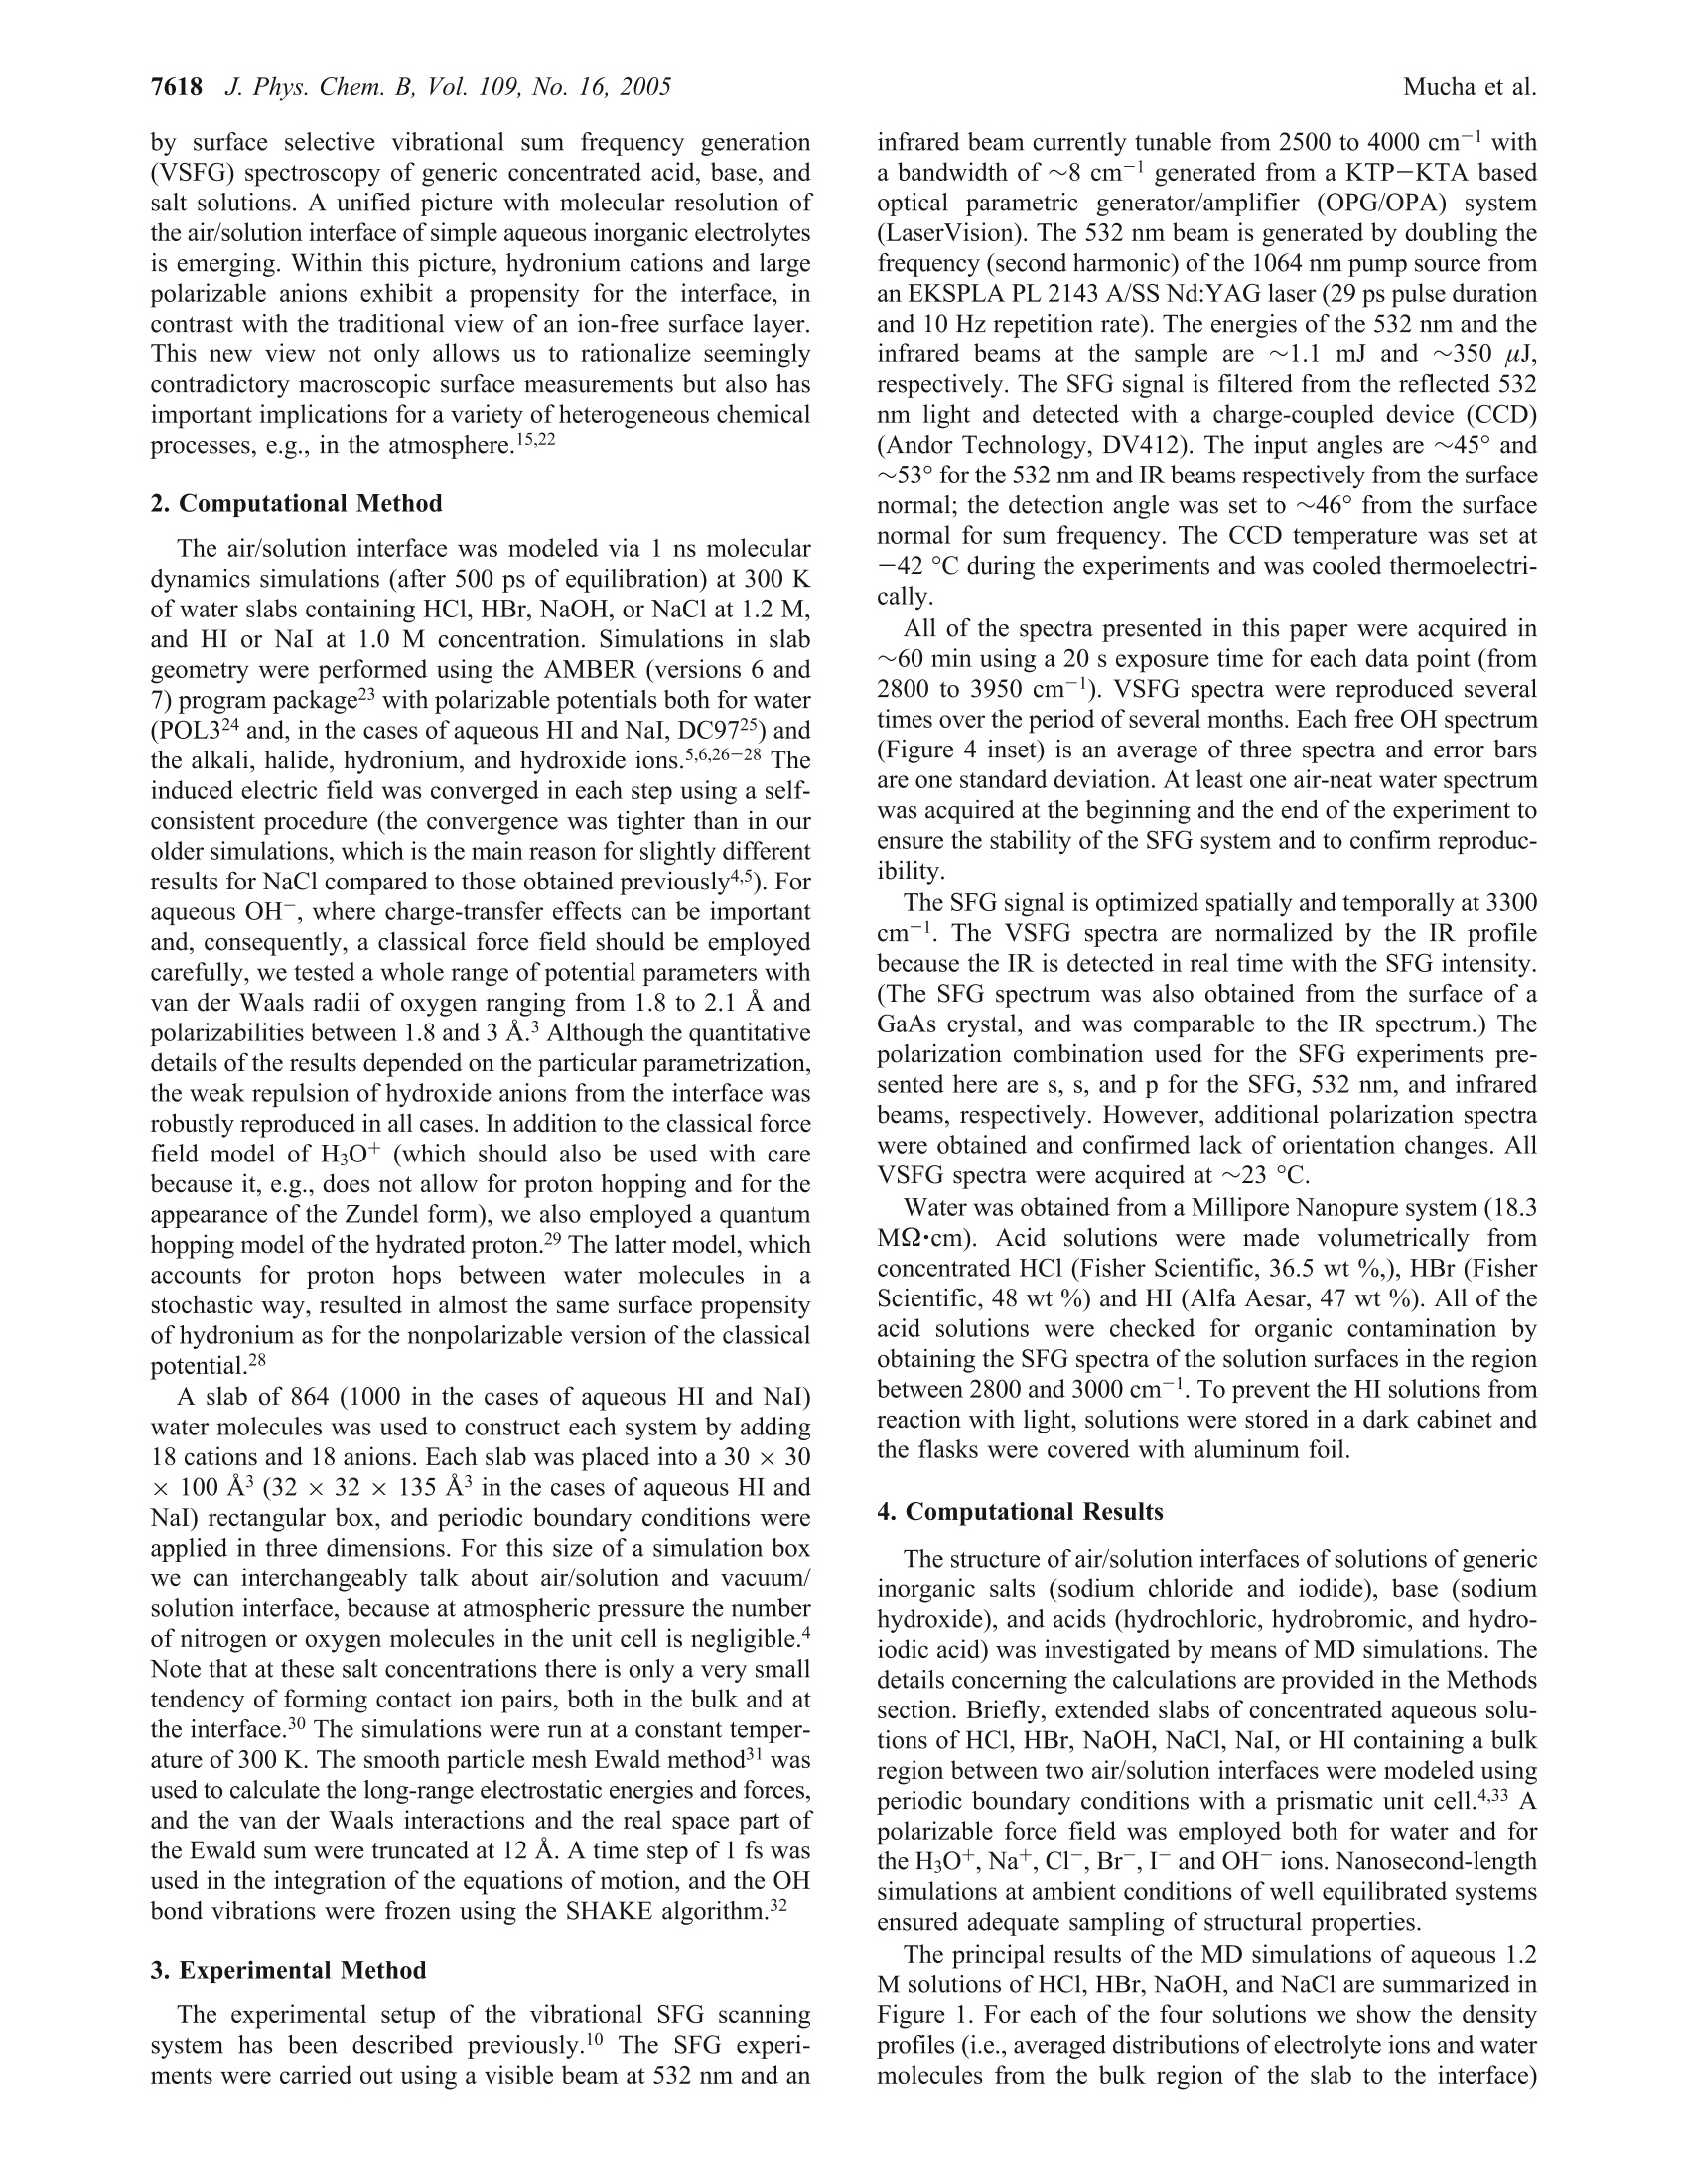
J. Phys. Chem. B 2005, 109, 7617-76237617FEATURE ARTICLE Mucha et al.7618J. Phys. Chem. B, Vol. 109, No. 16,2005 10.1021/jp0445730 CCC: $30.25 C 2005 American Chemical SocietyPublished on Web 03/23/2005 Unified Molecular Picture of the Surfaces of Aqueous Acid,Base, and Salt Solutions Martin Mucha, Tomaso Frigato,# Lori M. Levering,s Heather C. Allen,s Douglas J. Tobias,Liem X. Dang, and Pavel Jungwirth*+ Institute of Organic Chemistry and Biochemistry, Academy of Sciences of the Czech Republic, and Center forBiomolecules and Complex Molecular Systems, Flemingouo nam. 2,16610 Prague 6, Czech Republic,Max Planck Institute for Biophysics, Marie Curie Strasse 15, D-60439, Frankfurt am Main, Germany,Department of Chemistry, The Ohio State University, 100 West 18th Avenue, Columbus,Ohio 43210,Department of Chemistry and Institute for Surface and Interface Science, University of California,Iruine, California 92697-2025, and Chemical Sciences Division, Pacific Northwest National Laboratory,Richland, Washington 99352 Received: November 30, 2004; In Final Form: January 5, 2005 The molecular structure of the interfacial regions of aqueous electrolytes is poorly understood, despite itscrucial importance in many biological, technological, and atmospheric processes. A long-term controversypertains between the standard picture of an ion-free surface layer and the strongly ion specific behaviorindicating in many cases significant propensities of simple inorganic ions for the interface. Here, we presenta unified and consistent view of the structure of the air/solution interface of aqueous electrolytes containingmonovalent inorganic ions. Molecular dynamics calculations show that in salt solutions and bases the positivelycharged ions, such as alkali cations, are repelled from the interface, whereas the anions, such as halides orhydroxide, exhibit a varying surface propensity, correlated primarily with the ion polarizability and size. Thebehavior of acids is different due to a significant propensity of hydronium cations for the air/solution interface.Therefore, both cations and anions exhibit enhanced concentrations at the surface and, consequently, theseacids (unlike bases and salts) reduce the surface tension of water. The results of the simulations are supportedby surface selective nonlinear vibrational spectroscopy, which reveals among other things that the hydroniumcations are present at the air/solution interface. The ion specific propensities for the air/solution interfacehave important implications for a whole range of heterogeneous physical and chemical processes, includingatmospheric chemistry of aerosols, corrosion processes, and bubble coalescence. 1. Introduction The traditional view of inorganic aqueous salt solutionsurfaces being devoid of ions-3 is yielding gradually to a morecomplex picture, where ion specificity plays a crucial role.Small, nonpolarizable (hard) ions (e.g., alkali cations andfluoride anions) are repelled from the air/solution interface bythe electrostatic image forces, as described already by Onsagerand Samaras in the 1930s. However, polarizable (soft) ions,such as the heavier halides, nitrate, or azide, exhibit a propensityfor the air/solution interface. This surprising fact, predicted bymolecular dynamics simulations5-8 and supported by varioussurface sensitive spectroscopic and electron microscopymeasurements,9-13 is not in contradiction with basic thermo-dynamic arguments based on the Gibbs adsorption equation."Simple inorganic salts raise the surface tension of water, fromwhich an integral net depletion of ions from the interfacial region ( * C o rresponding a uthor. E-mail: p avel.jungwirth@uochb.cas.cz. T Academy of Sciences of the C zech Republic a n d Center f o r Co m plexMolecular Systems and Biomolecules. ) ( Max Pl a nck In s titute f o r B i ophysics. ) ( T h e Ohio State University. ) ( " Un i versity of California. ) (i.e., negative surface excess) is inferred. This, however, doesnot exclude a nonmonotonic ion concentration profile withsurface enhancement and subsurface depletion, as observedqualitatively in the simulations,e.g., for bromide and iodidesalt solutions.5,14 It has been shown that such surface ionenhancement can have important atmospheric consequences, forexample for the heterogeneous chemistry of seawater aerosolsor for tropospheric ozone destruction in the Arctic and Antarcticat polar sunrise due to reactions involving sea spray coveredice pack.4,15 Aqueous salt solutions are, however, only one-third of thestory concerning the surfaces of electrolytes. It has been knownfor a long time that salts and bases increase the surface tensionof water, whereas adding appreciable amounts of monovalentinorganic acids decreases it.3.16 However, few experiments havebeen devoted to the molecular structure of the surfaces ofconcentrated aqueous acids and bases.17-20 The correspondingmolecular simulations are lacking almost completely, with thenotable exception of a recent pioneering study of a single protonand chloride at the extended air/water interface.21 The presentpaper aims to close this gap by reporting detailed moleculardynamics (MD) simulations in slab geometries complemented by surface selective vibrational sum frequency generation(VSFG) spectroscopy of generic concentrated acid, base, andsalt solutions. A unified picture with molecular resolution ofthe air/solution interface of simple aqueous inorganic electrolytesis emerging. Within this picture, hydronium cations and largepolarizable anions exhibit a propensity for the interface, incontrast with the traditional view of an ion-free surface layer.This new view not only allows us to rationalize seeminglycontradictory macroscopic surface measurements but also hasimportant implications for a variety of heterogeneous chemicalprocesses, e.g., in the atmosphere.15,22 2. Computational Method The air/solution interface was modeled via 1 ns moleculardynamics simulations (after 500 ps of equilibration) at 300 Kof water slabs containing HCl, HBr, NaOH, or NaCl at 1.2 M,and HI or NaI at 1.0 M concentration. Simulations in slabgeometry were performed using the AMBER (versions 6 and7) program package3 with polarizable potentials both for water(POL324 and, in the cases ofaqueous HI and NaI, DC9725) andthe alkali, halide, hydronium, and hydroxide ions.5,6,26-28 Theinduced electric field was converged in each step using a self-consistent procedure (the convergence was tighter than in ourolder simulations, which is the main reason for slightly differentresults for NaCl compared to those obtained previously4.5). Foraqueous OH-, where charge-transfer effects can be importantand, consequently, a classical force field should be employedcarefully, we tested a whole range of potential parameters withvan der Waals radii of oxygen ranging from 1.8 to 2.1 A andpolarizabilities between 1.8 and 3 A. Although the quantitativedetails of the results depended on the particular parametrization,the weak repulsion of hydroxide anions from the interface wasrobustly reproduced in all cases. In addition to the classical forcefield model of H3O+(which should also be used with carebecause it, e.g., does not allow for proton hopping and for theappearance of the Zundel form), we also employed a quantumhopping model of the hydrated proton.2 The latter model, whichaccounts for proton hops between water molecules in astochastic way, resulted in almost the same surface propensityof hydronium as for the nonpolarizable version of the classicalpotential.28 A slab of 864 (1000 in the cases of aqueous HI and Nal)water molecules was used to construct each system by adding18 cations and 18 anions. Each slab was placed into a 30 × 30x 100 A3 (32× 32×135 A3 in the cases of aqueous HI andNal) rectangular box, and periodic boundary conditions wereapplied in three dimensions. For this size of a simulation boxwe can interchangeably talk about air/solution and vacuum/solution interface, because at atmospheric pressure the numberof nitrogen or oxygen molecules in the unit cell is negligible.Note that at these salt concentrations there is only a very smalltendency of forming contact ion pairs, both in the bulk and atthe interface.30 The simulations were run at a constant temper-ature of 300 K. The smooth particle mesh Ewald method3l wasused to calculate the long-range electrostatic energies and forces,and the van der Waals interactions and the real space part ofthe Ewald sum were truncated at 12 A. A time step of 1 fs wasused in the integration of the equations of motion, and the OHbond vibrations were frozen using the SHAKE algorithm. 3. Experimental Method The experimental setup of the vibrational SFG scanningsystem has been described previously.10 The SFG experi-ments were carried out using a visible beam at 532 nm and an infrared beam currently tunable from 2500 to 4000 cm- witha bandwidth of ~8 cm-l generated from a KTP-KTA basedoptical parametric generator/amplifier (OPG/OPA) system(LaserVision). The 532 nm beam is generated by doubling thefrequency (second harmonic) of the 1064 nm pump source froman EKSPLA PL 2143 A/SS Nd:YAG laser (29 ps pulse durationand 10 Hz repetition rate). The energies of the 532 nm and theinfrared beams at the sample are ~1.1 mJ and ~350 uJ,respectively. The SFG signal is filtered from the reflected 532nm light and detected with a charge-coupled device (CCD)(Andor Technology,DV412). The input angles are ~45° and53°for the 532 nm and IR beams respectively from the surfacenormal; the detection angle was set to ~46°from the surfacenormal for sum frequency. The CCD temperature was set at-42 ℃ during the experiments and was cooled thermoelectri-cally. All of the spectra presented in this paper were acquired in~60 min using a 20 s exposure time for each data point (from2800 to 3950 cm-). VSFG spectra were reproduced severaltimes over the period of several months. Each free OH spectrum(Figure 4 inset) is an average of three spectra and error barsare one standard deviation. At least one air-neat water spectrumwas acquired at the beginning and the end of the experiment toensure the stability of the SFG system and to confirm reproduc-ibility. The SFG signal is optimized spatially and temporally at 3300cm-. The VSFG spectra are normalized by the IR profilebecause the IR is detected in real time with the SFG intensity.(The SFG spectrum was also obtained from the surface of aGaAs crystal, and was comparable to the IR spectrum.) Thepolarization combination used for the SFG experiments pre-sented here are s, s, and p for the SFG, 532 nm, and infraredbeams, respectively. However, additional polarization spectrawere obtained and confirmed lack of orientation changes. AllVSFG spectra were acquired at ~23 C. Water was obtained from a Millipore Nanopure system (18.3MQ·cm). Acid solutions were made volumetrically fromconcentrated HCl (Fisher Scientific, 36.5 wt %,), HBr (FisherScientific, 48 wt%) and HI (Alfa Aesar, 47 wt %). All of theacid solutions were checked for organic contamination byobtaining the SFG spectra of the solution surfaces in the regionbetween 2800 and 3000 cm-. To prevent the HI solutions fromreaction with light, solutions were stored in a dark cabinet andthe flasks were covered with aluminum foil. 4. Computational Results The structure of air/solution interfaces of solutions of genericinorganic salts (sodium chloride and iodide), base (sodiumhydroxide), and acids (hydrochloric, hydrobromic, and hydro-iodic acid) was investigated by means of MD simulations. Thedetails concerning the calculations are provided in the Methodssection. Briefly, extended slabs of concentrated aqueous solu-tions ofHCl, HBr, NaOH, NaCl, NaI, or HI containing a bulkregion between two air/solution interfaces were modeled usingperiodic boundary conditions with a prismatic unit cell.4,33 Apolarizable force field was employed both for water and forthe H;O+,Nat,Cl, Br,I and OH ions. Nanosecond-lengthsimulations at ambient conditions of well equilibrated systemsensured adequate sampling of structural properties. The principal results of the MD simulations of aqueous 1.2M solutions of HCl, HBr, NaOH, and NaC are summarized inFigure 1. For each of the four solutions we show the densityprofiles (i.e., averaged distributions of electrolyte ions and watermolecules from the bulk region of the slab to the interface) Figure 1. Snapshots from molecular dynamics simulations (side and top view of the slabs) and density profiles (i.e., histogrammed densities of theelectrolyte ions and water molecules in layers parallel to the surface, from the center of the slab across the interface into the gas phase) for 1.2 Maqueous HCl, HBr, NaOH, and NaCl. Coloring scheme: water oxygen, blue; hydronium oxygen, red; hydroxide oxygen, pink; hydrogen, gray;sodium ions, green; chloride ions, yellow; bromide ions, orange. together with typical snapshots from the simulations, depictingtop and side views of the systems. Note that in our concentratedsystems monitoring the distributions of ions of each type in theslab provides much better statistics than one would get from apotential of mean force of a single ion. In the case of hydrochloric acid both hydronium cations andchloride anions penetrate into the air/solution interface, and thereis actually a slight surface ion enhancement of both ions. Forhydrobromic acid the situation is similar, except that bromideis more surface enhanced than chloride or hydronium. Note thatthe hydronium cations are preferentially oriented at the surface,with hydrogens pointing toward the aqueous phase and oxygentoward the air. The surface behavior of ions is very different in sodiumhydroxide and sodium chloride solutions. On one hand, inaqueous NaOH and NaCl sodium cations are repelled from thesurface and never penetrate its topmost layer. On the other hand,hydroxide anions are weakly repelled from and chloride anionsweakly attracted to the surface, and both can be found at thesurface. We mention in passing that the orientation of OH- atthe surface,with hydrogen pointing into the gas phase (as in the snapshot shown in Figure 1) nicely matches that observedin water clusters.34 The effect of added electrolyte on the surface tension ofaqueous solutions has been intensely studied for almost acentury.35 Although surface tension measurements do not givedirect information about the molecular structure of the surface,they yield, via the Gibbs adsorption equation, information aboutthe net excess of ions in the whole interfacial layer.2If surfacetension increases compared to neat water, this excess is negative(indicating a net depletion of ions from the interface), whereasa decrease in surface tension is related to a positive surfaceexcess (i.e., a net enrichment of ions in the interfacial layer). Ithas been known for decades that salts such as alkali halidesand bases such as alkali hydroxides increase the surface tensionof water, whereas acids such as HCl, HBr, or HI slightlydecrease it.3 Surface tension can be extracted from MD simulations, albeitwith a sizable statistical error due to large pressure fluctuations,from the asymmetry of the pressure tensor.36 Despite the factthat the calculated numbers are subject to statistical errors of atleast1 mN/m, the experimental trend is reproduced by the 7620 J. Phys. Chem. B, Vol. 109, No. 16, 2005 Figure 2. Density profiles of iodide from simulations of a 1.0 Msolution of HI and NaI. Note the increased and shifted (toward the gasphase) interfacial peak in the acid. The Gibbs dividing surface is at~23 A. present simulations. Namely, on one hand the calculated surfacetension of 1.2 M HCl is within the statistical error equal to thatof neat water, whereas that of 1.2 M HBr is smaller by about1 mN/m.Note that no ion association into a molecular acid isinvoked in the simulation to account for the decrease of surfacetension, in agreement with the anticipated complete dissociationof these strong acids at molar concentrations, confirmed byearlier VSFG measurements.17 On the other hand, both 1.2 MNaOH and 1.2 M NaCl increase the surface tension, thecalculated numbers being ~4 mN/m in the former case and ~3mN/m in the latter case. Interestingly, all the investigatedsystems exhibit the same polarity of the surface potential(negative toward the air). Whereas for NaCl and NaOH this isprimarily due to the fact that anions reside closer to the interfacethan cations, for HCl and HBr there is also a contribution fromthe hydronium ions that have the electronegative oxygen atomoriented toward the gas phase. We carried out additional simulations to compare the solva-tion properties of 1 M HI or NaI at the air/solution interface. Inthe case of aqueous HI, hydronium is present both in the bulkand at the interface (with appreciable surface enhancement) andiodide exhibits a surface concentration peak, which is largerthan that for the lighter halides. In aqueous NaI sodium isrepelled from the top surface layer, albeit less than in the caseof NaCl, which is due to attractive cation-anion interactionsand the stronger surface propensity of iodide compared tochloride. The iodide density profiles for aqueous HI and NaIare plotted in Figure 2. It can be seen from this figure that forHI the interfacial peak of iodide is about 10% larger and shiftedby more than 1 A toward the gas phase, compared to that inthe NaI solution. This is in perfect agreement with most recentsecond harmonic generation spectroscopic measurements,showing an enhanced interfacial iodide signal upon moving fromaqueous NaI to HI. The picture emerging from the simulations is that monovalentinorganic acids have different surface behavior from thecorresponding salts and bases in aqueous solutions. In acids boththe hydronium cations and the anions exhibit a propensity forthe air/solution interface. While the affinity of HO+ for thesurface is relatively weak, anions exhibit specificity thatcorrelates with the ion polarizability and size. Brand I (aswell as, e.g., N3- or NO3-)7-8,11 show a stronger surfaceenhancement, whereas the surface propensity of C1- is com-parable to that of H;0+. As a result of the surface propensityof both cations and anions in aqueous HCl, HBr, or HI, there isa net positive surface excess of ions. In bases and salt solutions,the cations, which are small and nonpolarizable spherical ions,are repelled from the surface. OH penetrates closer to the Figure 3. Surface density (number per unit area) of free OH bonds(i.e., water OH bonds that are not hydrogen-bonded to another watermolecule or ion) for neat water, HCl, HBr, NaOH, and NaCl, from thecenter of the slab to the surface. surface than alkali cations and can be occasionally found inthe topmost layer but it does not exhibit any appreciableenhancement at the air/solution interface. The salt anions exhibition specific degrees of surface enhancement, similarly as in thecase of the corresponding acids. The result of strong cationicrepulsion and varying anionic surface propensity is a netdepletion of ions from the interfacial layer of aqueous saltsolutions and bases. To connect the simulations to the spectroscopic experiments,we have computed the surface density (number per unit area)of free OH bonds, i.e., OH bonds not serving as hydrogen bonddonors, where water-water and water-ion hydrogen bonds havebeen defined using a geometric criterion. The results for neatwater, 1.2 M HCl, HBr, NaOH, and NaCl are shown in Figure3. In all systems the density of free OH bonds is higher in theinterfacial region than in the bulk. Although the density of freeOH bonds in the interfacial region is about the same for neatwater, NaOH, and NaCl, it is significantly reduced for the twoacids, in accord with the spectroscopic data presented next. 5. Experimental Results Vibrational sum frequency generation spectroscopy (VSFG)is a second-order vibrational spectroscopic technique that isselective to environments lacking inversion symmetry such asinterfaces and is used here to directly probe the air/solutioninterface.10,17-19,37 The VSFG surface spectra for 1.2 M HCl,HBr, HI, NaOH, and NaCl are shown in Figure 4 under ssppolarization conditions (s and p are perpendicular and parallelto the plane of incidence, respectively), which provide in-formation on molecular orientations,38 when quantitativelycompared to sps VSFG spectra, which showed no signal beyondthe noise. The spectra in Figure 4 reveal very different interfacialbehavior for the acids versus sodium hydroxide and sodiumhalide solutions. The VSFG spectrum of neat water is alsoshown for comparison. On the basis of the IR and Raman spectraof aqueous acid solutions, the additional VSFG intensity below3200 cm-l for the HCl, HBr, and HI solutions as compared tothe neat water surface spectrum is attributed to the VSFGresponse from hydronium (Eigen) and Zundel cations.39 Theintensity of the 3400 cm-band, which is assigned to oscillatingdipoles about the tetracoordinated interfacial water moleculesin these acid solutions, increases relative to neat water, with I~Br-> C1. In the 3700 cm-region, the sharp peak assignedto the dangling OH of water molecules that straddle the air/ Incident Infrared (cm) Figure 4.+。Vibrational sum frequency (ssp polarized) spectra of air/solution interfaces in the OH stretching region of neat water, 1.2 M NaCl,NaOH, HCl, HBr, and HI. Inset: Expanded view of the free OH region for neat water, 1.2 M HCl and HBr (standard deviations shown as errorbars). solution interface decreases for the acids (Figure 4 inset) relativeto neat water, although there is a small increase on the higherenergy side next to this peak. The 3400 cm- band increase isconsistent with our previous results on sodium halide air/solutioninterfaces, which indicated that the halides play a dominant rolein influencing the 3400 cm-band similar to observations fromRaman spectroscopy of the bulk salt solutions.10 However, the3100 cm-l band increases and the 3700 cm- peak decreasesare unique to the acids and are not observed for the base (sodiumhydroxide) and the sodium salt air/solution interfaces. Consistent with the MD simulations, the VSFG data revealthat protonated water exists in the interfacial region. Theobserved decrease in the dangling OH intensity for HCl andHBr as shown in the inset of Figure 4 is also consistent withthe decrease in free OH number densities derived from the MDsimulates as stated above (see Figure 3). Changes in theorientation distribution have been ruled out from VSFGpolarization data; this is consistent with water dipole orienta-tional distributions calculated from the simulations, which areessentially the same in all the systems considered. The absenceof VSFG intensity increases from the aqueous sodium hydroxidesurface is consistent with the MD simulations showing a netdepletion of OH at the surface (see Figure 1). Evidently,spectroscopic experiments and molecular simulations are con-verging to a unified picture of the interfacial structure of simpleelectrolyte solutions. 6. Discussion and Broader Implications The bottom line of the present study is that on one side thereare monovalent inorganic acids, where both cations and anionsexhibit a propensity for the air/solution interface, whereas onthe other side in bases and salt solutions cations are repelledfrom the interface and anions show a varying surface affinity. Thus, the distinguishing feature is the different surface behaviorof hydronium compared to that of other cations. Atomic cationssuch as alkali ions practically do not penetrate the topmost layerof aqueous solutions. Hydronium cation behaves differently,primarily due to the“hydrophobic”character of its oxygen.2Although the three hydrogens of H;O+ are good hydrogen bonddonors, the oxygen is, due to a significantly reduced negativecharge(-0.4 e compared to a charge of -0.8 e of wateroxygen), a relatively poor hydrogen bond acceptor. As a resultof its amphiphilic character (a term coined for HO+ in ref 21),hydronium can be stabilized at the air/solution interface withits H atoms hydrogen bonded to surrounding water molecules,whereas its oxygen atom remains unbound and pointing intothe gas phase. This preferential orientation of H;O+ at the air/solution interface of aqueous HCl and HBr, as extracted fromour simulations, is plotted in Figure 5. We have verified the above predictions of classical moleculardynamics by a nonpolarizable quantum hopping moleculardynamics (Q-HOP MD) simulation? for a single proton in anaqueous slab. Figure 6a) shows a comparison between densityprofiles of a single proton and single sodium cation in aqueousslabs (the inferior statistics in Figure 6 compared to Figure 1 isdue to sampling over a single ion only). These nonpolarizablecalculations confirm that the proton (unlike the sodium cation)penetrates into the interfacial layer,and its density profile acrossthe slab almost coincides with that of a single hydronium in awater slab, described by a classical nonpolarizable force field(see Figure 6b). The addition of polarizability of hydroniumand water leads to a further increase of the surface propensityof H;O+, as shown in Figure 6b. These results are in perfectagreement with the most recent quantum calculations, whichshow the surface propensity of a single proton in aqueousclusters and slabs.21,40,41 z(A) Figure 5.Probability densities of hydronium orientations frommolecular dynamics simulations of aqueous solutions of 1.2 M HCland HBr. Here O is defined as the angle between the hydronium dipolemoment (which points from the oxygen atom to the center of geometryof the hydrogen atoms) and a vector normal to the air-solutioninterface, and z is the location in the slab (z=0 corresponds to themiddle of the slab). The distributions are for the most part uniform(indicating isotropic orientational distributions), except for the pro-nounced peaks at cos 0=-1 and z ~ 14-15 A, which correspond tohydronium ions strongly oriented at the air-solution interface with theirdipoles pointing toward the interior of the solution. Recently, the surface of ice doped with NaCl or HCl has beeninvestigated in detail by means of cesium ion sputtering.42,43When the ice is heated, the two systems behave very differentlyfrom each other. Whereas in the case of NaCl doped ice, heatingresults in the disappearance of sodium cations (but not chlorideanions) from the surface,43 in the case of HCl doped ice, theelevation of temperature leads to a cationic (i.e., hydronium)and anionic surface enrichment.42 Despite the fact that theseexperiments concern ice surfaces, the vastly different behaviorof salt vs acid doped systems is indicative also for air/solutioninterfaces. The results of the present calculations may shed some lighton a long standing problem of the effect of electrolyte on bubblecoalescence.44-46 Though simple inorganic salts tend to inhibitbubble coalescence (which is one of the reasons why foam isformed when waves break in the ocean but not in freshwaterlakes), the corresponding acids have no effect.44,45 It is conceiv-able that the inhibition of bubble coalescence is related toCoulomb repulsion between interfaces due to separation ofcations and anions at the air/solution interface of salts, such asalkali chlorides, bromides, iodides, or nitrates. Due to the surfacepropensity of hydronium, strong charge separation is notobserved at the interfaces of aqueous HCl, HBr, HI, or HNO3. Inorganic electrolytes containing multivalent ions are beyondthe scope of the present study, but they nevertheless deserve abrief remark. It has been shown both in experiments andcalculations that multiply charged inorganic ions are always verystrongly repelled from the air/solution interface due to verystrong ion-water electrostatic interactions, even when the ionis very polarizable (such as sulfate).47,48 Taking as an examplesulfuric acid, it has been known for a long time that H2SO4increases surface tension at low concentrations, but decreasesit at high concentrations.16 This nonmonotonic behavior ofsurface tension and, consequently, of the surface excess can be a …...H,0 24 H0 ---.NNa* 1. AAA 1.2AAM 0.6 0 4 8 12z (Angstrom) 16 20 Figure 6. Comparison of density profiles of (a) a single hydrated protondescribed using the quantum hopping method and sodium and (b)polarizable and nonpolarizable hydronium described using a classicalforce field. rationalized within the picture emerging from the present study.Namely, at low concentrations, H2SO4 is predominantly dis-sociated to hydronium and SO4-ions. In this situation the weakattraction of hydronium to the surface cannot compete with thestrong repulsion of sulfate dianion from the air/solution interface.This results in a net negative surface ion excess (i.e., netdepletion of ions from the interface) and, consequently, a surfacetension increase. At higher concentrations, H2SO4 is no longerfully dissociated and HSO4 is becoming the predominant anion.Being a soft monovalent anion, bisulfate is not strongly repelledfrom the air/solution interface.14 This allows for a buildup of apositive net surface ion excess (i.e., net enrichment of ions inthe interfacial layer), resulting in a surface tension decrease.Moreover, H2SO4, which is a weaker acid than HCl, HBr, orHI, can presumably also appear at higher concentrations at thesurface in a molecular form, and this could further contributeto the lowering of surface tension. 7.Summary A new picture of the air/solution interface of simple inorganicelectrolytes emerges from the present molecular dynamicscalculations and VSFG spectroscopic experiments. In contradic-tion with the traditional view, ions can play an active role atthe interface and strong ionic specificity in surface propensityis the key to understanding macroscopic properties at themolecular level. In particular, the opposite sign of the changein surface tension upon adding bases (e.g., alkali hydroxides)and salts (such as alkali halides) on one side, and the corre- sponding acids on the other side, can be related to the muchstronger propensity of hydronium for the air/solution interface,compared to alkali cations. Although the present large scalemolecular simulations necessarily employ a relatively simplepolarizable classical force field (which can only approximatelydescribe water molecules, salt ions and, in particular, hydroxideand hydronium), the results are robust and compare well withmore accurate calculations on benchmark systems, as well aswith most of the surface selective experiments. The present results not only suggest a conceptual change inthe perception of the surfaces of electrolytes, which are stillmostly described within the continuum dielectric models,49-52but also have important practical implications for interfacialphysical processes (such as bubble coalescence) and heteroge-neous chemistry, e.g., in the atmosphere. For salts, this hasalready been recognized in studies of the chemistry of aqueoussea-salt aerosols,15,53,54 whereas for acids there is a plethora ofhitherto unexplored effects, for example, within the realm ofthe chemistry (e.g., corrosion processes) in the marine boundarylayer or droplet and ice nucleation and cloud formation. Acknowledgment. We thank B. J. Finlayson-Pitts and E.C. Brown for valuable comments. Support via the NSF-fundedEnvironmental Molecular Science Institute (grant CHE 0431512)and from the Czech Ministry of Education (grant ME644) isgratefully acknowledged. Part of the work in Prague wassupported via the Research Project Z40550506. The work atPNNL was performed under the auspices of the Division ofChemical Sciences, Office of Basic Energy Sciences, U.S.Department of Energy. Support of the experimental work atOhio State by NSF (grant ATM-0413893) and ResearchCorporation (Research Innovation Award) is also gratefullyacknowledged. References and Notes (1) Onsager, L.; Samaras, N. N. T. J. Chem. Phys. 1934,2,528. ( (2) Adam, N . K. T h e Physics a n d Che m istry of Surfaces; Oxford University Press: London, 1 941. ) ( (3) Randles, J. E . B . Phys. Chem. Liq . 1977 , 7 , 107. ) ( (4) Jungwirth, P.; T obias, D . J . J. Phys. Chem. B 2002, 1 0 6, 6361. ) ( (5) J ungwirth, P. ; T obias, D. J. J . Phys. C hem. B 2001, 10 5 , 10468.(6)D a ng, L . X.; Chang, T.-M. J . Phys. Chem. B 2002, 106,235. ) ( (7) S alvador, P.; C u rtis, J. E .; Tobias, D. J.; Jungwir t h, P. Phys. Chem.Chem. P hys. 2 003, 5,3752. ) ( (8) Yang, X .; K iran, B .; Wang, X .-B.; W ang, L . -S.; M u cha, M . ; Jungwirth, P. J . Phys. Chem. A 2004 , 108,7 8 20. ) ( (9) Ghosal, S.; Shbeeb, A.; H emminger, J. C. Geophys. Res.Lett. 2000, 27, 1 879. ) ( (10) L i u , D.; Ma, G . ; L e vering, L. M .; Al l en, H. C. J. Phys. Ch e m. B 2004, 1 08,2252. ) ( ( 1 1 ) P etersen, P . B .; Saykally, R . J . Chem. P h ys. L e tt. 2 004,39 7 ,51. ) ( (12) P etersen, P. B . ; Johnson, J. C.; Knutsen, K. P.; Saykally, R. J. Chem.Phys. L ett. 2004, 397, 46. ) ( ( 13) Ghosal, S.; H e mminger, J. C.; Bl u hm, H.; Mun, B. S.; Hebe n streit, E. L . D.; Ketteler, G.; Ogletree , D. F.; Requejo, F. G.; Salmeron, M. Science 2005,307,563. ) ( (14) V rbka, L. ; M ucha, M . ; M i nofar, B.; Jungwirth, P.; B rown, E . C.; Tobias, D. J. Curr. Opin. C olloid Interface Sci. 2004, 9, 6 7. ) ( (15) K nipping, E. M. ; Lakin, M. J .; Foster, K. L.; Jungwirth, P.; Tobias,D. J.; Gerber, R. B.; Dabdub, D. ; Fi n layson-Pitts, B.- J . Science 2000, 288,301. ) ( (16) W ashburn, E . W . , E d . International Critical T ables; M cGraw-Hill: New Y ork, 1928; V ol. I V. ) (17) Baldelli, S.; Schnitzer, C.; Shultz, M. J. Chem. Phys. Lett. 1999,302,157. (18) Baldelli, S.; Schnitzer, C.; Campbell, D. J.; Shultz, M. J.J. Phys.Chem. B 1999,103,2789. (19) Schnitzer, C.; Baldelli, S.; Campbell, D. J.; Shultz, M. J. J. Phys.Chem. A 1999,103,6383. (20) Petersen, P. B.; Saykally, R. J.J. Phys. Chem.B 2005,109,7976.(21) Petersen, M. K.; Iyengar, S. S.; Day, T.J. F.; Voth, G. A. J. Phys.Chem. B 2004,108,14804. ( (22) F oster, K. L.; Plastridge, R. A. ; Bottenheim, J . W.; Shepson, J.B.;Finlayson-Pitts, B. J.; Spicer , C . W. Science 2001, 291,471. ) (23) Case, D. A.; Pearlman, D. A.; Caldwell, J. W.; Cheatham, T. E.,III; Ross, W. S.; Simmerling, C. L.; Darden, T. A.; Merz, K. M.; Stanton,R. V.; Cheng, A. L.; Vincent, J. J.; Crowley, M.; Tsui, M.; Radmer, R. J.;Duan, R. Y.; Pitera, J.; Massova, I.; Seibel, G. L.; Singh, U. C. AMBER6,University of California, San Francisco, 1999. ( (24) C aldwell,J . ; K ollman, P . A. J. P hys. Chem.199 5 , 99, 6208. ) ( (25) D ang, L. X.; Chang, T .-M. J. C hem. Phys. 1 997,106, 8149. ) (26) Dang,L. X.; J. Phys. Chem. B 2002, 106, 10398. (27) Brodskaya, E.; Lyubartsev, A. P.; Laaksonen, A. J. Phys. Chem. B2002,106,6479. (28) Dang, L. X.; J. Chem. Phys. 2003, 119, 6351. ( (29) L iil, M. A.; Helms, V.J. C hem. P h ys. 2 0 01, 115, 7 9 93. ) ( (30) Jungwirth, P.; Tobias, D. J. J . Phy s. Chem. B 2000, 104, 7 702. ) ( (31) E ssmann, U . ; Perera, L .; Berkowitz, M . L .; Darden, T . A.; Pedersen, L. G. J. Chem. Phys. 1995, 103,8577. ) ( (32) R yckaert, J.-P.; C iccotti, G.; Berendsen, H. J. C . J. C o mput. P h ys. 1977,23,327. ) ( (33) W ilson,M . A . ; P o horille, A . J. Chem. P hys.1 9 91,95 , 6005. ) (34) Robertson, W. H.; Diken, E. G.; Price, E. A.; Shin,J.-W.; Johnson,M. A. Science 2003, 299,1367. ( (35) H eydweiler, A. Ann. Phys. 1910, 33, 145. ) (36) Zhang, Y.; Feller, S. E.; Brooks, B. R.; Pastor, R. W. J.Chem.Phys. 1995,103,10252. (37) Raymond, E. A.; Richmond, G. L. J. Phys. Chem. B 2004,108,5051. (38) Moad, A. J.; Simpson, G. J. J. Phys. Chem. B 2004, 108,3548. (39) Buch,V.; Sadlej, J.; Aytemiz-Uras,N.; Devlin, J. P. J. Phys. Chem.A2002, 106,9374. (40) Iyengar, S. S.; Day, T. J. F.; Voth, G. A. Int. J. Mass Spectrom.,in press. (41) Shin,J. W.; Hammer, N. I.; Diken,E. G.; Johnson, M. A.; Walters,R. S.; Jaeger, T. D.; Duncan, M. A.; Christie, R. A.; Jordan, K. D. Science2004, 304, 1137. (42) Kang, H.; Shin,T.-H.; Park, S.-C.; Kim, I. K.; Han, S.-J. J. Am.Chem. Soc. 2000, 122, 9842. (43) Kim, J.-H.; Shin, T.; Jung, K. H.; Kang, H. J. Chem. Phys., inpress. ( (44) C raig, V. S. J.; Ninham, B . W . ; Pashley, R. M. Nature 1993, 364, 31 7 . ) ( (45) C raig,V . S. J . Curr. Opin. C o lloid Interface S c i. 2004, 9, 17 8 . ) ( (46)) Marcelja, S. Curr. Opin. C olloid Interface S ci. 2004, 9, 1 65. ) ( (47) W ang,X.-B.; Yang, X.;Nicholas,J. B . ; Wang, L.-S. Science 2001, 294, 1 322. ) (48) Jungwirth, P.; Curtis, J. E.; Tobias, D. J. Chem. Phys. Lett. 2003,367,704. (49) Manciu, M.; Ruckenstein, E. Adu. Colloid Interface Sci. 2003,105,63. (50) Markin, V. S.; Volkov, A. G. J. Phys. Chem. B 2002,106,11810. (51) Karraker, K. A.; Radke, C. J. Adu. Colloid Interface Sci. 2002, 96,231. (52) Bostrom,M.; Williams, D. R. M.; Ninham, B. W. Langmuir 2001,17,4475. (53) Finlayson-Pitts, B. J.; Hemminger, J. C. J. Phys. Chem. A 2000,104,11463. (54) Hu, J. H.; Shi, Q.;Davidovits, P.; Worsnop, D. R.; Zahniser, M.S.; Kolb, C. E. J. Phys. Chem. 1995,99,8768. (55) Gao, R. S.; Popp, P. J.; Fahey, D. W.; Marcy, T. P.; Herman, R. ( L .; Weinstock, E. M.; Baumgardner, D. G. ; Ga r rett, T. J. ; R o senlof, K. H.; Thompson, T. L . ; B u i, P . T.; Ridley, B . A .; W ofsy, S . C.; T o on, O . B . ; T 一 olbert, M. A.; Karcher, B .; Peter, T.; Hudson, P. K . ; Weinheimer, A . J .; H eymsfield, A . J . Science 2004, 303, 5 16. )
关闭-
1/7
-
2/7
还剩5页未读,是否继续阅读?
继续免费阅读全文产品配置单
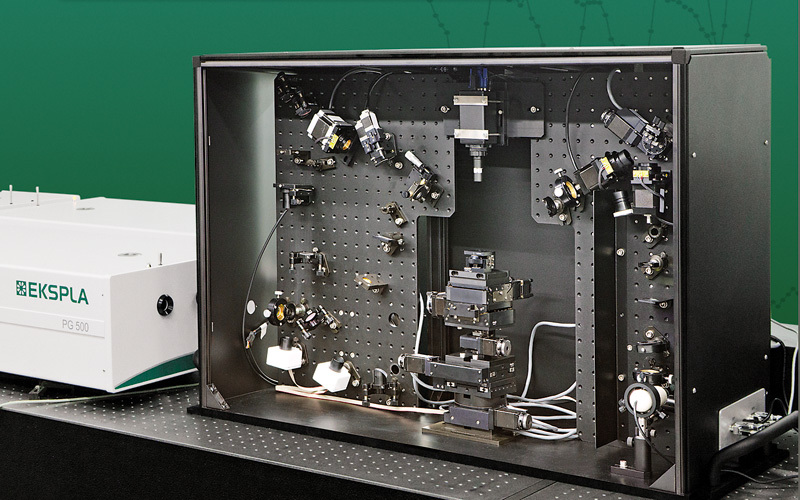
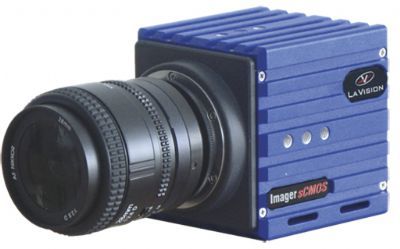
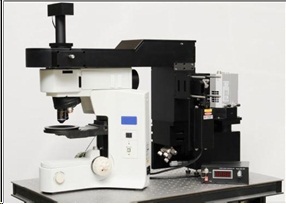
北京欧兰科技发展有限公司为您提供《酸,碱,盐溶液中水溶性酸,碱,盐溶液表面统一的分子图像检测方案(其它光谱仪)》,该方案主要用于基础有机原料中水溶性酸,碱,盐溶液表面统一的分子图像检测,参考标准《暂无》,《酸,碱,盐溶液中水溶性酸,碱,盐溶液表面统一的分子图像检测方案(其它光谱仪)》用到的仪器有Ekspla SFG 表面和频光谱分析系统、飞秒Ti:Sapphire激光器 Pulse One、德国LaVision PIV/PLIF粒子成像测速场仪、Imager sCMOS PIV相机。
我要纠错
相关方案



 咨询
咨询

