茶、茶汤中风味物质检测方案(热解吸仪)
检测样品
茶叶
检测项目
营养成分
关联设备
共2种
下载方案
方案详情文
文章介绍了最新的薄膜固相微萃取TF-SPME与搅拌棒吸附萃取SBSE结合使用,萃取茶汤中的风味化合物。研究了顶空和直接浸没萃取方式。与仅使用SBSE或仅使用TFSPME的技术相比,两者结合的方法对40种选定的挥发性化合物的线性范围更广,最低限度更低(2至3个数量级),令人满意的测定系数(R²>0.980),并提高了灵敏度。
智能文字提取功能测试中
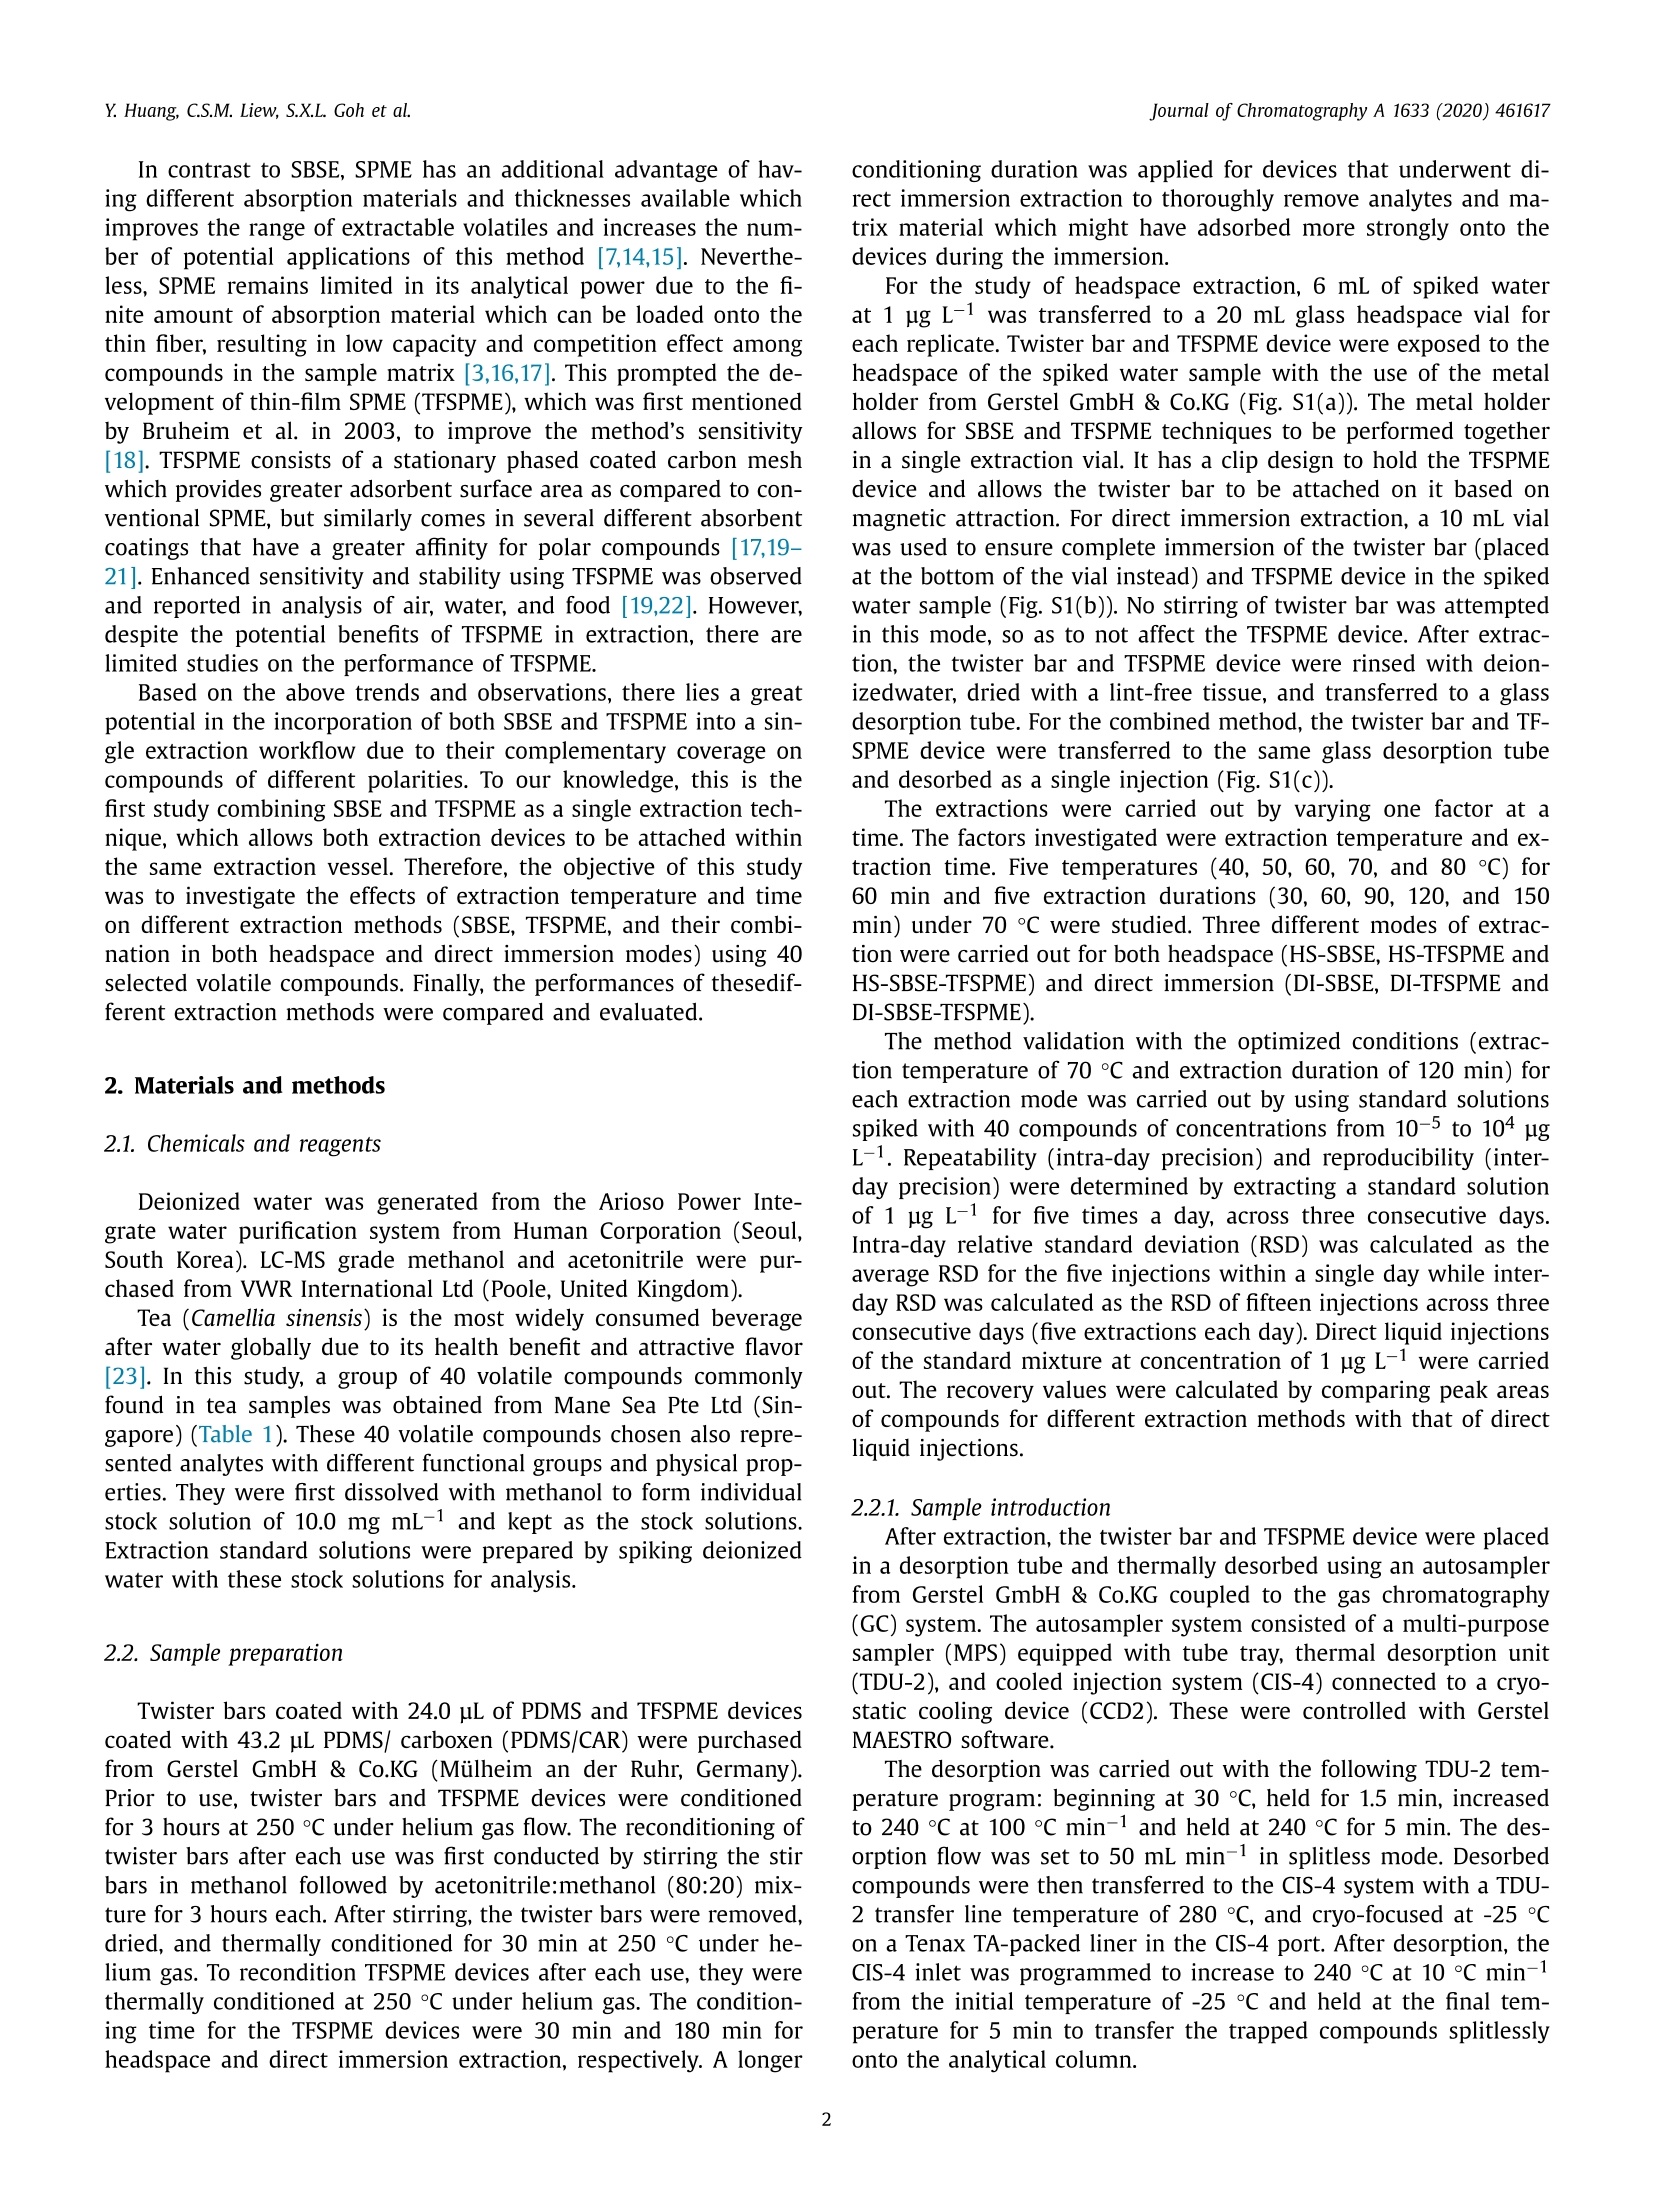
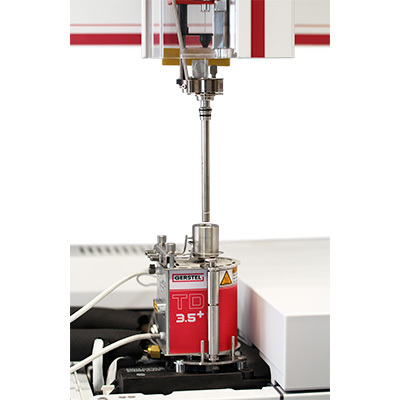
Journal of Chromatography A 1633 (2020)461617 Y. Huang, C.S.M. Liew, S.X.L. Goh et al.journal of Chromatography A 1633 (2020) 461617 Contents lists available at ScienceDirect Journal of Chromatography A ELSEVIER journal homepage: www.elsevier.com/locate/chroma Enhanced extraction using a combination of stir bar sorptiveextraction and thin film-solid phase microextraction Yunle Huangab, Christina Shu Min Liew, Shalene Xue Lin Goh, Rui Min Vivian Goh,Kim Huey Ee, Aileen Puaa, Shao Quan Liub.*, Benjamin Lassabliere, Bin Yua* a Mane SEA PTE LTD, 3 Biopolis Drive, #07-17/18/19 Synapse 138623, Singapore Department of Food Science and Technology, National University of Singapore, S14 Level 5, Science Drive 2 117542, Singapore ‘Gerstel LLP, 10 Science Park Road, #02-18 The Alpha 117684, Singapore ARTICLE INF O ABSTRAC T Article history: Received 17 July 2020Revised 28 September 2020Accepted 10 October 2020 Available online 13 October 2020 Keywords:Sample preparationHeadspaceDirect ImmersionSBSETFSPME Sorptive extraction techniques have experienced increased popularity, but they face limitations in dy-namic range and sensitivity. In this study, a new method combining stir bar sorptive extraction (SBSE)and thin-film solid-phase microextraction (TFSPME) was developed, and optimization for extraction tem-perature (70C) and time (120 min) was carried out. Polydimethylsiloxane (PDMS)-coated SBSE andPDMS/carboxen (PDMS/CAR)-coated TFSPME were used, and both headspace and direct immersion ex-traction modes were also studied. Using 40 selected volatile compounds, the combined method generallygave a wider linearity range with lower minimum limits (2 to 3 orders), satisfactory coefficient of deter-mination (R2>0.980), and improved sensitivity when compared to SBSE-only or TFSPME-only techniques.Furthermore, despite the combined use of two extraction devices, the repeatability (<13.1%) and re-producibility(<13.4%) of the combined method were comparable to SBSE-only or TFSPME-only results.Higher recoveries of up to 20% were also achieved by the combined method. Compared to the conven-tional SBSE method, the new method provided superior performance in terms of dynamic range andsensitivity for compounds of various polarities. In conclusion, this study provided insights on the suit-ability of the various extraction methods for compounds of different chemical properties which could aidin future applications for volatiles analysis in food, biological, and environmental sectors. 1. Introduction Sorptive extraction is a bulk retention process described as thepartition of compounds in a two-phase system, which may refer toeither an aqueous sample matrix and the absorption material, orthe sample gaseous headspace and the absorption material [1,2].For the past few decades, miniaturized sorptive extraction methodssuch as stir bar sorptive extraction (SBSE) and solid-phase microex-traction (SPME) have increasingly become the extraction techniqueof choice [3-5]. This is because they are simple, straightforwardto use (i.e. they do not require further concentration steps), en-vironmentally friendly (require the use of minimal or no harmfulorganic solvent), only require small sample volume, and have lowoperation costs [6-8]. * Corresponding authors. ( E-mail addresses: f s t lsq@nus.edu.sg ( S.Q. Liu), gsgpbiy@gmail.com (B . Yu). ) ( 0021-9673/O 2020 El s evier B.V. All rights r eserved. ) SBSE was first introduced in 1999 and quickly gained popularityin various sample applications, such as food, environmental, andbiological samples, mainly due to its convenience of use [1,4,9].The stir bar used in SBSE, or commercially known as Twister, ismade of a magnetic bar encased in glass which is coated with alayer of polydimethylsiloxane (PDMS) phase. Even though they arewidely used, SBSE has two main shortcomings, which is its lowextraction efficiency for polar compounds due to poor affinity ofPDMS towards such compounds and inadequate sensitivity and se-lectivity due to the limited types of absorption material that arecompatible with its set-up [4,6,9-12]. The poor affinity of PDMStwister bar towards polar compounds has motivated the develop-ment of various innovative methods to improve its extraction ca-pability of such compounds. There are also high demands for newsuitable materials which provide both good stability and reason-able absorption capability [4,6,13]. However, the developments ofsuch material are usually research-based and not fully commercial-ized. Thus, the selection of a suitable SBSE absorption material re-mains a barrier for many applications of this extraction technique. Based on the above trends and observations, there lies a greatpotential in the incorporation of both SBSE and TFSPME into a sin-gle extraction workflow due to their complementary coverage oncompounds of different polarities. To our knowledge, this is thefirst study combining SBSE and TFSPME as a single extraction tech-nique, which allows both extraction devices to be attached withinthe same extraction vessel. Therefore, the objective of this studywas to investigate the effects of extraction temperature and timeon different extraction methods (SBSE, TFSPME, and their combi-nation in both headspace and direct immersion modes) using 40selected volatile compounds. Finally, the performances of thesedif-ferent extraction methods were compared and evaluated. 2. Materials and methods 2.1. Chemicals and reagents Deionized water was generated from the Arioso Power Inte-grate water purification system from Human Corporation (Seoul,South Korea). LC-MS grade methanol and acetonitrile were pur-chased from VWR International Ltd (Poole, United Kingdom). Tea (Camellia sinensis) is the most widely consumed beverageafter water globally due to its health benefit and attractive flavor[23]. In this study, a group of 40 volatile compounds commonlyfound in tea samples was obtained from Mane Sea Pte Ltd (Sin-gapore) (Table 1). These 40 volatile compounds chosen also repre-sented analytes with different functional groups and physical prop-erties. They were first dissolved with methanol to form individualstock solution of 10.0 mg mL-1 and kept as the stock solutions.Extraction standard solutions were prepared by spiking deionizedwater with these stock solutions for analysis. 2.2. Sample preparation Twister bars coated with 24.0 uL of PDMS and TFSPME devicescoated with 43.2 uL PDMS/ carboxen (PDMS/CAR) were purchasedfrom Gerstel GmbH & Co.KG (Mulheim an der Ruhr, Germany).Prior to use, twister bars and TFSPME devices were conditionedfor 3 hours at 250C under helium gas flow. The reconditioning oftwister bars after each use was first conducted by stirring the stirbars in methanol followed by acetonitrile:methanol (80:20) mix-ture for 3 hours each. After stirring, the twister bars were removed,dried, and thermally conditioned for 30 min at 250 ℃ under he-lium gas. To recondition TFSPME devices after each use, they werethermally conditioned at 250 °C under helium gas. The condition-ing time for the TFSPME devices were 30 min and 180 min forheadspace and direct immersion extraction, respectively. A longer conditioning duration was applied for devices that underwent di-rect immersion extraction to thoroughly remove analytes and ma-trix material which might have adsorbed more strongly onto thedevices during the immersion. For the study of headspace extraction, 6 mL of spiked waterat 1 pg L-1 was transferred to a 20 mL glass headspace vial foreach replicate.Twister bar and TFSPME device were exposed to theheadspace of the spiked water sample with the use of the metalholder from Gerstel GmbH & Co.KG (Fig. S1(a)). The metal holderallows for SBSE and TFSPME techniques to be performed togetherin a single extraction vial. It has a clip design to hold the TFSPMEdevice and allows the twister bar to be attached on it based onmagnetic attraction. For direct immersion extraction, a 10 mL vialwas used to ensure complete immersion of the twister bar (placedat the bottom of the vial instead) and TFSPME device in the spikedwater sample (Fig. S1(b)). No stirring of twister bar was attemptedin this mode, so as to not affect the TFSPME device. After extrac-tion, the twister bar and TFSPME device were rinsed with deion-izedwater, dried with a lint-free tissue, and transferred to a glassdesorption tube. For the combined method, the twister bar and TF-SPME device were transferred to the same glass desorption tubeand desorbed as a single injection (Fig. S1(c)). The extractions were carried out by varying one factor at atime. The factors investigated were extraction temperature and ex-traction time. Five temperatures (40, 50, 60, 70, and 80℃) for60 min and five extraction durations (30, 60, 90, 120, and 150min) under 70 °C were studied. Three different modes of extrac-tion were carried out for both headspace (HS-SBSE, HS-TFSPME andHS-SBSE-TFSPME) and direct immersion (DI-SBSE, DI-TFSPME andDI-SBSE-TFSPME). The method validation with the optimized conditions (extrac-tion temperature of 70 ℃ and extraction duration of 120 min) foreach extraction mode was carried out by using standard solutionsspiked with 40 compounds of concentrations from 10-5 to 104 ugL-1. Repeatability (intra-day precision) and reproducibility (inter-day precision) were determined by extracting a standard solutionof 1 ug L-1 for five times a day, across three consecutive days.Intra-day relative standard deviation (RSD) was calculated as theaverage RSD for the five injections within a single day while inter-day RSD was calculated as the RSD of fifteen injections across threeconsecutive days (five extractions each day). Direct liquid injectionsof the standard mixture at concentration of 1 ug L-1 were carriedout. The recovery values were calculated by comparing peak areasof compounds for different extraction methods with that of directliquid injections. 2.2.1. Sample introduction After extraction, the twister bar and TFSPME device were placedin a desorption tube and thermally desorbed using an autosamplerfrom Gerstel GmbH & Co.KG coupled to the gas chromatography(GC) system. The autosampler system consisted of a multi-purposesampler (MPS) equipped with tube tray, thermal desorption unit(TDU-2), and cooled injection system (CIS-4) connected to a cryo-static cooling device (CCD2). These were controlled with GerstelMAESTRO software. The desorption was carried out with the following TDU-2 tem-perature program: beginning at 30 C, held for 1.5 min, increasedto 240 ℃ at 100 C min-1 and held at 240 C for 5 min. The des-orption flow was set to 50 mL min-1 in splitless mode. Desorbedcompounds were then transferred to the CIS-4 system with a TDU-2 transfer line temperature of 280 C, and cryo-focused at -25 Con a Tenax TA-packed liner in the CIS-4 port. After desorption, theCIS-4 inlet was programmed to increase to 240 ℃ at 10℃ min-from the initial temperature of -25℃ and held at the final tem-perature for 5 min to transfer the trapped compounds splitlesslyonto the analytical column. Table 1 Chemical and physical information of studied compounds and their grouping according to profiles of peak area under different extraction temperature and time. logKo/w= octanol/water partition coefficient, defined as the ratio of a chemical's concentration in the octanol phase to its concentration in the aqueous phase of a two-phaseoctanol/water system.bSolubility calculated at 25°℃ except for methyl salicylate (30C), dihydroactinidiolide (13℃) and ethyl butyrate (20℃); values taken from The Good Scents Company (http://www.thegoodscentscompany.com/index.html). 2.2.2. GC-QTOF-MS analysis The analysis was conducted using an Agilent 7890B GC systemand Agilent 7250 Accurate-Mass quadrupole time-of-flight massspectrometry (QTOF-MS). Separation of compounds was performedon a HP-Innowax column (60 m x 0.25 mm i.d. x 0.25 um filmthickness) (Agilent, CA, USA). The column temperature was ini-tially held at 40 ℃ for 7 min before increasing to 165 C at 5 ℃min-1, followed by another increase to 170 ℃ at 1C min-1 andfinally to 240 ℃ at 20 ℃ min-1 and held at 240 C for 5 min. He-lium was used as the carrier gas under constant column flow of3 mL min-1 with a back flush of 3 mL min-1 at the purged ul-timate union. The MS was operated in scan mode (29-550 m/z)using electron ionization at 70 eV. The data rate was set at 50 Hz.Quench helium flow of 4 mL min-1 and collision nitrogen flow of1 mL min-1 were used. A standard chromatogram obtained in thiswork is shown as Figure S2. It shows well separation among the40 compounds using the above instrumental settings. Triplicates were conducted for all experiments, and the meanvalues and standard deviations were reported. Agilent MassHunterWorkstation Quantitative Analysis (B.10.00) was used for data pro-cessing of chromatogram and mass spectra. 3. Results and discussions In this study, both headspace and direct immersion modes werecarried out. Headspace extraction methods target compounds withlow-water solubility and high-volatility, which are often readily en-riched in the headspace of liquid and solid samples [16,24]. Extrac-tion from the headspace also serves an additional benefit of avoid-ing matrix contamination, where macromolecules from the samplemay bind directly to the coating and cause possible artifact forma-tion during the desorption process [24]. On the other hand, directimmersion extraction methods target compounds of mid-volatilityand high-water solubility, as these compounds prefer to remain inthe aqueous phase [2,24]. Therefore, it is important to understandthe performance of the different extraction methods to cover com-pounds of different polarity, water solubility, and volatility. Hence,40 selected volatile compounds covering wide range of polarity(logKo/w from-0.26-4.83), water solubility (2.49 - 1.00×10⁶ mgL-1), and boiling point (112 -296C) were studied in this work.For subsequent easy referencing, a few major profiles (which indi-cate the trends for extraction) were presented for each optimiza-tion, and compounds with similar profiles were grouped together as shown in Table 1. The extraction profiles of each optimizationare shown in Fig. 1. 3.1. Optimization of headspace extraction In this section, the extraction temperature and duration forheadspace extraction using HS-SBSE, HS-TFSPME, and their combi-nation of HS-SBSE-TFSPME were optimized. The peak areas wereplotted against the parameters, and their different profiles wereobserved for the 40 selected compounds. 3.1.1. Effect of extraction temperature Instead of showing the plots for all 40 compounds, the com-pounds were grouped according to their profiles and the plot forone compound was used to represent each group. Four differentprofiles were observed and represented in Fig.1(a) by butanoicacid (Profile A1; Fig. 1(a-i)), guaiacol (Profile A2; Fig. 1(a-ii)), dihy-droactinidiolide (Profile A3; Fig. 1(a-iii)), and geraniol (Profile A4;Fig. 1(a-iv)). Generally, higher peak areas were observed as temperature in-creased due to the elevated concentration of the compounds inheadspace [25]. In Profile A1, the peak area gradually increasedwith increasing temperature till 70 ℃ and plateaued as the tem-perature increased to 80 C, with the combined method obtainingthe highest peak area of the three methods. For Profiles A2 and A4,greater peak areas were observed with increased temperatures andthe maximum peak area responses were recorded at 80 C. Thedifference between Profiles A2 and A4 was that in Profile A2, HS-SBSE-TFSPME gave the highest recoveries for the investigated com-pounds, while in Profile A4, HS-SBSE displayed the highest com-pound recoveries. Lastly, Profile A3 was found to have maximumpeak areas at 70 ℃, and these decreased when the temperaturewas further increased. Competition effect from compounds withProfile A2 and A4 might have resulted in lower recoveries of thecompounds in Profile A3 at 80 C. Therefore, for headspace extrac-tion, 70 C was chosen as the optimal extraction temperature sincemost compounds exhibited the highest area response under thiscondition. 3.1.2. Effect of extraction time Four different profiles were observed and represented inFig. 1(b) by butanoic acid (Profile B1; Fig. 1(b-i)), β-pinene (Pro-file B2; Fig. 1(b-ii)), dihydroactinidiolide (Profile B3; Fig. 1(b-iii)),and geraniol (Profile B4; Fig. 1(b-iv)). Generally, the peak areas of the compounds increased withlonger extraction time until equilibrium was reached.Most of thecompounds belonged to Profile B1 where the peak area increasedtill 120 min, and plateaued when the extraction time was furtherextended to 150 min. Profile B4 was observed to have a similartrend to Profile B1, but the technique that gave the highest recover-ies of analytes was HS-SBSE for the former while the highest recov-eries were obtained by HS-SBSE-TFSPME for the latter. For ProfileB2, the peak areas of the compounds were still increasing at 150min, which indicated that the equilibrium had not been reached.The attainment of equilibrium is important and allows highest sen-sitivity as the amount of analytes extracted is maximized [26]. Asfor Profile B3, the peak area of the compounds increased till 120min and then decreased thereafter. It is plausible that for longerextraction timings, more compounds entered the headspace andcompounds in Profile B3 faced competition from compounds ofProfile B2, resulting in a drop in peak areas over the extendedduration till 150 min. As such, 120 min was selected as the op-timal extraction time to maximize the area response of these com-pounds. Similar to headspace extraction, five extraction temperaturesand extraction times were studied for immersion extraction, andare discussed in the following subsections. 3.2.1. Effect ofextraction temperature Five different profiles were observed and they are representedin Fig. 2(a) by B-damascone (Profile C1; Fig. 2(a-i)), 4-methyl gua-iacol (Profile C2; Fig. 2(a-ii)), p-cymene (Profile C3; Fig. 2(a-iii)),amyl alcohol (Profile C4; Fig. 2(a-iv)), and geraniol (Profile C5;Fig. 2(a-v)). Compounds in both Profiles C1 and C2 were found to have ris-ing peak areas as temperature was increased to 70 C and re-mained constant when it was further increased to 80 C. Com-pounds with Profile C2 were not well extracted by SBSE alone andwere solely extracted due to TFSPME (results for the combinedmethod were comparable to that obtained from TFSPME alone).This could be because Profile C2 consists of high-polarity com-pounds (logKo/w<1.0) such as pyrazine, 2,3-dimethyl pyrazine, 2,5-dimethyl pyrazine, 2,3,5-trimethyl pyrazine, 2-acetyl pyrrole; or ofmid-polarity (1.10.980) wereobtained for all the different modes of extraction for all thecompounds. For both headspace and direct immersion extractionmodes, the combination of SBSE and TFSPME resulted in improve-ments in terms of the extended linearity ranges, sensitivities, orboth as compared to SBSE-only and TFSPME-only extractions, asshown in Table 3. These observations were expected as greateramounts of adsorbent materials were used in the combined tech-niques [11]. For most compounds, the linearity range for TFSPMEyielded a lower minimum value than SBSE, thereby providing validquantification values at lower concentrations. Repeatability (n=3)was performed for all possible calibration levels (<16.9%) andthese are shown in Table S1 to S6. The concentration of 1 ug L- (b) Effect of extraction time on direct immersion extraction i. Heptanol (Profile D1) Time (min) ii. 2,3-Dimethyl pyrazine (Profile D2) iii. 4-Methyl guaiacol (Profile D3) Time (min) iv. Geraniol (Profile D4) Fig. 2. Continued Table 2 (a) Characteristics of calibration curves for the three extraction methods in headspace. Compound R2a R2a R2a R2a Slope HS-SBSE HS-TFSPME HS-SBSE-TFSPME HS-SBSE HS-TFSPME HS-SBSE-TFSPME HS-SBSE HS-TFSPME HS-SBSE-TFSPME a-Pinene B-Pinene Limonene Pyrazine p-Cymene 2,5-Dimethyl pyrazine 2,3-Dimethyl pyrazine 2,3,5-Trimethyl pyrazine Acetic acid Linalool Isophorone Butanoic acid Safranal Methyl salicylate Nerol β-Damascone B-Damascenone Geraniol Hexanoic acid Guaiacol a-Ionone Benzyl alcohol 2-Phenylethyl alcohol B-Ionone 4-Methyl guaiacol 1 to 104 10-3 to 103 10-3 to 103 10-4 to 102 10-4to 102 10-3 to 103 10-2 to 1021 to 1021 to 10310-3 to 110-3 to 10210-2 to 10210-3 to 10310-1 to 10310-3 to 10210-2 to 10210-2 to 10210-3 to 102102 to 10510-3 to 10210-2 to 10310-3 to 10310-2 to 10310-3 to 103 10-4 to 10 10-3 to 104 10-4 to 10 10-2 to 104 10-4 to 102 10-3 to 102 10-3to 10310-4 to 10210-2 to 10410-3 to 10310-3 to 10210-4 to 10310-4 to 10310-4 to 1010-2 to 10310-3 to 10210-2 to 10210-2 to 10210-2 to 10310-3 to 10210-2 to 10210-4 to 10310-2 to 10310-4 to 102 10-3 to 104 10-3 to 103 10-4 to 10 10-4 to 10? 10-4 to 102 10-3 to 102 10-3 to 10210-1 to10310-3 to 10310-3 to 10310-3 to 10210-4 to 10310-3 to 10310-4 to 1010-3 to 10310-4 to 10210-3 to 10210-3 to 10310-2 to 10310-3 to 10210-2 to 10210-4 to 10310-2 to 10310-3 to 103 0.995 0.996 0.989 0.991 0.999 0.995 0.9820.9840.9930.9990.9990.9940.9820.9970.9900.9990.9990.9980.9990.9980.9980.9990.9930.999 0.982 0.996 0.987 0.994 0.999 0.996 0.999 0.999 0.999 0.983 0.994 0.999 0.983 0.978 0.991 0.999 0.999 0.999 0.998 0.999 0.997 0.999 0.997 0.999 0.994 0.994 0.998 0.998 0.999 0.999 0.999 0.992 0.991 0.960 0.999 0.997 0.996 0.990 0.999 0.999 0.999 0.999 0.996 0.998 0.991 0.988 0.997 0.997 5.10×10 2.96×10⁸ 5.99×10⁸ 4.54×10⁶ 1.99×10⁹ 7.71×10' 9.54×10⁷ 3.46×10⁷ 3.71×10⁸ 4.41×10⁹ 1.19×10⁹ 4.03×10⁹ 7.35×10⁸ 3.79×10⁸ 3.12×10⁹ 7.35×10⁹ 5.03×10⁹ 2.19×10⁹ 4.22×10⁶ 5.31×10⁹ 8.80×10⁷ 5.93×10⁷ 9.05×10' 6.52×10° 7.23x10° 1.01x10⁸ 2.97×10¹⁰ 1.92×10' 2.93×10° 6.68×10 1.27x10 1.15×10° 3.62×10 7.09×10⁸ 1.32×10⁹ 3.58×10* 5.47×108 6.17×10¹⁰ 9.36×10 7.94×10⁹ 5.00×10⁹ 1.86×10⁸ 4.86×10 5.89×10⁹ 1.25×10⁹ 1.61×10⁸ 1.39×10⁸ 7.49×10⁹ 6.52×10° 2.00×10⁸ 2.98×10¹⁰ 1.34×10⁸ 2.84×10⁹ 2.27×10⁸ 9.89×10⁸ 2.70×10⁸ 4.02×10 9.75×10⁸ 1.71×10⁹ 4.41×10⁸ 7.15×10⁸ 4.66×101 4.59×10⁸ 8.24×10⁹ 5.14×10⁹ 3.22×10⁸ 6.66×10⁷ 6.06×10° 1.30×10⁹ 2.07×10⁸ 7.32×10⁸ 7.68×10⁸ aR2= coefficient of determination Compound Range (ug L-) R2a Slope DI-SBSE DI-TFSPME DI-SBSE-TFSPME DI-SBSE DI-TFSPME DI-SBSE-TFSPME DI-SBSE DI-TFSPME DI-SBSE-TFSPME a-Pinene 10-2 to 10 10-4 to 10 10-4 to 102 0.985 0.996 0.986 2.98×10° 4.35×10¹⁰ 1.34×10 B-Pinene 10-3 to 102 10-5 to 103 10-5 to 102 0.990 0.991 0.994 4.87×10⁸ 1.71x10 6.42×10 Limonene 10-5 to 102 10-5 to 102 10-5 to 102 0.991 0.999 0.996 8.24×10⁹ 5.64×10° 5.07x10° Pyrazine 10-2 to 102 10-2 to 102 10-4 to 102 0.999 0.992 0.999 2.55×10⁸ 4.21x10⁹ 1.36×10 p-Cymene 10-5 to 102 10-5 to 102 10-5 to 102 0.999 0.960 0.998 7.73x10⁸ 1.66×10⁹ 5.52x10⁹ 2,5-Dimethyl pyrazine 1 to 104 10-4 to 10 10-4 to 102 0.997 0.981 0.999 2.42×10 5.02×10 3.38×10⁹ 2,3-Dimethyl pyrazine 1 to 10- 10-4to 102 10-4 to 102 0.999 0.997 0.996 2.70×10⁸ 2.63×10° 1.51×10⁹ 2,3,5-Trimethyl pyrazine 10-2 to 104 10-4 to 102 10-4 to 102 0.989 0.996 0.999 4.31x10 1.82×10° 3.26×10° Acetic acid 10-2 to 10 10-4 to 10 10-4 to 10 0.989 0.997 0.999 1.62×10° 5.59×10⁹ 6.24×10⁸ Linalool 10-4 to 10² 10-4 to 102 10-4 to 10² 0.999 0.994 0.995 3.84×10° 2.36×10 1.18×10¹⁰ Isophorone 10-2 to 10 10-2 to 10 10-3 to 102 0.989 0.994 0.993 1.43×10⁹ 4.73×10 3.21×10⁹ Butanoic acid 10-1 to 102 10-4 to 1 10-4 to 10 0.993 0.997 0.999 8.85×10 3.71×10⁹ 2.95×10° Safranal 10-5 to 10 10-5 to 10 10-5 to 10 0.994 0.980 0.959 3.28×10⁹ 2.57×10¹⁰ 2.27×10¹⁰ Methyl salicylate 10-3 to 102 10-5 to 102 10-5 to 102 0.996 0.994 0.998 2.40×10° 2.76×10⁹ 9.33×10⁹ Nerol 10-2 to 104 10-4 to 104 10-4 to 102 0.999 0.999 0.996 3.79×10⁹ 1.40×10⁸ 4.83×10° B-Damascone 10-2 to 102 10-2 to 102 10-2 to 102 0.999 0.998 0.995 6.27×10⁹ 7.35×10⁹ 7.25×10⁹ B-Damascenone 10-2 to 102 10-2 to 102 10-2 to 102 0.992 0.999 0.999 4.80×10⁹ 5.23×10⁹ 5.06×10⁹ Geraniol 10-4 to 10 10-2 to 10 10-2 to 102 0.999 0.996 0.998 3.06×10° 1.51×10° 3.70×10⁹ Hexanoic acid 10-2 to 10 10-2 to 104 10-2 to 104 0.999 0.999 0.999 1.35x10⁸ 9.57×10 4.46×10⁸ Guaiacol 10-2 to 102 10-1 to 102 10-4 to 102 0.998 0.995 0.998 4.80×10° 5.88×10⁹ 8.05×10⁹ a-lonone 10-2 to 102 10-2 to 102 10-2to 102 0.999 0.994 0.999 3.98×10⁸ 2.30×10 5.27×10° Benzyl alcohol 10-5 to 10 10-5 to 10 10-5 to 102 0.999 0.997 0.999 2.82×10⁸ 4.59×10⁹ 4.55×10 2-Phenylethyl alcohol 10-2 to 102 10-4 to 102 10-4 to 102 0.999 0.998 0.999 2.36×10⁸ 1.79×10⁹ 5.49x10° B-Ionone 10-2 to 102 10-2 to 102 10-2 to 102 0.999 0.994 0.999 5.86×10 7.43×10° 7.91×10⁹ 4-Methyl guaiacol 10-4 to 102 10-4 to 102 onaatm3o3ato Table 3 Summary of combined extraction methods for headspace and direct immersion extractions. a x represents worse values obtained than SBSE-only and TFSPME-only,· represents similar results obtained by SBSE-only or TFSPME-only, √/ represents improvements, and √√represents great improvements. (a) Effect of straight-chain alcohols (b) Effect of straight-chain ethyl ester HS-SBSE Fig. 3. Effect of carbon number on extraction profiles for (a) straight-chain alcohols; (b) straight-chain ethyl esters. Error bars show the standard deviations (n=3). was selected for additional precision study in the next section asit’s the lowest concentration within the linearity range of all 40compounds. The ability to detect differences among different sam-ples was also improved when SBSE was combined with TFSPMEas the highest slope was observed for SBSE-TFSPME, compared toSBSE-only or TFSPME-only. In Table 3, decreases in sensitivities were observed for bu-tanoic acid, nerol,and gerianol (indicated by 'x’) in the combinedmethod for headspace extraction. This was compensated by thistechnique's wider linearity range, which thus enhanced the overallperformance of the combined method compared to SBSE-only andTFSPME-only extractions. 3.5.2.Repeatability, reproducibility, and recoveries Repeatability expressed as intra-day RSD, reproducibility ex-pressed as inter-day RSD, and recoveries were determined and pre-sented in Table 2(c). For intra-day repeatability, the RSD for SBSE, TFSPME and SBSE-TFSPME were in the range of 2.6-11.4%,0.8-10.6 %, and 1.4-10.1%%respectively for headspace extraction and 1.7-13.1 %, 1.8-13.0%, and 2.6-9.4 % respectively for direct immersion extraction. Forinter-day reproducibility, the RSD for SBSE, TFSPME, and combined extraction were in the range of 0.1-13.1 %%1.9-12.6%, and 0.3-12.2 % respectively for headspace extraction as well as 0.7-13.4%, 2.1-11.6%, and 0.03-10.4% respectively for direct immersion.Despite the use of both extraction devices together in the com-bined method, the repeatability and reproducibility of the com-bined technique were mostly similar to SBSE-only and TFSPME-only results. All the tested extraction modes resulted in good re-peatability and reproducibility. In Table 3, it is observed that higher repeatability values wereobserved for phenol and decanol in the combined method thanSBSE-only or TF-SBSE-only for headspace extraction. However, thevalues of 6.6 % and 6.0 % for phenol and decanol respectively werestill considered to be desirable (<10 %). For reproducibility, poor-est value was observed for ethyl octanoate (indicated by X') in theheadspace combined method. However, since this value was ob-tained based on a relatively extended trial period of 15 extractionsacross three days, the reproducibility of 13.0 % was still consideredto be acceptable. For all extractions, the trend for recovery values follows that ofpeak areas, where recoveries were highest for the combined ex-traction, followed by TFSPME-only and finally SBSE-only for most compounds. For highly polar compounds with logKo/w<1.0, en-hanced recoveries of more than 20.0 %(indicated by‘√√"inTable 3) were observed for the combined extraction or TFSPME-only, as compared to SBSE-only method. This is well-supported byother studies as the PDMS phase on the twister bar has low extrac-tion efficiency towards polar compounds [4,6,9-12]. Superior per-formances of TFSPME and combined method were also observed inB-damascone (logKo/w: 4.21), dihydroactinidiolide (logKo/w: 2.06)and amyl alcohol (logKo/w: 1.51). These analytes (with different po-larities) possess either a ketone or alcohol functional group thatcan act as a hydrogen bond acceptor, allowing them to be adsorbedmore efficiently onto the additional carboxen phase in the TF-SPME device. These observations showed that the absorption pro-cess may depend on various factors such as polarity and chemi-cal structures. It was also observed that for compounds with high-solubility in water such as hexanoic acid and a-ionone, the recov-eries for direct immersion extractions were much higher than thatof headspace extractions. This was likely to be a result of the pref-erential partitioning of compounds with high water solubility inthe aqueous phase, as opposed to the headspace. Overall, recoveries were observed to be greatly improved whenSBSE was combined with TFSPME for most compounds (Table 3).This was especially the case in direct immersion mode, whereinextraction was only a two-phase system as opposed to the three-phase system in headspace mode. When the twister bar was com-bined with the TFSPME device, there was reduced competition forattachment sites due to the near-doubling of absorption material;so recoveries across all the compounds were mostly greatly en-hanced compared to SBSE-only or TFSPME-only extractions. 4. Conclusion In this study, a new method combining SBSE and TFSPME wasdeveloped, optimized, and applied to both headspace and directimmersion extraction modes. For most compounds, the combinedextraction method resulted in the highest area response at all ex-traction temperatures and durations studied. The validation of thecombined method showed extended linearity range and enhancedsensitivity (steeper linearity slope) for the 40 selected compoundsstudied, indicating improved quantification capabilities. Satisfac-tory coefficient of determination (R2>0.980), good repeatability(intra-RSD <13.1 %) and reproducibility results (inter-RSD <13.4 %)were obtained for six different extraction modes for all the com-pounds. Recoveries were greatly improved in combined method,especially in direct immersion mode, with most compounds havingincrease recoveries of >20 %. Furthermore, this result may serveas a model for the study of various compounds covering differ-ent functional groups, chemical, and physical properties using sim-ple solventless methods. The comparison on the performance ofdifferent extraction methods under various conditions also pro-vides more insight on their suitabilities for different chemical tar-gets, which could be valuable in the development of effective andgreen extraction techniques in food, biological, and environmen-tal applications. The combined SBSE and TFSPME technique forboth headspace and immersion modes will be applied to varioustea samples (matcha, chinese green tea, and black tea etc.) in oursubsequent studies to provide insights on how tea processing andbrewing can affect the profile of the volatile compounds. Authors’contribution Miss Yunle Huang e0005261@u.nus.edu First author Conceptu-alisation, methodology, software, validation, formal analysis, inves-tigation, writing- original draft, writing - review and editing, vi-sualisation, project administration Dr. Christina Shu Min Liew christina_liew@gerstel.com Secondauthor Conceptualisation, methodology, validation, formal analysis,investigation, writing - original draft, writing - review and editing Dr. Shalene Xue Lin Goh shalene_goh@gerstel.com Third authorConceptualisation, methodology, validation, formal analysis, inves-tigation, writing - original draft, writing - review and editing Miss Rui Min Vivian Goh e0223100@u.nus.edu Methodology,writing - review and editing Miss Aileen Pua aileenpua@u.nus.edu Methodology, writing -review and editing Miss Kim Huey Ee ee.kim-huey@mane.com Methodology, writ-ing -review and editing Assoc. Prof Dr Shao Quan Liu fstlsq@nus.edu.sg Correspond-ing author Conceptualization, methodology, resources, supervision,project administration, funding acquisition, writing- review andediting Mr. Benjamin Lassabliere benjamin.lassabliere@mane.com Con-ceptualization, resources, supervision, project administration, fund-ing acquisition, writing - review and editing Dr. Bin Yu gsgpbiy@gmail.com Corresponding author Concep-tualization, methodology, formal analysis, resources, supervision,project administration, funding acquisition, writing - review andediting Declaration of Competing Interest The authors declare that they have no known competing finan-cial interests or personal relationships that could have appeared toinfluence the work reported in this paper. Acknowledgements The authors would like to thank Gerstel LLP and Mane SEA PTELTD for providing technical assistance, and technical assistance andfunding for this study respectively. Supplementary materials Supplementary material associated with this article can befound, in the online version, at doi:10.1016/j.chroma.2020.461617. References [1] F. David, P. Sandra, Stir bar sorptive extraction for trace analysis, J. Chromatogr.Dav200,4o ( [2] C . B icchi, C . I o ri, P. Ru b iol o , P. Sandr a , Headspace sor p ti v e extract i on (HSS E ), s tir bar sorpt iv e extra c t i on ( SBSE), a nd solid p hase m i croextraction (S P ME) ap- p lied t o t he analysis o f roasted A r abica co f fee an d c o f f ee bre w , J. A g r i c. F o o d Chem. 5 0 ( 2002)44 9 -45 9 . ) [3] E. Baltussen, C.A. Cramers, P.J. Sandra, Sorptive sample preparation - a review,Anal. Bioanal. Chem. 373 (2002) 3-22. [4] A. Prieto, O. Basauri, R. Rodil, A. Usobiaga, L.A. Fernandez, N. Etxebarria, O. Zu-loaga, Stir-bar sorptive extraction: a view on method optimisation, novel ap-plications, limitations and potential solutions, J. Chromatogr. A 1217 (2010)2642-2666. ( [5] C. G ra z ia n i , C . L o sasso, I. L u zzi , A. Ri c ci, G . S cavia, P. Pa s q uali, Sa l monella, in: C.E. R . Dodd, T . Al d sworth, R.A. S t ein, D .O. C liver, H.P. Riemann ( E ds.),F o od- b o rne Diseases, Academic P r ess, 2 007, p p. 1 33- 1 6 9. c h5. ) ( [ 6] N . O chia i , K . S asamoto, T. I e da, F . D a vi d , P . S a ndra ,M u l ti-s t ir ba r so r ptive ex- t r action for a n alysi s of odor compounds i n aqueous s am p les, J . Chrom a togr. A 1 315 ( 201 3 ) 7 0- 7 9. ) ( [ 7] G. Ouyan g , J . Pa w l isz yn, S P ME in e n v ironmenta l a n aly s is , A nal . B ioa n al . Chem. 386 (2006) 1 059- 1 073. ) [8]M.P. Elizalde-Gonzalez, E.J. Segura-Rivera, Volatile compounds in differentparts of the fruit Psidium guajava L. cv.“Media China” identified at distinctphenological stages using HS-SPME-GC-QTOF/MS, Phytochem. Anal. 29 (2018)649-660. ( [9] F. D avid, N . O c hiai, P . S andr a , T w o decades of stir ba r sor p tive extr a ction: a retrospective and future outlook, T rends Anal . Chem. 112 (2019) 102 - 1 11. ) ( [10] N . O chiai, K . S asamoto, H. Ka n da, E. P f a nnkoc h , Se q u e ntial stir b ar sor p tive e x- t r a ction for uniform e n r i chmen t o f t rac e a m o unts o f o rganic p o llutants i n w a- t e r samples,J. Chromatogr. A 1200 (2008) 72-7 9 . ) [11] N. Ochiai, K. Sasamoto, F. David, P. Sandra, Solvent-assisted stir bar sorptive ex-traction by using swollen polydimethylsiloxane for enhanced recovery of polarsolutes in aqueous samples: application to aroma compounds in beer and pes-ticides in wine, J. Chromatogr. A 1455 (2016)45-56. [12] A.H. Alluhayb, B.A. Logue, The analysis of aroma/flavor compounds in greentea using ice concentration linked with extractive stirrer, J. Chromatogr. A 1518(2017)8-14. [13]F.P Sanchez-Rojas, C. Bosch-Ojeda, J.M. Cano-Pavon, A review of stir bar sorptiveextraction, Chromatographia 69 (2008) 79-94. [14]R. Jiang, J. Xu, F. Zhu, T. Luan, F. Zeng, Y. Shen, G. Ouyang, Study of complexmatrix effect on solid phase microextraction for biological sample analysis, J.Chromatogr.A 1411 (2015) 34-40. [15] W. Wardencki, M. Michulec, J. Curylo, A review of theoretical and practical as-pects of solid-phase microextraction in food analysis, Int. J. Food Sci. 39 (2004)703-717. 161D.D. Roberts, P. Pollien, C. Milo, Solid-phase microextraction method develop-ment for headspace analysis of volatile flavor compounds, J.Agric. Food Chem.48 (2000)2430-2437. [17] C. Bicchi, S. Drigo, P. Rubiolo, Influence of fibre coating in headspacesolid-phase microextraction-gas chromatographic analysis of aromatic andmedicinal plants,J. Chromatogr. A 892 (2000) 469-485.S,J·Cn [18]I. Bruheim, X. Liu, J. Pawliszyn, Thin-film microextraction, Anal. Chem. 75(2003)1002-1010. [191R.V. Emmons, R. Tajali, E. Gionfriddo, Development, optimization and applica-tions of thin film solid phase microextraction (TF-SPME) devices for thermal desorption: a comprehensive review, J. Sep. Sci. 6(2019)39-60. [20]G. Jiang, M. Huang, Y. Cai, J. Lv, Z. Zhao, Progress of solid-phase microextractioncoatings and coating techniques, J. Chromatogr. Sci. 44 (2006) 324-332. [21S]. Wang, H. Xu, Inorganic-organic hybrid coating material for the online in-tube solid-phase microextraction of monohydroxy polycyclic aromatic hydro-carbons in urine, J. Sep. Sci. 39 (2016) 4610-4620. [22]RI.T. Marsili, C.R. Laskonis, Evaluation of sequential-SBSE and TF-SPME extrac-tion techniques prior to GC-TOFMS for the analysis of flavor volatiles in beer,J. Am. Soc. Brew Chem. 77 (2019) 113-118. [23]] Y. Zhu, H.-P. Lv, W.-D. Dai, L. Guo, J.-F. Tan, Y. Zhang, F.-L. Yu, C.-Y. Shao,Q.-H. Peng, Z. Lin, Separation of aroma components in Xihu Longjing tea us-ing simultaneous distillation extraction with comprehensive two-dimensionalgas chromatography-time-of-flight mass spectrometry, Sep. Purif. 164 (2016)146-154. [24] E. Gionfriddo, E.A. Souza-Silva, J. Pawliszyn, Headspace versus direct immer-sion solid phase microextraction in complex matrixes: investigation of an-alyte behavior in multicomponent mixtures, Anal. Chem. 87 (2015) 8448-8456. [25] Z. Triaux, H. Petitjean, E. Marchioni, D. Steyer, C. Marcic, Optimization by ex-pg6aerimental design of headspace sorptive extraction and solid-phase microex-traction for the determination of terpenes in spices, Food Anal. Methods 12(2019)2764-2776. [26]|J. Pawliszyn, Theory of extraction, in: J.Pawliszyn, H.L. Lord (Eds.), Handbookof Sample Preparation, 2011, pp. 1-24. ch1. [27] A. Prieto, O. Telleria, N. Etxebarria, L.A. Fernandez, A. Usobiaga,O. Zuloaga, Si-multaneous preconcentration of a wide variety of organic pollutants in wa-ter samples. Comparison of stir bar sorptive extraction and membrane-assistedsolvent extraction, J. Chromatogr. A 1214 (2008) 1-10. [28]F. Lestremau, V. Desauziers, J.L. Fanlo, Formation of artefacts during air anal-ysis of volatile amines by solid-phase micro extraction, Analyst 126 (2001)1969-1973. [29] F. Lestremau, F.A.T. Andersson, V. Desauziers, Investigation of artefact forma-tion during analysis of volatile sulphur compounds using solid phase microex-traction (SPME), Chromatographia 59 (2004)607-613. [30] Wells, G., Prest, H., & Russ, C. W. (2011b). Why use signal-to-noise as a mea-sure of MS performance when it is often meaningless? In, vol. 5990-8341EN:Agilent Technologies Technical Note. [31]A. Pua, H. Lau, S.Q. Liu, L.P. Tan, R.M.V. Goh, B. Lassabliere, K.-C. Leong, J. Sun,M. Cornuz, B. Yu, Improved detection of key odourants in Arabica coffee us-ing gas chromatography-olfactometry in combination with low energy elec-tron ionisation gas chromatography-quadrupole time-of-flight mass spectrom-etry, Food Chem. 302 (2020) 125370. [32]D .D Stockl, H. D'Hondt, L.M. Thienpont, Method validation across the disci-plines-critical investigation of major validation criteria and associated experi-mental protocols, J. Chromatogr. B Anal. Technol. Biomed. Life Sci. 877 (2009)2180-2190. [33] E. Rozet, R.D. Marini, E. Ziemons, B. Boulanger, P. Hubert, Advances in val-idation, risk and uncertainty assessment of bioanalytical methods, J. Pharm.Biomed. Anal. 55 (2011) 848-858. [34]S.M. Moosavi, S. Ghassabian, Linearity of Calibration Curves for AnalyticalMethods: A Review of Criteria for Assessment of Method Reliability, in: Cal-ibration and Validation of Analytical Methods - A Sampling of Current Ap-proaches, 2018, pp. 109-127. Ch6. https://doi.org/j.chroma. 薄膜固相微萃取TF-SPME是SPME的发明者开发的新萃取工具,是将薄膜萃取层附着在碳网层上实现的,可以用于顶空和浸入式萃取。其吸附层体积更大,并且对极性化合物有更好的萃取表现。有PDMS/DVB、PDMS/Carboxen、HLB/PDMS多种吸附材料。可以单独使用,或是于SBSE同时使用。TF-SPME-SBSE今天的应用,是哲斯泰新加坡子公司的应用工程师和新加坡香精香料公Mane SEA PTE LTD共同发表的,旨在通过对几种不同萃取技术对茶样品中40种的挥发性化合物的回收率的比较,找到最佳的萃取方式。最后发现,结合SBSE和TF-SPME可以大大提高灵敏度。 方法使用了聚二甲基硅氧烷(PDMS)涂层的SBSE和PDMS/CAR涂层的TF-SPME,研究了顶空和直接浸没萃取方式。与仅使用SBSE或仅使用TFSPME的技术相比,两者结合的方法对40种选定的挥发性化合物的线性范围更广,最低限度更低(2至3个数量级),令人满意的测定系数(R²>0.980),并提高了灵敏度。此外,尽管结合使用了两种萃取装置,但方法的重复性(<13.1%)和重现性(<13.4%)与仅使用SBSE或仅使用TFSPME的结果相当。下图是在直接浸入式的萃取模式下,仅仅使用TF-SPME(蓝色柱形)和使用TF-SPME及SBSE(红色柱形)对茶样品中部分挥发性化合物的回收率比较。所选化合物的回收率均提高一倍以上,β-蒎烯、2,3-二甲基吡嗪、异佛尔酮、水杨酸甲酯、橙花醇、β-大马酮、己酸、2-苯乙醇提高两倍;β-大马烯酮提高3倍;芳樟醇更是提高了4倍。此外,该萃取方法可作为简单的无溶剂方法来研究涵盖不同官能团,化学和物理性质的各种化合物,并建立模型。适用于开发食品、生物和环境应用。SBSE和TFSPME结合的顶空模式和浸入模式技术将在作者后续的研究中应用于各种茶样品(抹茶,中国绿茶和红茶等),以提供有关茶的加工和冲泡如何影响挥发性化合物的特性的见解。3月23号,我们的新加坡应用工程师Christina博士,将做关于此应用的网络研讨会。虽然是美国时间,不必担心,如果您对这个webinar感兴趣,告诉我们,我们有视频回放提供给您,让您不错过精彩内容。热脱附进样的多样性热脱附进样与液体进样,顶空进样一起构成了气相色谱的三种进样技术,热脱附技术较其他两种进样技术而言,灵敏度更高,这要归功于各类的萃取和富集技术,以及直接将样品放入脱附管加热的直接热萃取技术。大家看到一根热脱附管,可以放如此多的样品(见上图), 从而满足不同应用的需求。 哲斯泰的热脱附系列特有的玻璃热脱附管,惰性材料,对极性和卤代化合物无吸附作用,不会造成损失。样品和吸附材料显而易见,有助于提高实验结果的质量。哲斯泰整体解决方案对痕量物质进行无歧视的全面分析
关闭
-
1/16
-
2/16
GERSTEL(哲斯泰)为您提供《茶、茶汤中风味物质检测方案(热解吸仪)》,该方案主要用于茶叶中营养成分检测,参考标准《暂无》,《茶、茶汤中风味物质检测方案(热解吸仪)》用到的仪器有GERSTEL热脱附仪TD3.5+ (热解吸,热解析)、GERSTEL 搅拌棒Twister (萃取、固相微萃取)。
我要纠错


 咨询
咨询