

方案详情文
智能文字提取功能测试中
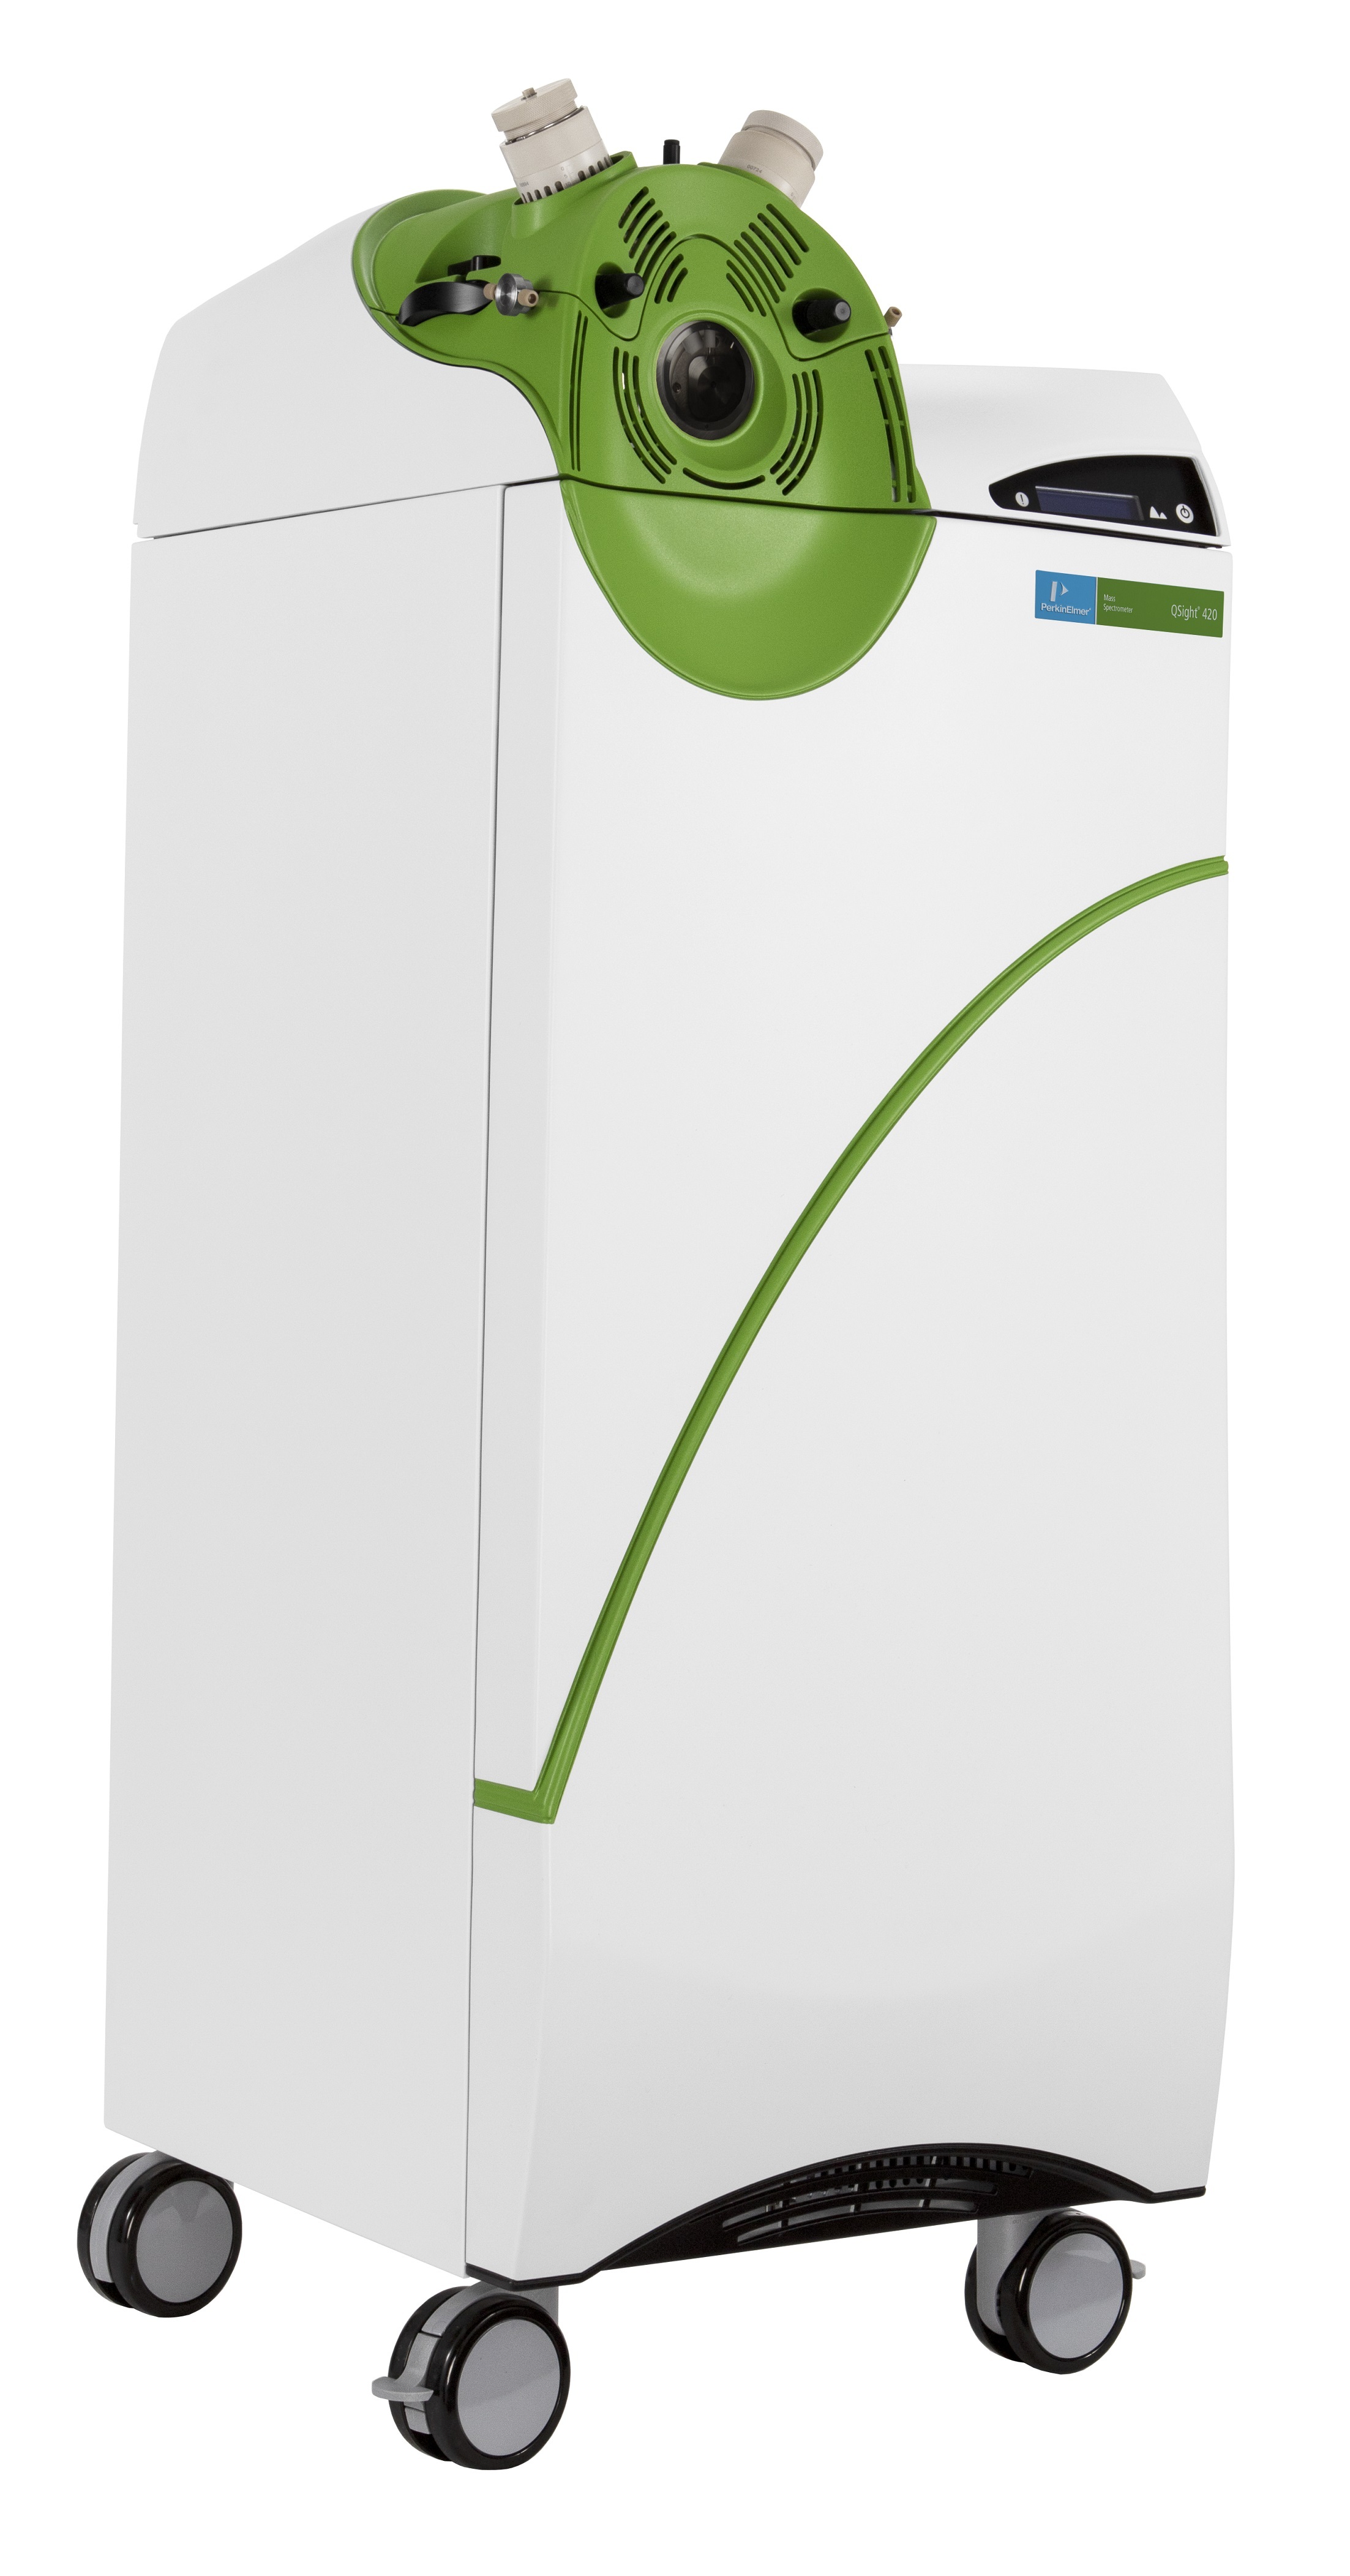
Copyright ◎2019, PerkinElmer, Inc. All rights reserved. PerkinElmer@ is a registered trademark of PerkinElmer, Inc. All other trademarks are the property of their respective owners.38774PKI APPLICATIONNOTE Liquid Chromatography/Mass Spectrometry Authors: Jingcun Wu Feng Qin PerkinElmer, Inc.Woodbridge, Ontario, Canada High Sensitivity Analysis ofEstrogens in Water and UrineWithout Derivatization by DirectInjection UHPLC/MS/MS Introduction Estrogens are importanthormones that are associatedwith the female reproductivesystem, and for maintenanceof female secondary sexualcharacteristics.1 However, numerous studies have found that the concentrations of endogenous estrogens and theirmetabolites in urine are related to the development and growth of breast cancer and tumors.Further, an increased risk of breast cancer has been reported in women with high urinaryestrogen levels, as well as in those exposed to increased estrogens over time as a result ofhormone replacement therapy.2-17 Studies have shown that the risk factors for breast cancer development in women may belinked to their diets, and that women who eat high fat diets have higher urinary estrogenlevels and a higher incidence of cancer, when compared to women with low fat diets.7-9 Soyconsumption can decrease urinary excretion of estrogens, and may have cancer-preventiveeffects by decreasing estrogen synthesis and altering endogenous estrogen metabolism.10-11 Although various analytical methods have been developed forthe determination of estrogens and their metabolites in urine,the most widely applied technique is LC/MS/MS, owing to itshigh sensitivity and selectivity. To improve analyte ionizationefficiency and enhance the method's sensitivity, derivatization ofanalytes during sample preparation has been used in many LC/MS/MS methods.4, 12-13 However, derivatization not only increasesthe sample preparation time and cost, but also introducesvariations in the method, which are not suitable for routineclinical laboratories. Thus, it is imperative to develop a rapid andsensitive LC/MS/MS method for analysis of estrogens in urinewithout derivatization. Endocrine disrupting compounds (EDCs) are chemicals that caninterfere directly with the endocrine system, either by interactionwith hormone receptors or by alteration of hormone synthesisor metabolism, and cause adverse effects on the growth andreproduction of animals. Of these EDCs, endogenous estrogens,such as estrone(E1), 17β-estradiol (E2), and estriol (E3) are of greatconcern, as they can enter the environment through the dischargeof treated and raw sewage, and can induce adverse health effectsto wildlife organisms, even at sub-nanogram to nanogram per literlevels. Recent evidence has shown that estrogens at low ng/L levelsare the main cause for the feminization of male fish in aquaticenvironments impacted by sewage.18-20 Naturally occurring estrogens (E1, E2 and E3) are regularly andconsistently released into the environment by the urine andexcrement of humans and animals. They have been detected insurface and waste waters at ng/L concentration levels, and traceamounts may be found in drinking water, even after extensiveremoval treatments. Owing to the very low detection limitsrequired and the complexity of sample matrix, complicated andtime-consuming extraction and purification processes, such asliquid-liquid extraction, solid phase extraction (SPE) and on-lineSPE are typically performed before final determination by LC/MS/MS, or other methods.21-24 US EPA Method 539 describesa process for the determination of hormones in drinking waterutilizing conventional SPE procedures.24 The aim of this study is to develop a fast and sensitive LC/MS/MSmethod for the analysis of estrogens in urine and water samples,without derivatization and SPE. Experimental Hardware/Software The chromatographic separation was conducted by aPerkinElmer QSight@LX50 ultra-high-performance liquidchromatography (UHPLC) system. MS detection was achievedutilizing a PerkinElmer QSight 420 triple quadrupole massspectrometer, with electrospray ionization (ESI) source undernegative ionization conditions. All instrument control, dataacquisition and data processing were performed using theSimplicity"3Q Software. Method Standard and Chemicals The following standards were obtained from Sigma-Aldrich:estrone (E1), 17β-estradiol (E2), and estriol (E3); and ammoniumfluoride (purity>99.9%). LC/MS grade methanol (MeOH),acetonitrile (ACN) and water were obtained from MilliporeSigma. The chemical structures of the three estrogenswere illustrated in a previous application note.25 A variety of drinking water and surface water samples wereanalyzed in this study: bottled drinking water purchased from alocal store (Woodbridge, Ontario), tap water obtained from twodifferent cities in Ontario (Toronto and Kitchener), rain watercollected from Kitchener, Ontario, river water samples from theHumber River, Toronto, Canada, and lake water samples fromLake Ontario, Canada. Human urine samples were collected anddonated by two healthy volunteers (one female, and one male). Standard Preparation Individual primary standard stock solutions (1mg/mL) wereprepared by weighing accurately 10 mg of each standard,and subsequently dissolving each in 10 mL of methanol. Amixed standard stock solution containing 10 pg/mL of eachanalyte was prepared in methanol by dilution of the primarystandard solutions. Several working solutions with various lowconcentrations (10, 100, 1000, and 10,000 ng/L) were preparedby diluting the mixed stock solution with a 50:50 methanol/water diluent. Calibration standards with concentrations of0, 1, 2.5, 5, 10,50,100, 300,500, 1000 and 2000 ng/L wereprepared by diluting the corresponding working solutions with a30:70 methanol/water diluent. Sample Preparation The various water samples were prepared by extraction withmethanol (with water/methanol ratio of 7:3) and vertex mixingfor one minute, with analysis performed directly thereafter,without further treatment. The two urine samples were firstextracted by methanol (urine/methanol ratio of 7:3), and thenchilled in a refrigerator for 30 minutes to promote proteinprecipitation. The supernatants were then analyzed directly,without further treatment. Quality Control Sample Preparation Avoiding contamination of the samples during sample collection,sample preparation and sample analysis are all crucial for reliablesample analysis. To test for possible interference or contaminationfrom reagents and glassware,or from the sample preparationprocesses itself, a laboratory reagent blank (LRB) was prepared.The values of LRB should be close to zero, or at least less thanthe limit of quantification (LOQ) of the method. If the LRB valueis above the LOQ, an investigation into the source ofcontamination must be carried out. An LRB sample was preparedfor this study by following the same procedures as for a watersample preparation, using the 30:70 methanol/LC/MS gradewater as the sample matrix. To identify possible analyte loss or contamination during samplepreparation, a laboratory fortified blank (LFB) sample wasprepared by following the same water sample preparationprocedures, using a 30:70 methanol/water solution as thesample matrix, spiked with a known amount of analyte solution.During method validation, LFB samples were prepared by spikingthe analyte at three different concentration levels (5, 10, and100 ng/L, respectively). To evaluate sample matrix effects and analyte recovery from thelake water sample matrix, a laboratory fortified matrix sample (LFM) was prepared by following the same water samplepreparation procedures, using a lake water sample spiked with aknown amount of analyte. The percent recovery is calculated bycomparing the difference of the spiked (LFM sample) and non-spiked sample results with the expected (spiked) value. Duringmethod validation, the LFM samples were prepared at threedifferent analyte concentrations (5, 10, and 100 ng/L, respectively). LC Conditions and MS Parameters The LC method and MS source parameters are shown in Table 1.A C18 column (Bownlee, SPP C18, 50x 3 mm, 2.7 um) wasused to separate estrogens and any interfering components. Theapplied LC gradient program is shown in Table 2. MS sourceparameters including gas flows, temperature and probe positionsettings, were optimized for maximum sensitivity. Compound-dependent parameters such as collision energies (CE), entrancevoltages (EV), and lens voltages (CCL2) were optimized, and areshown in Table 3. Results and DiscussionMethod Development and Optimization For mass detection of estrogens, both positive and negativeelectrospray ionization (ESI) modes were evaluated initially. Theresults showed that all analytes in the study demonstrated bettersensitivity and signal to noise ratio under negative ionization Table 1. LC Method and MS Source Conditions. LC Conditions Analytical Column Bownlee, SPP C18, 50x3 mm, 2.7 pm (PN: N9308408) Mobile Phase A 0.2 mM ammonium fluoride in water Mobile Phase B LC/MS grade methanol Mobile Phase Gradient Flow Rate 0.6 mL/min Column Oven Temperature Auto Sampler Temperature 10°℃ Injection Volume 50 uL Needle Wash 1 30% methanol in water Methanol Needle Wash 2 ESI Voltage (Negative) Drying Gas Nebulizer Gas Source Temperature 400°C HSID Temperature Detection Mode Table 2. LC Gradient Program. Time (min) Mobile Mobile Phase A (%) Phase B (%) 0.0 70 30 8.0 0 100 9.0 0 100 9.1 70 30 12.0 70 30 mode. Similar results were also obtained in previous studies.26-27Therefore, negative ESl detection was used in this study. According to the regulatory guidance on analytical methodvalidation, at least two MS/MS transitions should be used in amethod.28 In this study, three MS/MS transitions were evaluated.Tables 1 and 3 present the optimized parameters for the ionsource and compounds. To improve analyte ionization efficiency and to enhance themethod's sensitivity, other studies have utilized ammoniumhydroxide with concentrations from 0.01% to 0.1% in mobilephases.26-27 However, an LC column that can work robustly atthe high pH range is required. In other recent studies,ammonium fluoride has been increasingly used as a mobilephase additive to enhance ionization of some analytes, includingsteroid-like molecules.29 Compared to ammonium hydroxide, theadvantages of using ammonium fluoride include better analyteresponses, and no need for a high pH tolerant LC column. Inthis work, the effect of ammonium fluoride concentrations (suchas 0.05, 0.10, 0.15, 0.20, 0.30, and 0.40 mM) on the estrogenresponse in aqueous mobile phase A was studied. As shown inFigure 1, all analytes showed the highest responses at around0.20 mM, therefore, 0.2 mM of ammonium fluoride was used inmobile phase A. Table 3. Retention Time (RT), Optimized MRM Transitions and Parameters. Analyte RT(min) MRMTransition CE EV CCL2 269.3/145.1 50 -77 112 Estrone (E1) 4.84 269.3/143.1 76 -77 112 269.3/159.1 48 -77 112 271.4/145.1 52 -65 150 Estradiol (E2) 4.85 271.4/143.1 76 -65 150 271.4/183.2 50 -65 150 2.90 287.1/171.1 47 -65 160 Estriol (E3) 287.1/145.1 54 -65 160 287.1/143.1 69 -65 160 Figure 1. The effects of ammonium fluoride concentration in mobile phase (MP) Aon analytes responses. Methanol and acetonitrile were also compared in terms ofsensitivity and separation of the target analytes when used asorganic mobile phase B. As shown in Figure 2, higher responseswere obtained for all three analytes with methanol as mobilephase, while better separation of E1 and E2 were achieved usingacetonitrile, as illustrated in Figure 3. As E1 and E2 can beseparated and determined by mass spectrometer, and thesensitivity is more important for this method, methanol wasselected as mobile phase B. In addition, methanol is typically lessexpensive than acetonitrile, making it a more economical choice,especially for a high throughput routine testing laboratoryanalyzing many samples. Linearity, Limit of Detection (LOD) and Limit ofQuantification (LOQ) Method linearity was studied by external calibration method.Excellent linearity was obtained from 1 to 2000 ng/L (ppt) foreach analyte, with regression coefficients (R) greater than 0.99,as shown in Figure 4. The limit of detection (LOD) and limit ofquantification (LOQ) were estimated based on the signal to noiseratio (S/N ≥3 for LOD and S/N ≥ 10 for LOQ) of the analyte’squantifier ion. The estimated LOD for E1 is 0.2 ng/L, and0.5 ng/L for both E2 and E3. The estimated LOQs are0.5 ng/L for E1, and 1.0 ng/L for E2 and E3. Contamination, Analyte Recovery, Sample Matrix Effectsand Carryover Effect Small contamination peaks were found during the initial LRBstudy for analytes E2 and E3, likely a result of the glassware,including the autosampler vials. After thoroughly cleaning theglassware with acetone, LC/MS grade methanol and water,the contamination peaks were eliminated from the LRB sample.As shown in Table 4, good recoveries were obtained for theLFB samples, indicating no analyte loss or contaminationduring sample preparations. Instrument repeatability or precision was assessed based onreplicate analyses of a low-level standard (5 ng/L, 7 replicates).The precision was then calculated based on the coefficient ofvariation (RSD%) of the results. The RSDs for the standard werecalculated at 4.6% for E1, 12.8% for E2, and 5.7% for E3. For water sample analysis, method accuracy was evaluated by therecovery of a known amount of analyte spiked into a lake watersample (LFM samples). As shown in Table 4, the recovery ofanalytes from the spiked samples were between 75% and115%, except for E2 in sample LFM1, demonstrating goodoverall accuracy of the method. The lower recovery for E2 at lowconcentration levels may be caused by an ion suppression matrixeffect. Therefore, it is recommended to include stable isotopelabeled internal standards in the method to compensate for thesample matrix effects, and to improve the accuracy of the method. The carryover effect was investigated by injecting the highestconcentration calibration standard (2000 ng/L, in this study),followed by a blank water sample injection. The resultsdemonstrated that the carryover effect is less than the LOQof the method. Figure 2. The effects of methanol (MeOH) and acetonitrile (ACN) as mobile phase(MP) B on analytes responses. Figure 3. MRM Chromatograms ofE1, E2 and E3 obtained using methanol(MeOH)and acetonitrile (ACN) as mobile phase (MP) B. Standard Curve:"Concentration vs Area" Figure 4. Calibration curves for E1, E2, and E3 with concentrations from 1 to 2000 ng/L (ppt). Table 4. The Spiked E1, E2 E3 amounts in QC Samples and the Recovery Results. Sample ID Spiked (ng/L) Measured (ng/L) Recovery (%) E1 E2 E3 E1 E2 E3 E1 E2 E3 LRB 0 0 0 0 0 0 LFB1 5 5 5 4.9 5.4 4.9 97.5 107 98.2 LFB2 10 10 10 10.1 9.1 8.7 101 91.5 87.1 LFB3 100 100 100 91.9 97.7 94.8 91.9 97.7 94.8 LFM1 5 5 5 5.2 2.3 5.4 104 45.1 109 LFM2 10 10 10 11.5 7.5 9.2 115 75.0 92.0 LFM3 100 100 100 101 94.4 106 101 94.4 106 Sample Analysis The developed LC/MS/MS method was applied for the analysis ofestrogens in fourteen water samples including drinking water,rain water, river water and lake water samples. For the fivedrinking water samples (including a bottled water sample andfour tap water samples collected from different sources), as wellas the rain water sample collected from Kitchener Ontario, noanalytes were found above the LOQ of the method. However,7.7 ng/L of E2 was detected in one of the river water samplescollected from the Humber River (Toronto, Ontario). Eight lake water samples from four different lakeshore areas ofLake Ontario in Toronto were collected and analyzed. Four of thelake samples were collected prior to a heavy rain storm, and theremaining four samples were collected immediately following therain storm. The analysis of the four samples collected before thestorm resulted in no target analytes detected. However, as shownin Table 5, trace amounts of E1 were detected from each of thesamples collected immediately after the storm, when themunicipal health office of Toronto issued a warning for high E.Coli levels in waters around the lakeshore areas of Lake Ontario.These results indicate that before entering wastewater treatmentplants, human and animal waste may have been flushed into thelake by the heavy rain fall. In addition, high levels of E. Coli inwater can help transform conjugated estrogens to their free formanalytes, which can be detected by the method. The identity of the analytes in these samples can be confirmed bycomparing the analyte retention time and the ion ratios of thequalifier ion against the quantifier ion in the samples with thosein the reference standards. As shown in Figure 5, the ion ratios of the qualifier ion against the quantifier ion in the S2 lake samplefor E1, and the river sample for E2, are consistent with thoseobtained from reference standards (0.35 for E1 and 0.56 for E2),confirming the existence of the analytes in these water samples. As endogenous estrogens are mainly excreted as glucuronideconjugates and small amounts of sulfate conjugates, and thecontent of free estrogens in urine is typically less than 10% (atlow ng/L level), most of the previous urine sample analysis studieshave been focused on measuring the total amount of estrogensafter hydrolysis by either an enzymatic or acidic method.12-13 A fewstudies were also reported for the analysis of conjugated estrogensin urine after SPE clean-up and enrichment,15-16 but no report wasfound for direct determination of free form estrogens in urinesamples, possibly due to the limited sensitivity of these methods,even with SPE. For the first time, a simple dilute-and-shoot method has beendeveloped in this study for the analysis of free estrogens inurine, without sample hydrolysis, derivatization and SPEtreatments. As shown in Table 5, significantly higher levelsof E1 were determined from a female urine sample as comparedto that of a male sample, and a small amount of E2 was alsofound in the female urine. E3 values were not analyzed (NA) ineither urine sample, owing to interfering peaks on the secondtransitions.As shown in Figure 6, the ion ratios of the qualifierion against the quantifier ion in the female urine sample forboth E1 and E2 are consistent with those obtained fromreference standards (0.35 for E1 and 0.56 for E2), confirmingthe identity of the analytes in the sample. Analyte River S Lake S1 Lake S2 Lake S3 Lake S4 Urine-F Urine-M E1
-
1/7
-
2/7

还剩5页未读,是否继续阅读?
继续免费阅读全文产品配置单
珀金埃尔默企业管理(上海)有限公司为您提供《水和尿液中雌激素检测方案(液质联用仪)》,该方案主要用于环境水(除海水)中有机污染物检测,参考标准《暂无》,《水和尿液中雌激素检测方案(液质联用仪)》用到的仪器有三重四极杆液质联用仪QSight 400 。
我要纠错
相关方案
 咨询
咨询