方案详情文
智能文字提取功能测试中
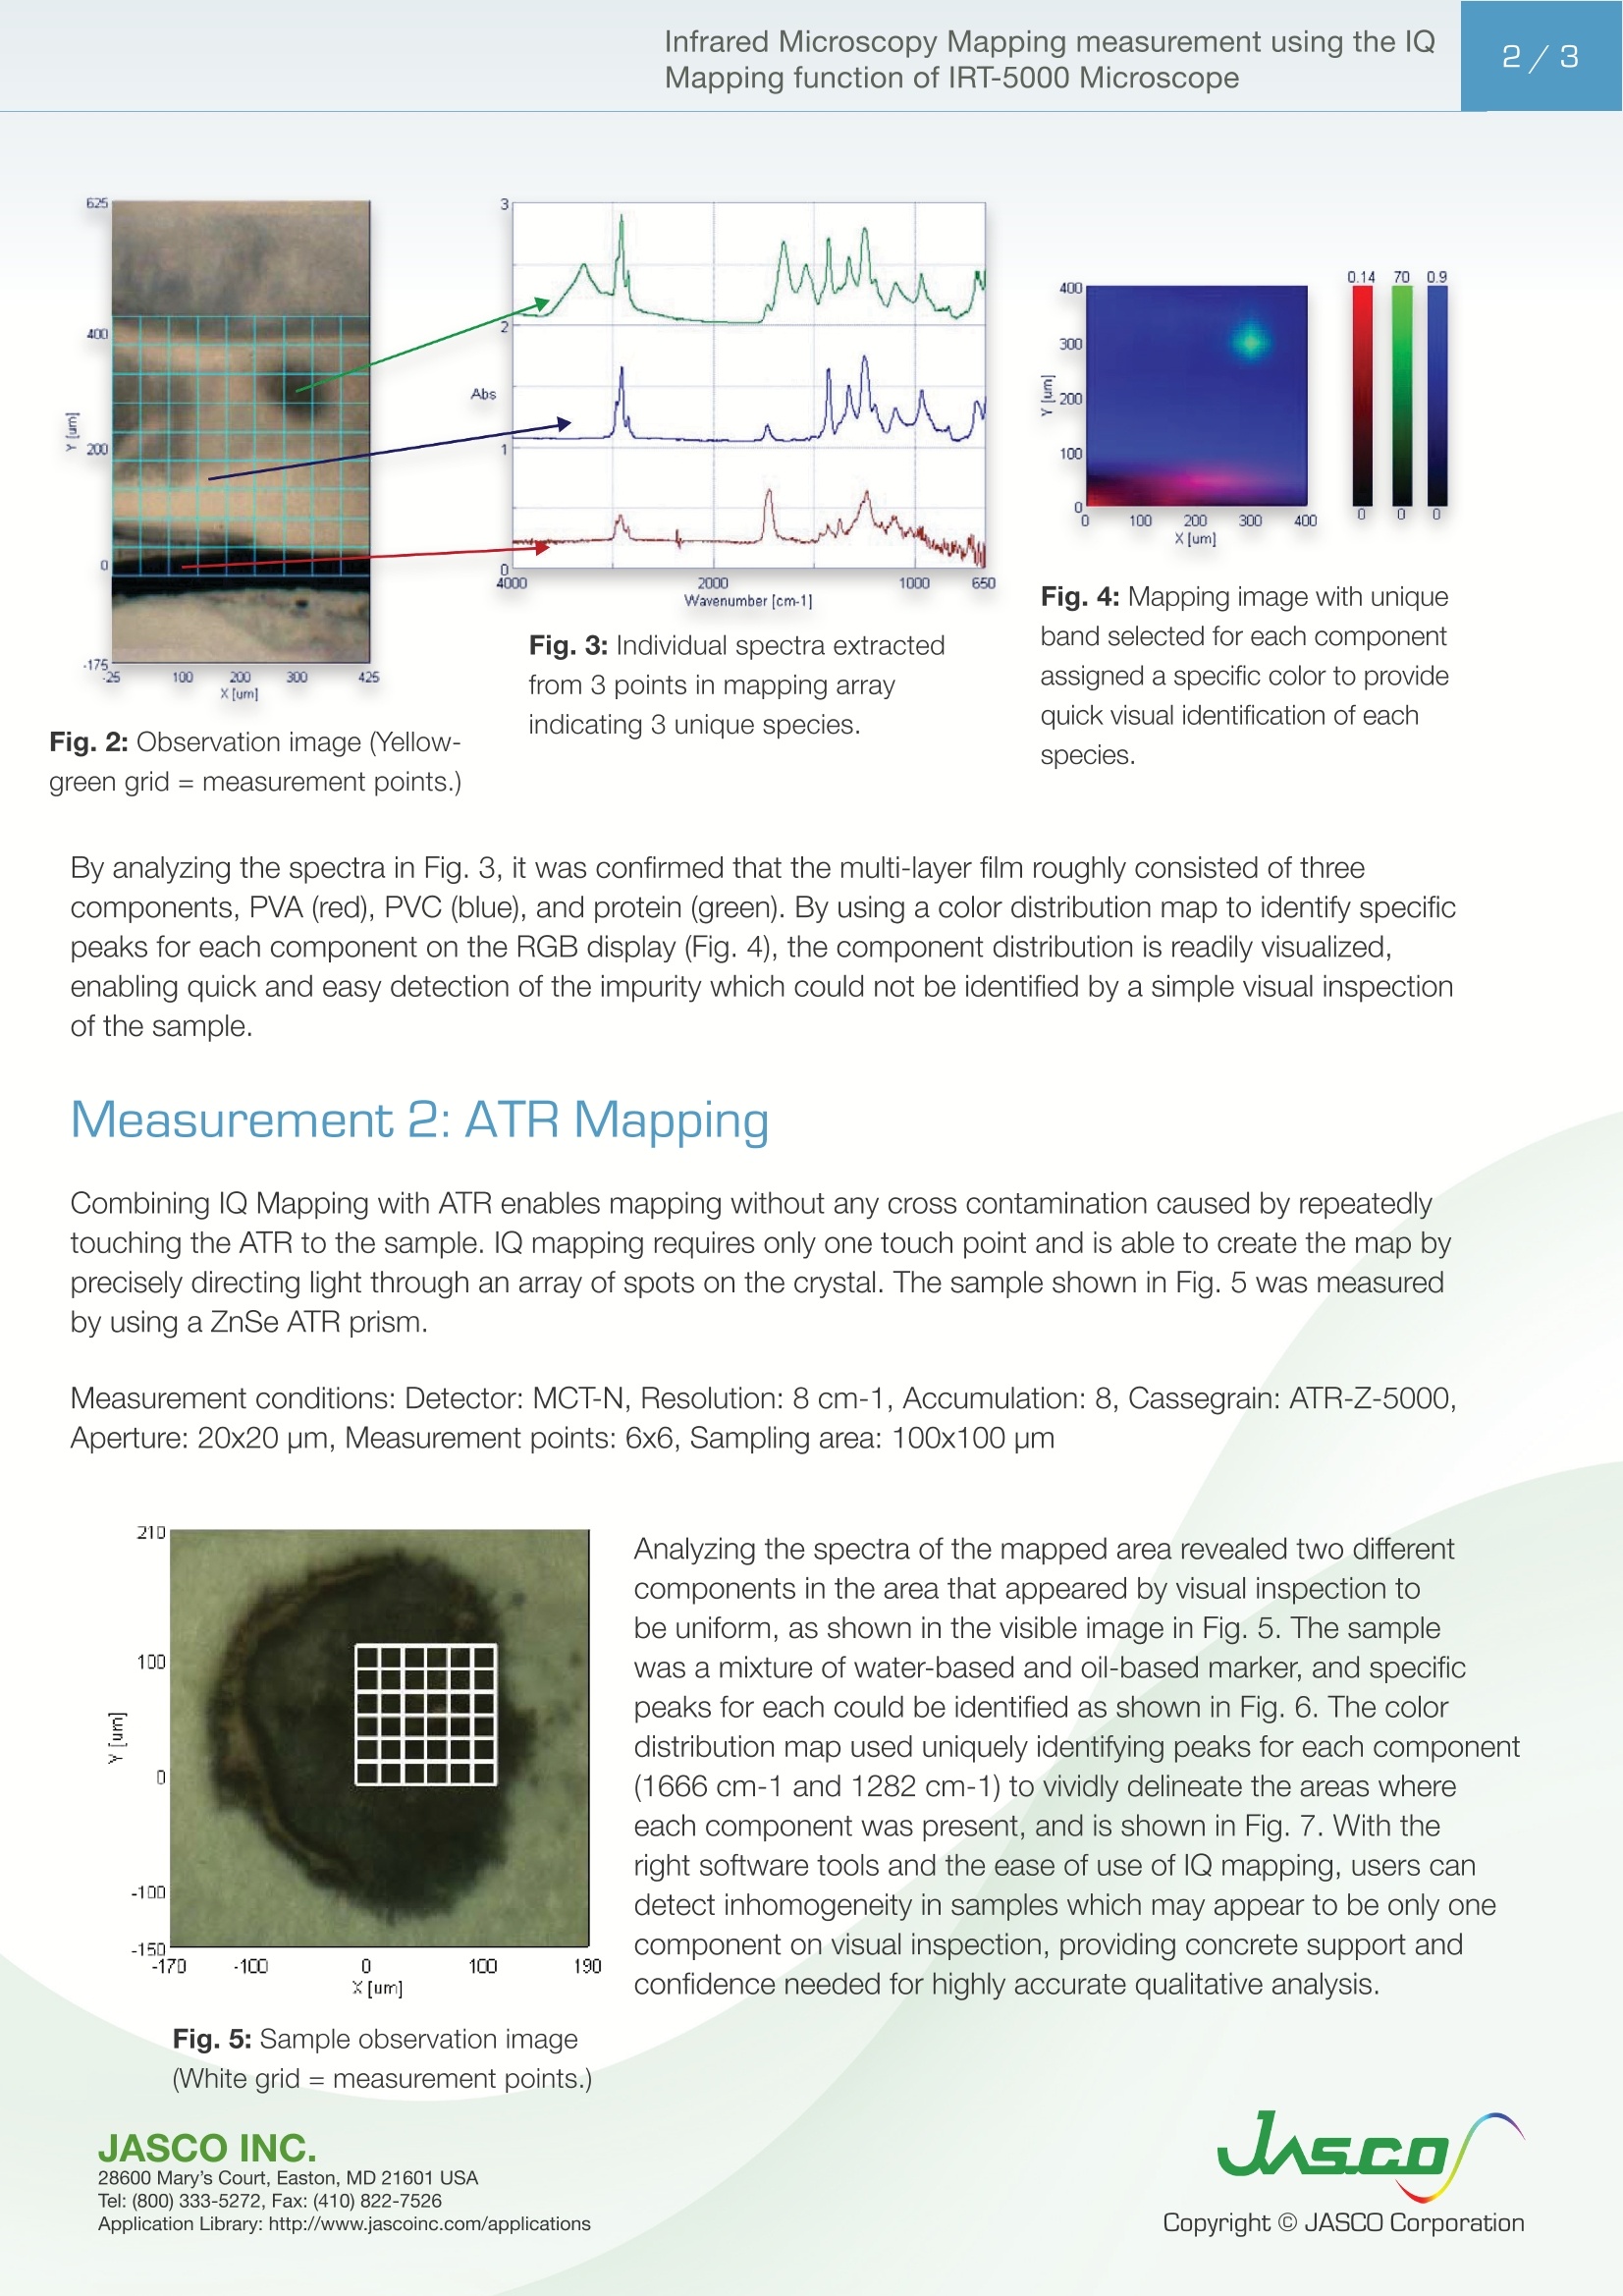
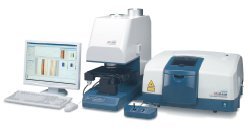
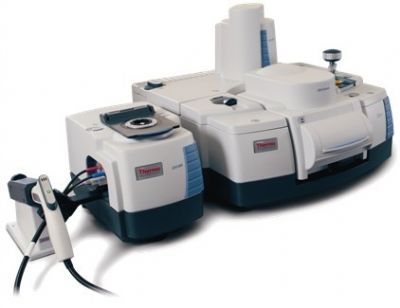
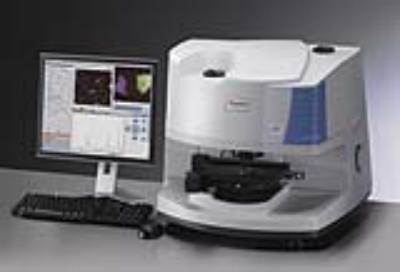
FTIR显微镜图谱实验可以可视化整个表面的分子结构,这是许多领域所高度期望的,然而,它并没有被广泛应用,因为:需要一个自动操作台,这可能会使仪器过于昂贵。数据收集可能需要较长的时间,这取决于映射区域的大小,从而减慢结果并占用仪器时间。与传统系统相比,使用多元件(阵列)探测器将测量时间缩短了一个数量级,并使IR映射成为一种更可行和更受欢迎的技术。然而,自动化操作台可能成本高昂,因此我们开发了功能强大的IQ Mapping,为仍然需要从绘制区域图中提取详细化学信息的有限预算提供了一种负担得起的替代方案。IQ Mapping是一种适用于ATR、透射率和反射率的技术,可以通过在表面上精确控制光栅化IR光,使用手动平台绘制区域。以下是使用IRT-5000的IQ映射进行杂质分析的示例(图1)测量2:ATR映射Infrared Microscopy Mapping measurement using the IQMapping function of IRT-5000 Microscope2/3 Application Note Infrared Microscopy Mapping measurement usingthe IQ Mapping function of IRT-5000 Microscope FTIR microscopy mapping experiments, which can visualize molecular struc t ure across a surface, is highly desired by many fields, however , it has not been widely applicable because: An auto stage is required, which can make the instrumen t too expensive. Data col l ection can take extended t ime , depending on the size of the mapped area , slowing res u lts and monopolizing instrument t i me. Fig. 1 F T /IR-4100 +IRT -5000 Using a multi-el e ment (array) detector has shortened the m easurement t i me by an order of magnitude in compar i son with conventional systems an d made IR mapping a more feasible and favored technique. Automated stages can be costly, however, so we have developed the powerfu l IQ Mapping to provide an affordable alternative for more l imited budgets that st i l l requ i re the detailed chemical i nformation extracted from mapping an area. IQ Mapping is a techniq u e that that applies to ATR, transmittance, and reflectance that can map an area using a manual stage by precisely controlled rastering IR l ight across a surface. Below is an example of impurity analysis using IQ Mapping of the IRT-5000 (Fig . 1). 28600 Ma r y's Court, Easton, MD 21601 USA Fig. 3: I n div i dua l spectra ext r a c ted from 3 points in m app i ng array i n dicat i ng 3 u nique species. Fig. 2: Obs e rvation i mage (Ye ll ow-green grid = m e a surement point s .) Fig . 4: Mapping image with unique band selected for each componen assigned a specific color to provide quick visual identi f ication of each sp ec ies. By analyzing the spectra i n Fig. 3, it was confirmed that the multi -l ayer film roughly consisted of three components, PVA (red), PVC (blue), and protein (green). By using a color distribution map to identify specific peaks for each component on the RGB display (F i g.4), the component distr i bution is readily visualized,enabling quick and easy detection of t he impurity which could not be identif i ed by a si m ple visual inspection of the sample . Measurement 2: ATR Map pi ng Combining IQ Mapping with ATR enables mapping without any cross contamination caused by repeatedly touching t he ATR to the sample. IQ mapping req u ires only one touch point and is able to create t he map by precisel y directing l i gh t through an array o f spots on the crystal . The sample shown in Fig. 5 was measured by using a ZnSe ATR prism. Measurement conditions: Detector: MC T-N, Resolution: 8 cm-1, Accumulation: 8, Cassegrain: ATR-Z-5000,Aperture: 20x20 pm, Measurement points: 6x6, Sampling area: 100x100 pm Fi g . 5: Sampl e obs e rvation i mage (White grid = measurement poi n t s .) Analyzing the spectra of the mapped area revealed two different components i n the area that appeared by visual inspection to be uniform, as shown i n the visible image i n Fig. 5. The sample was a m ixture of water -based and oil -based marke r , and specific peaks for each could be identified as shown in Fig. 6. The col o r distribution map used unique l y identifying peaks for each component (1666 cm-1 and 1282 cm-1) to vividly delineate the areas where each component was present, and is shown in Fig. 7. With the right software tools and the ease of use of lQ mapping, users can detect inhomogeneity i n samples which may appear to be only one component on visual i nspection, providing concrete support and confidence needed for highly accurate q u alitative analysis. Fig. 6: Measured spectra of impuri t y Fig. 7: Color distr i bu ti on map o f measured area using red and green to u n ique l y ident if y the
关闭-
1/3
-
2/3
还剩1页未读,是否继续阅读?
继续免费阅读全文产品配置单
佳士科商贸有限公司为您提供《带IQ映射的IRT-5000 FTIR显微镜》,该方案主要用于其他中IQ映射检测,参考标准《暂无》,《带IQ映射的IRT-5000 FTIR显微镜》用到的仪器有jasco红外显微镜(IRT-5200)、JASCO傅立叶变换红外光谱仪FT/IR-6000、JASCO红外显微镜IRT-7200。
我要纠错
推荐专场
其它光谱仪
更多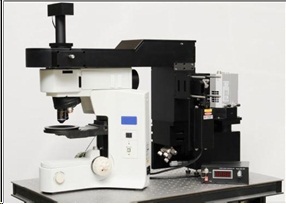
相关方案
 咨询
咨询