方案详情文
智能文字提取功能测试中
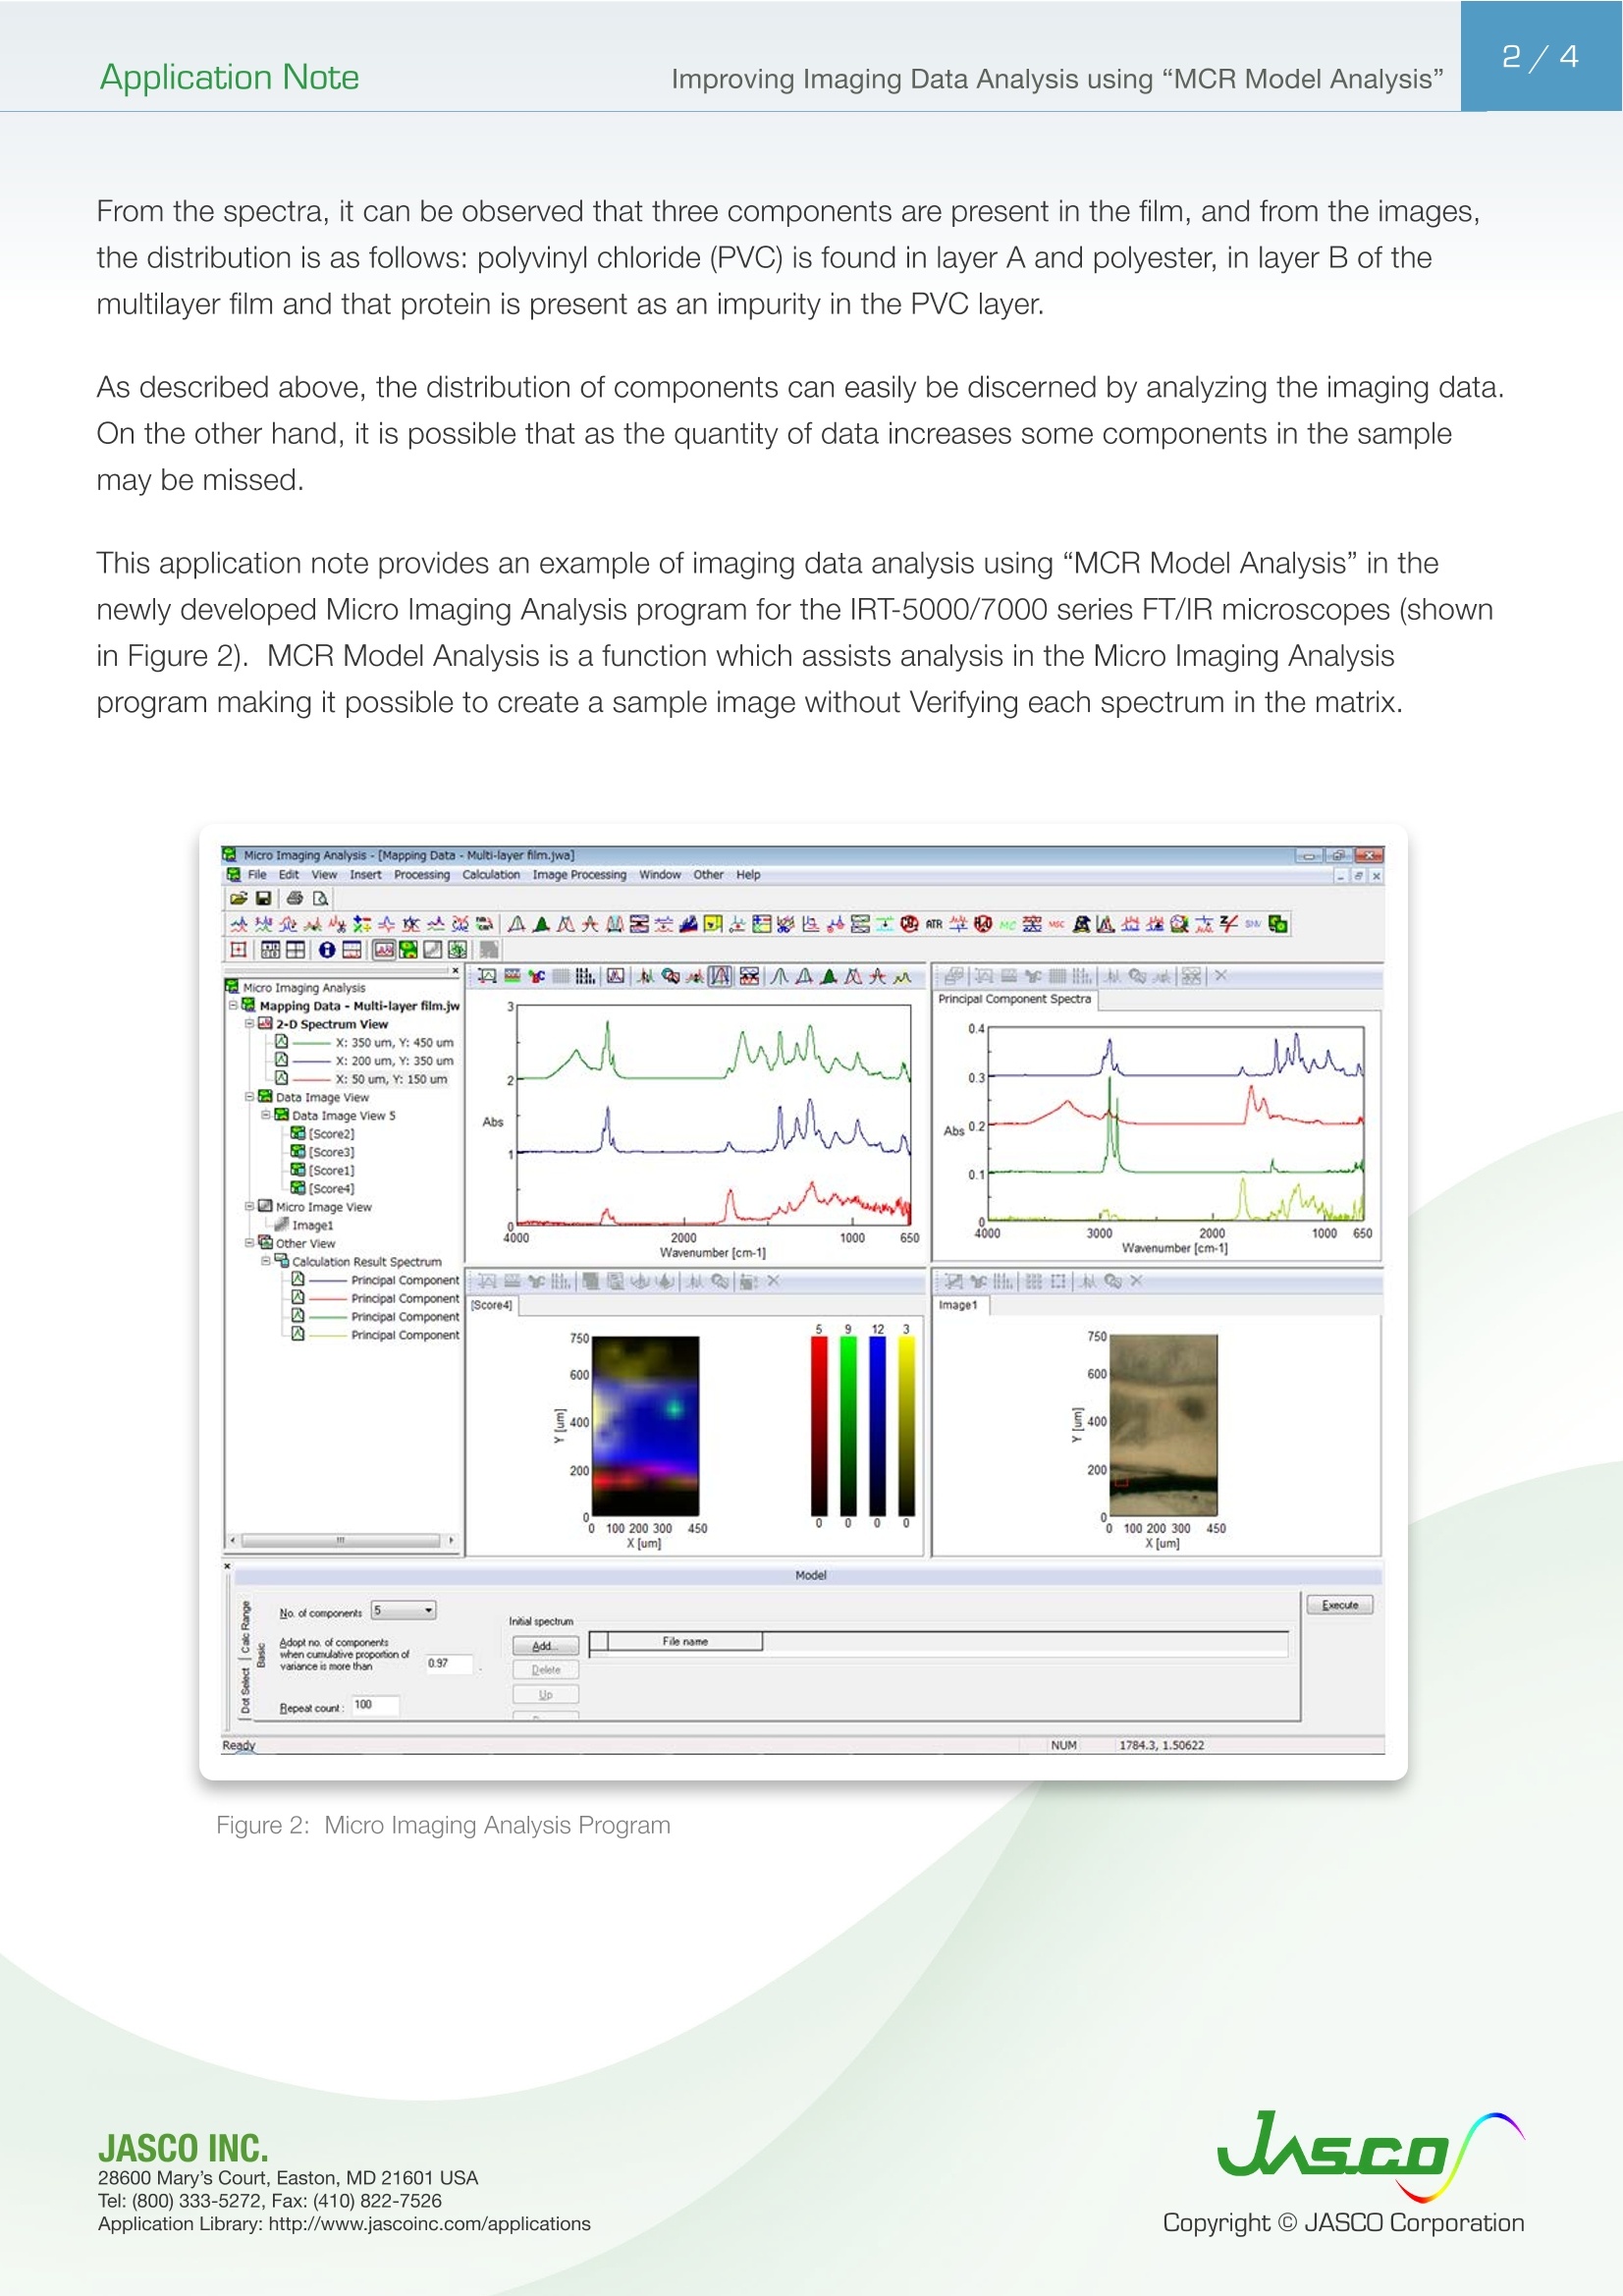
使用FT-IR显微镜的成像测量被广泛用于观察样品基质中成分的分布。近年来,由于使用多通道探测器和红外显微镜的高速成像技术的快速发展,成像方法的多样性增加了。因此,可以根据应用选择适当的成像方法。分析来自成像测量的大量数据可能需要大量的时间和特殊技能。例如,图1显示了多层膜的成像分析结果。可以看出,已经选择了每个分量的光谱,并且关键峰的强度分布显示为彩色编码图像。从光谱中可以观察到,膜中存在三种成分,从图像中可以看出,分布如下:聚氯乙烯(PVC)存在于多层膜的层A和聚酯的层B中,蛋白质作为杂质存在于PVC层中。如上所述,可以通过分析成像数据来容易地辨别成分的分布。另一方面,随着数据量的增加,样本中的一些成分可能会丢失。本应用说明提供了IRT-5000/7000系列FT/IR显微镜新开发的微成像分析程序中使用“MCR模型分析”进行成像数据分析的示例(如图2所示)。MCR模型分析是微成像分析程序中的一个辅助分析功能,它可以在不验证矩阵中每个光谱的情况下创建样本图像。模拟分析法:MCR模型分析通过从测量光谱中自动提取主要成分来创建相对浓度分布。因此,可以在很短的时间内获得成像图,而不会有忽略样品中包含的任何成分的风险。还可以通过对照光谱数据库搜索主要成分的光谱来识别成分。MCR模型分析结果:如上所述,MCR模型分析使得可以在不选择光谱的情况下获得所有包含的主要成分的成像图,这改进了数据库搜索的结果。Application Note 2/4Application NoteImproving Imaging Data Analysis using“MCR Model Analysis” Imaging measurements using FT -IR m icroscopy is wid e ly used to visualize th e distribution of components in a sample mat r ix. In recent years,the variet y of imaging methods has increased due to the rapid development of h i gh-speed imaging techniques usi n g mul ti -channel detectors and IR microscopes . Therefore, it has become poss i ble to select an appropriate i maging method accordin g to the app l ication. Analysis of the enormous amounts of data from imaging measurement can require significant t ime and special skills. For example ,Figure 1 displays the imaging analysis results for a mu l tilayer film. It can be seen that the spectrum for each component has been selected and the intensity distribution of the key peaks are shown as the co l or-cod e d i m age. Keyword : FT I R, FTIR microscopy, FT IR imaging Chemical imaging, I nfrared i maging, Principal component analysis, IRT-5100, IRT-7100,IRT-7200Impur i ty profiling, Polyester, Polyethylene,Protein, PVC polyvinyl chloride, Multi-component Regression 28600 Mary's Court, E a ston, MD 21601 USA From the spectra, it can be observed that three components are present in the film, and f rom the images,the distr i but i on is as follows: polyvinyl chloride (PVC) is found i n layer A and polyester, in layer B of the mult i layer f ilm and that protein is present as an impurity in the PVC layer . As described above, t he distribution of components can easily be discerned by analyzing the ima g ing data.On the ot h er hand, it is possible that as th e quantity of data increases some components in the sample may be missed. This appl i cation note provides an example of imaging data analysis usi n g“MCR Model Anal y sis ” i n the newl y developed Micro Imaging Analys i s program for the IRT -5000/7000 series FT/IR microscopes (shown in F i gure 2). MCR Model Analysis is a f unction which assists analys i s in the Micro Imaging Analysis program making i t possible to create a sample image without Verifying each spectrum in the matrix. F i gure 2: Micro Imaging Analysis P rogram Model Analysis MCR Model Analysis creates a re l ative concentration distribution by extracting the principal components automatically from the measured spectra. Therefore, t he i m aging plot can be obtained i n a very short t i me without risk o f neglect i ng any components contained in t he sample. I t is also possible to identify the components by searching the spectra of the principa l components aga i nst a spectral database. F ig ure 1: Im ag ing analysis resu lt of a mul t ilayer film with key peaks l abeled MCR Model Analysis Results Fi g ure 3 shows the imaging analysis result of a multilaye r f ilm using the MCR Model Anal y sis software.Compar i ng the data in Figure 1 with the data in Figure 3, two differences can be observed. The f irst is that the spectrum of the fourth component was contained in the spectrum of another pr i mary component .It indic a tes that a component possibly i gnored by I maging Analys i s using key bands can be accurately analyzed by using MCR Model Analysis. T he second is the difference in the impurity spectra. The pure spectrum o f the protein as an impurity can be obtained using MCR Model Analysis, while the overlapped spec t ra of protein and PVC i n the mul t ilayer were obtained as the measured spectrum by the method using key bands. The spectrum of the pure component improves t h e accuracy for searching databases and facilitates the identification of the components. Fi g ure 4 illustrates the database search result of the principal components. Polyethylene was found as a principal component which was neglected by the I maging analysis using key peaks. As described above, the MCR Model Analysis makes it possible to obtain an imaging plot of all contained principal components without selecting a spectrum, which improves the results of database searches . Principal spectrum A J J P Principal spectrum B Principal spectrum C Princ i p al sp ec t r um D 4000 2000 1000 650 Wavenumber [cm-1] Principal components spectra (Off-set) Red :Polyester, Yellow: Polyethylene) F i gure 3: Imaging a n a l ysis r esul t of mu l t i layer f i lm with“MCR Model analys i s” Figure 4: Database search resul t of pr i nc i pal compone n ts spec t ra System configuration P/N: 7084-J002A P/N: 7081-J051A FT/IR-4600 FT/IR Spectrometer IRT-5200-16 Infrared Microscope Micro Imaging Analysis Program (Sta n dard for IRT-5200/7100/7200)
关闭-
1/4

-
2/4
还剩2页未读,是否继续阅读?
继续免费阅读全文产品配置单
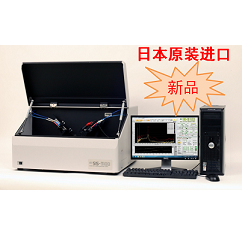
佳士科商贸有限公司为您提供《FTIR成像显微镜的MCR化学计量建模》,该方案主要用于其他中MCR化学计量建模检测,参考标准《暂无》,《FTIR成像显微镜的MCR化学计量建模》用到的仪器有JASCO FTIR-4000傅立叶变换红外光谱仪、jasco红外显微镜(IRT-5200)。
我要纠错
推荐专场
红外光谱(IR、傅立叶)
更多
相关方案
 咨询
咨询