
方案详情文
智能文字提取功能测试中
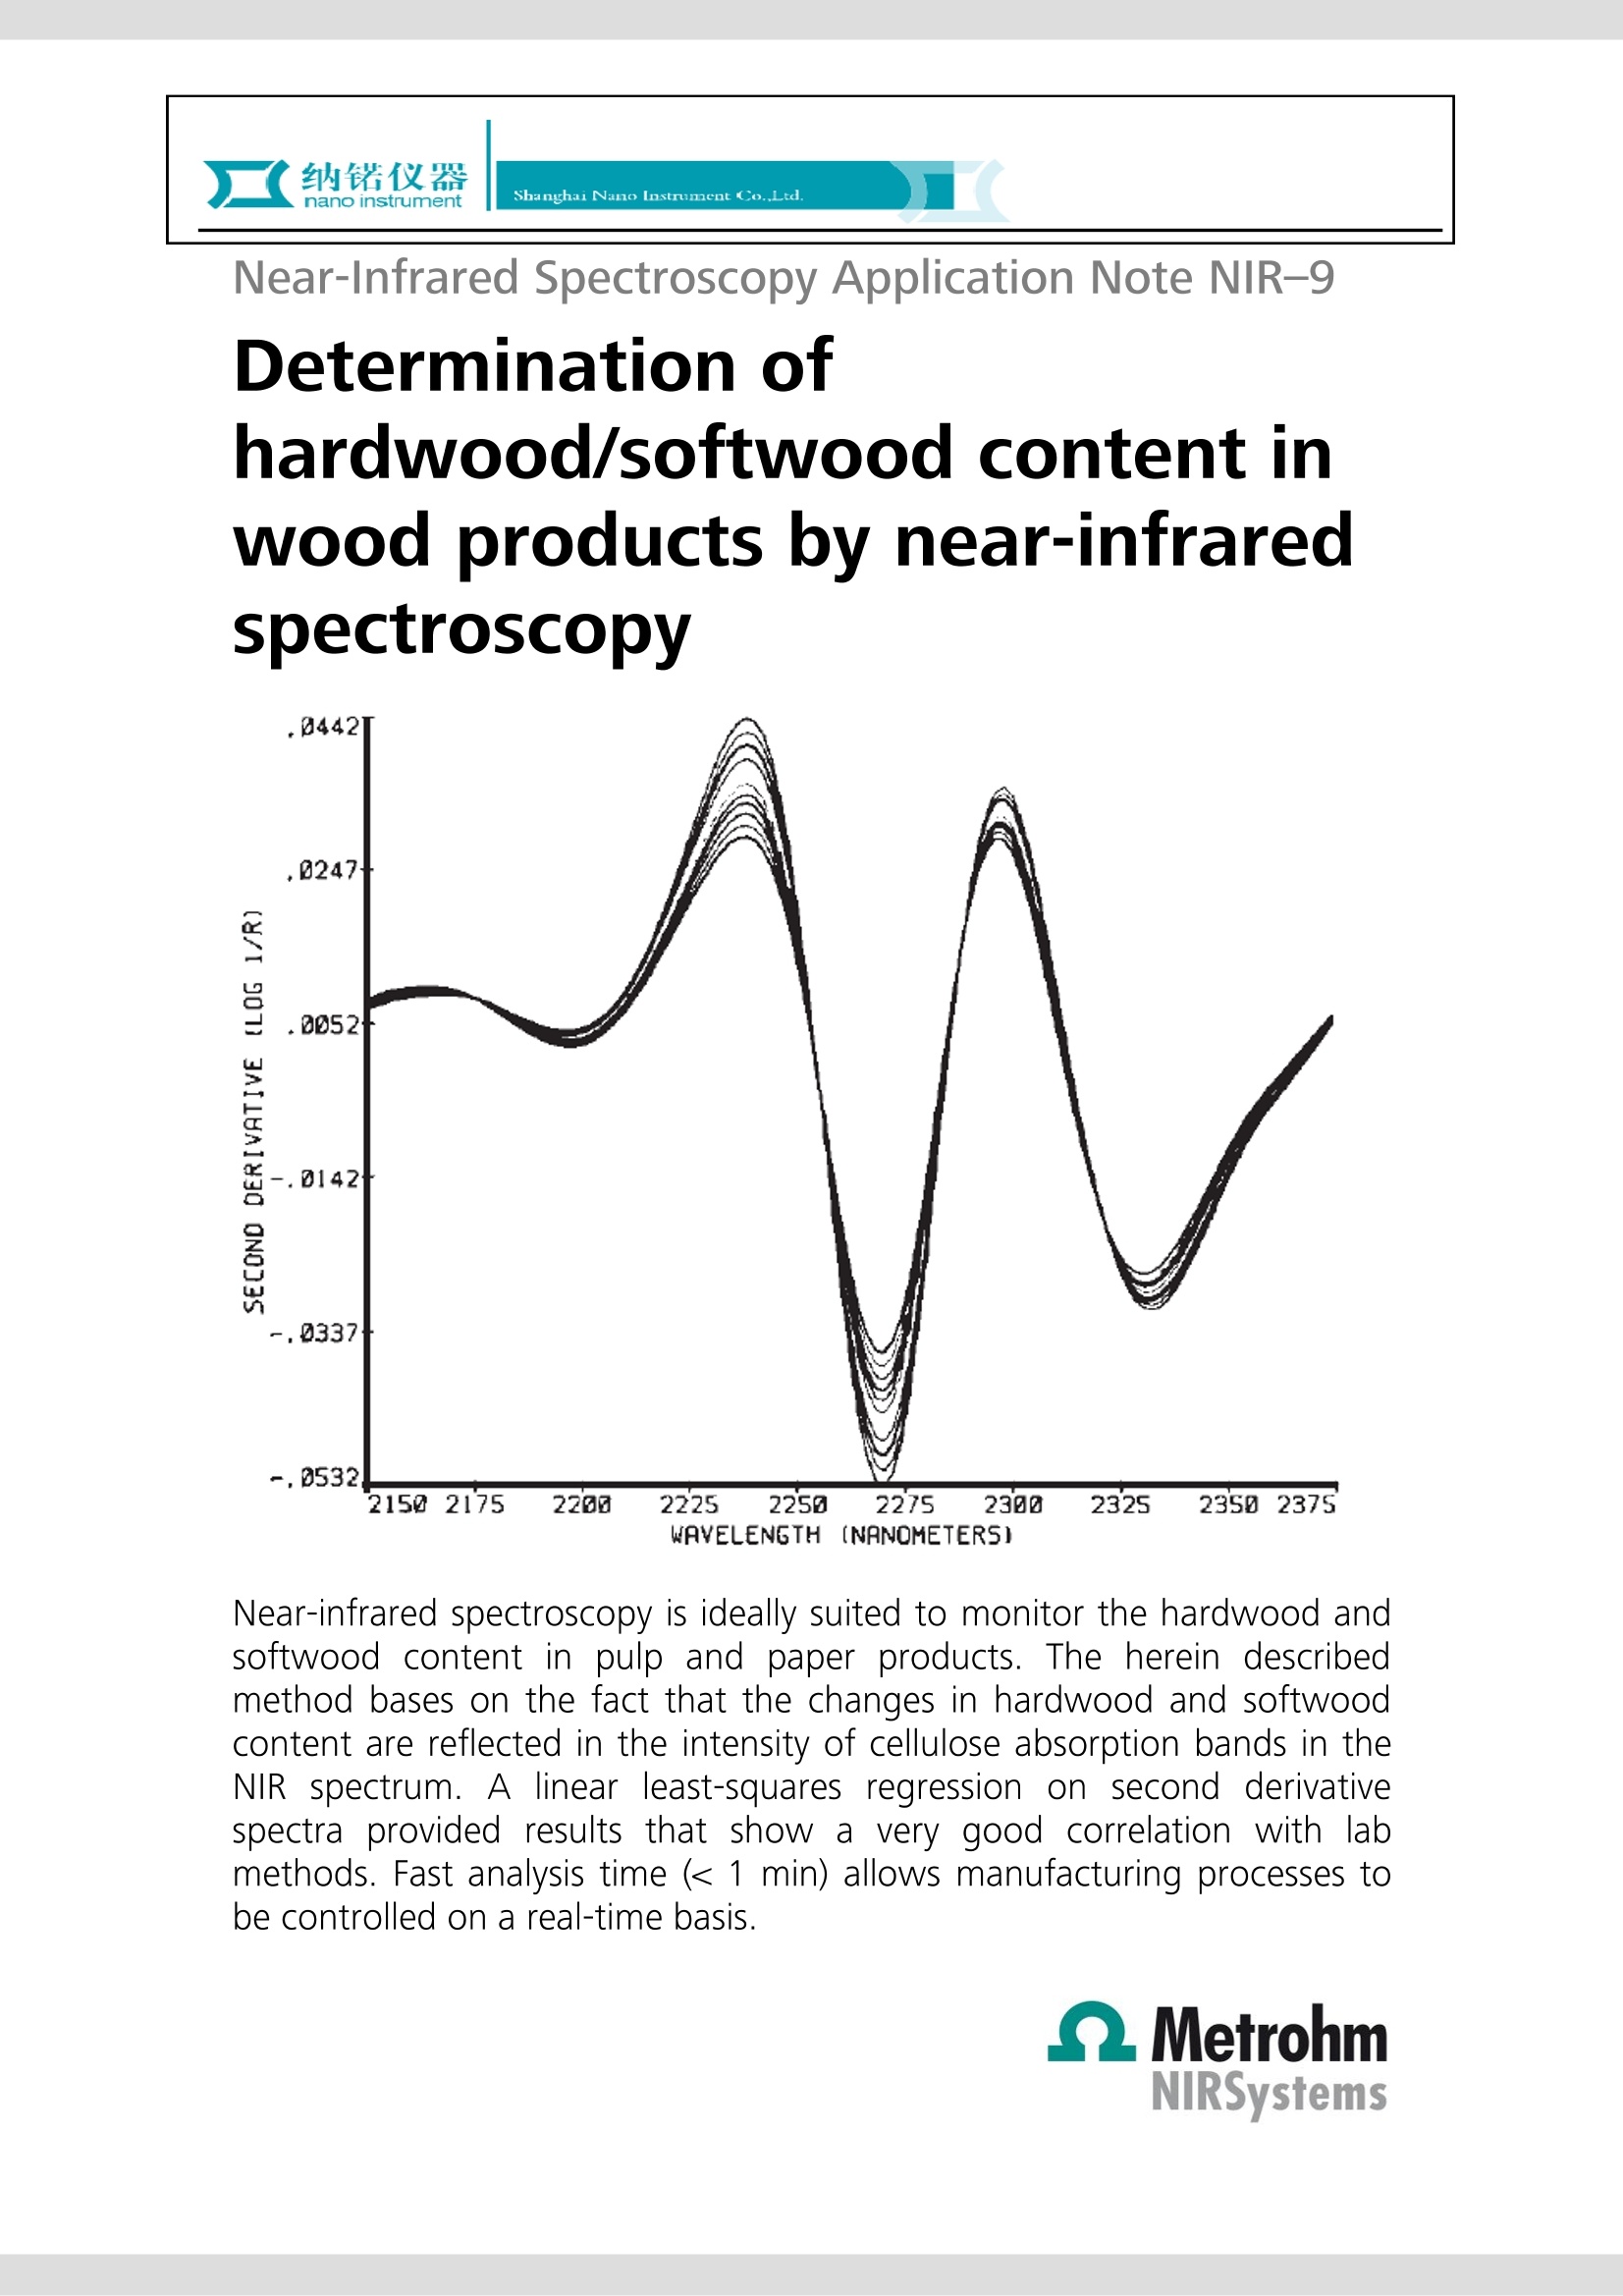
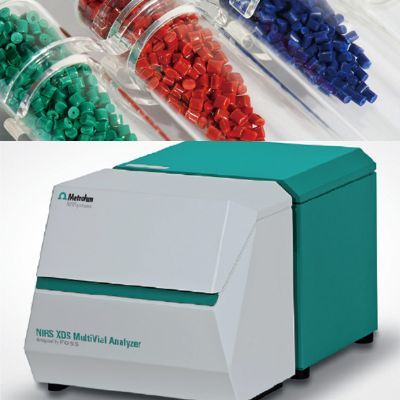
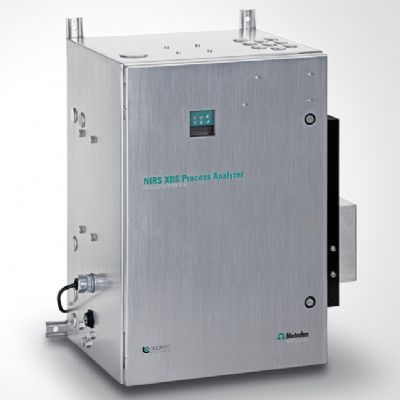
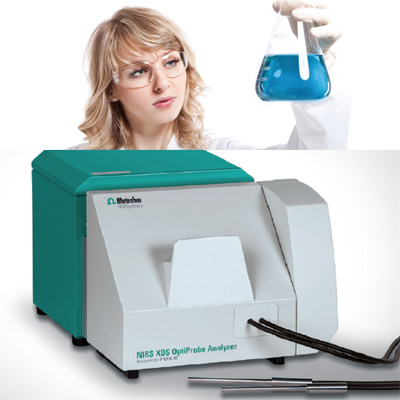
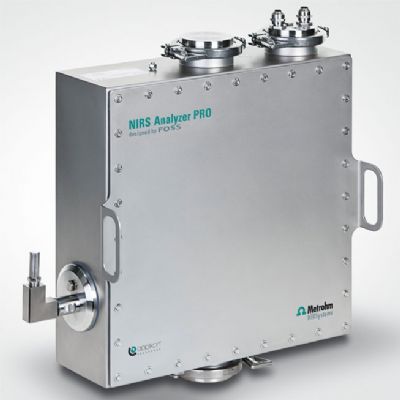
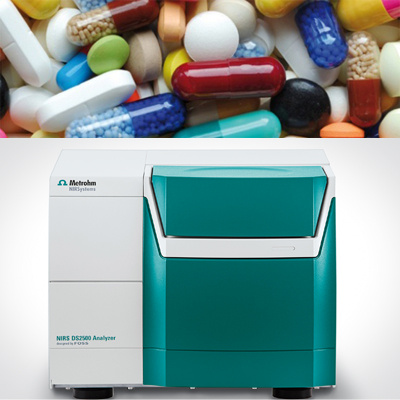
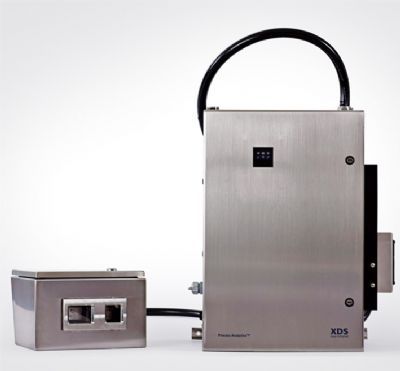
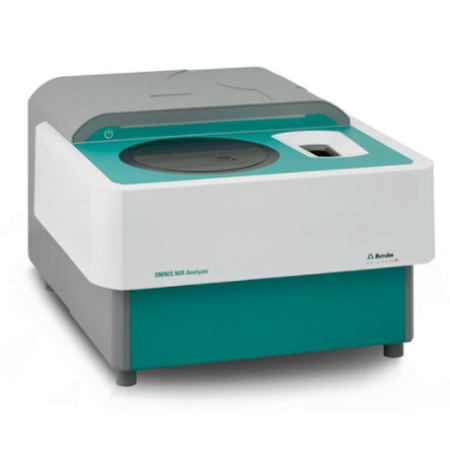
纳锘仪器nano instrument Shanghai Nano lnstrument Co.,Ltd.浙江办事处地址:浙江杭州市莫干山路425号瑞祺大厦814室电话:0571-8195457813107706400邮箱: sales@nano-instru.com Near-Infrared Spectroscopy Application Note NIR-9 Determination ofhardwood/softwood content inwood products by near-infraredspectroscopy .04421 Near-infrared spectroscopy is ideally suited to monitor the hardwood andsoftwood content in pulp and paper products. The herein describedmethod bases on the fact that the changes in hardwood and softwoodcontent are reflected in the intensity of cellulose absorption bands in theNIR spectrum. A linear least-squares regression on second derivativespectra provided results that show a very good correlation with labmethods. Fast analysis time (< 1 min) allows manufacturing processes tobe controlled on a real-time basis. Introduction The characteristics of paper and other wood productsare affected by the components in the original woodpulp, such as the relative amounts of hardwood andsoftwood fibers. Hardwood and softwood fibers differin their length and width, which affects the strengthand pliability of the products made from wood pulp.Presently, the determination of hardwood to softwoodratio is performed using microscopy, which requires ahighly trained microscopist, and is a tedious and time-consuming analysis. The length and width of the fibersis how the microscopist differentiates the hardwood andsoftwood fibers. A rapid analysis for hardwood/softwood content forpulp and paper products, which does not require highlytrained personnel would be very beneficial for qualitycontrol. Near-infrared (NIR) spectroscopy is one suchmethod. Experimental NIRspectra0(ofseveralpaperboardsamples wereNIIDCicmeasured using a Foss NIRSystems Model 6500 inreflectance mode from 1100 to 2500 nm. Since thisinstrument is not available anymore, the NIRS XDSRapidContent Analyzer is recommended. The sampleswere cut into two inch strips and placed into anelongated sample cell with a foam backing to insure aneven sample contact with the cell window. The NIRscans were co-averaged as the cell moved through theNIR beam to minimize the effects due to sampleinhomogeneities. Ten paperboard samples ranging from0 to 100% softwood wereanalyzed. Results and discussion The absorbance spectra (log 1/R) for the ten calibrationsamples are shown in Figure 1. The baseline varies dueto differences in the amount of NIR radiation reflectedby the samples, and is a significant source of error if leftuncorrected. By conversion of the spectra to the secondderivative, the baseline variations can be minimized asshown in Figure 2. This treatment obviates surfacetexture variations and allows investigation of chemicalcontent of the samples. (The second derivative mathtreatment inverts absorption peak maxima to secondderivative peak minima with positive lobes on eitherside.) Figure 1Hard/Softwood Paper Samples From Figure 2, it is evident that all absorption bands inthe NIR spectrum change in intensity as the hardwood/softwood content changes. This suggests that thevariation in the fiber length and width causes thepenetration depth of the NIR beam to change. As thepenetration depth increases, all absorbance bands in thespectrum increase in intensity. Since there are no majorchemical differences between hardwood and softwoodfibers, the change in penetration depth should be usefulin monitoring hardwood/softwood content. The mostlogical wavelength to use would be one due to anabsorption band for the major constituent in thesesamples (cellulose). Figure 2Hard/Softwood Paper Samples Method description Figure 3Hard/Softwood Paper Samples Other Applications Other applications of NIR spectroscopy for the pulp andpaper industry that have been successful include lignincontent in pulp (see AN-NIR-8), resin uptake, kaolintreatment, additives in paper, as well as coatings,waxes, adhesives, moisture and chemical treatments invarious paper products. Figure 4Percent Softwood Plot To demonstrate the ability to quantitatively determinesoftwood icontent in these hardwood/softwoodpaperboards, a linear least-squares regression wasperformed at 2274 nm. This wavelength band, shown inFigure 3, is attributed to absorptions of cellulose. Acorrelation (R) of -0.998 and a standard error ofcalibration (SEC) of 2.1% were obtained. A scatter plotof NIR calculated vs. laboratory reported results inshown in Figure 4. An excellent correlation is observedbetween the NIR and lab method for the analysis ofsoftwood content. Conclusions NIR spectroscopy offers a method for determination ofhardwood/softwood content in wood products. Fastanalysis time (less than one minute) allows processes tobe controlled on a real-time basis, minimizing out ofspecification products and assuring quality products. ( 上 海总部 地址: 上 海市闵行区莲花南路1388弄8号1503室 电话:0 2 1-609008296 0 900830 6113105i 邮 箱: i n fo@n a no-instru.co m 传真:0 2 1-61131052邮编: 2 01108 ) 传真:0571-81954579
关闭-
1/3
-
2/3

还剩1页未读,是否继续阅读?
继续免费阅读全文产品配置单
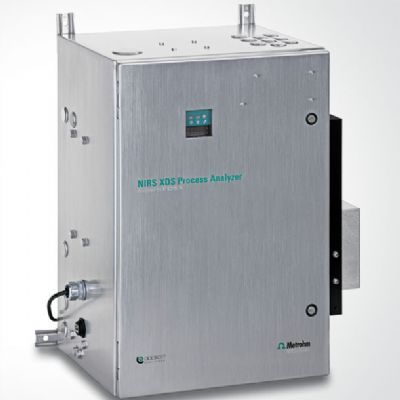
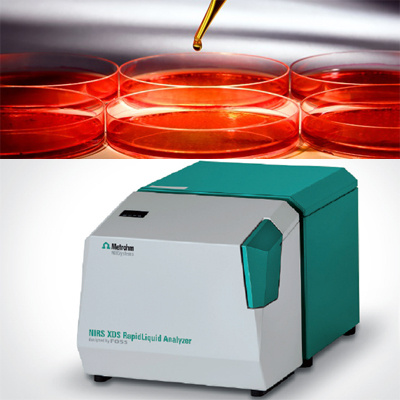
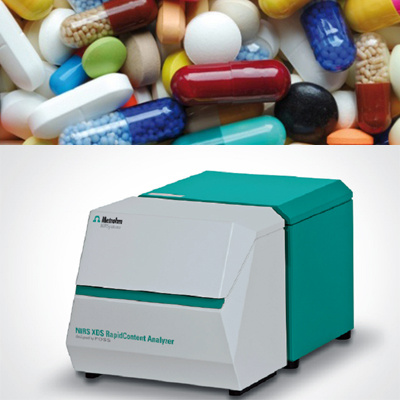
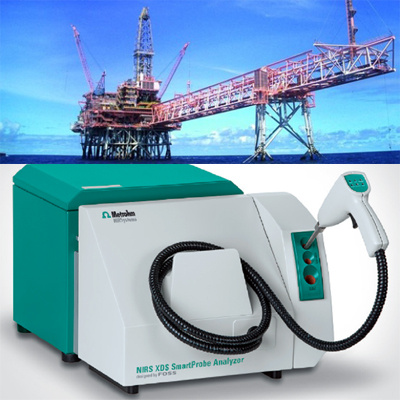
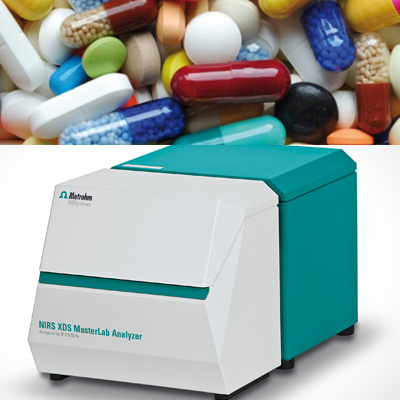
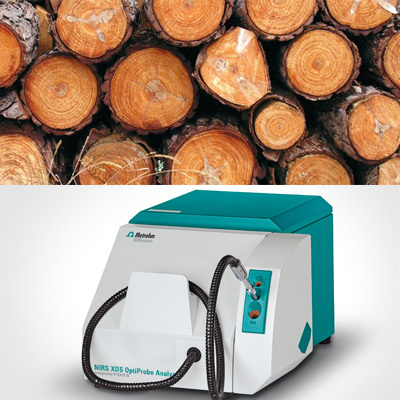
上海纳锘实业有限公司为您提供《木制品中硬木软木含量检测方案(近红外光谱仪)》,该方案主要用于林产品中理化分析检测,参考标准《暂无》,《木制品中硬木软木含量检测方案(近红外光谱仪)》用到的仪器有瑞士万通 XDS MultiVial 近红外光谱分析仪、瑞士万通 XDS近红外在线分析仪 –微光纤束型、瑞士万通 NIRS XDS TOPA 近红外光谱分析仪、瑞士万通 PRO 近红外在线分析仪、瑞士万通 DS 2500 近红外光谱分析仪、瑞士万通 XDS 近红外在线分析仪 ——直射光/非接触型、瑞士万通 XDS 近红外在线分析仪 -单光纤型、瑞士万通 XDS RLA 近红外光谱分析仪、XDS RCA 近红外光谱分析仪、瑞士万通 XDS SmartProbe 近红外光谱分析仪、瑞士万通 瑞士万通 XDS MasterLab 近红外光谱分析仪、瑞士万通 XDS IOPA 近红外光谱分析仪。
我要纠错
推荐专场
近红外光谱(NIR)
更多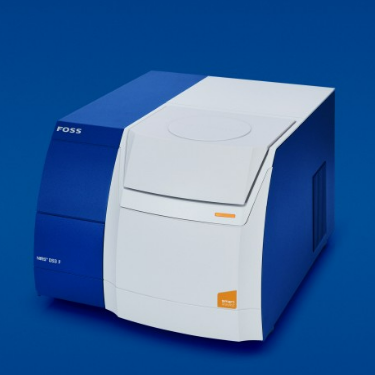
相关方案
 咨询
咨询