葵花籽压榨饼蛋白质和脂肪含量,干酪乳清蛋白质含量的检测
检测样品 其他食品
检测项目 营养成分
参考标准 GB 5009.5 食品安全国家标准 食品中蛋白质的测定


方案详情文
智能文字提取功能测试中
从副产品朝着创造可持续发展的食品迈进:葵花籽压榨饼和干酪乳清的热诱导结构形成Towards creating sustainable foods from side streams Heat-induced structure formation in blends of sunflower seed press cakes and cheese whey under moderate shearFoodHydrocolloids144(2023)108932Contents lists available at ScienceDirectFood Hydrocolloids Food Hydrocolloids 144 (2023) 108932N. Raak and M. Corredig journal homepage: www.elsevier.com/locate/foodhyd 从副产品朝着创造可持续发展的食品迈进:葵花籽压榨饼和干酪乳清的热诱导结构形成 Towards creating sustainable foods from side streams: Heat-induced structure formation in blends of sunfolwer seed press cakes and cheese whey under moderate shear Norbert Raak a ,b ,*, Milena Corredig a ,b aDepartment of Food Science, Aarhus University, Agro Food Park 48, 8200, Aarhus N, Denmark 丹麦奥尔胡斯大学食品科学系 bCiFOOD Centre for Innovative Food Research, Aarhus University, Aarhus, Denmark ARTICLE INFO ABSTRACT Keywords: Plant protein Whey protein Circularity Food waste By-product Heat treatment Processing of oilseeds generates low value by-products, which still contain valuable components. Sustainable and circular food chains require valorising the entire stream or producing less refined fractions of it. One approach could be blending with other protein-containing side streams to obtain novel, nutritionally valuable and techno-functional food ingredients. In this study, sunflower press cake was co-processed with components from whey, a cheese-making by-product. Blends with constant dry matter and protein content but different press cake to whey protein ratios (0–225 g/kg press cake) were used to investigate the contributions of both side streams to structure formation during heating (80–140 °C) under moderate shear using a Rapid Visco Analyser. The denaturation of whey proteins contributed to an increased viscosity, but the highest viscosities were still achieved at high ratios of press cake, underlining the importance of the fibre fraction for structure formation. Treatments at 120 and 140 °C increased the amount of insoluble material and water holding capacity of the blends, and analyses of the serum phase and curd showed that sunflower and whey proteins formed heat-induced, insoluble aggregates.Confocal laser scanning microscopy confrimed the presence of large protein particles dispersed in the matrix rather than the presence of a continuous network, as was the case for heating without shear. Furthermore, the protein particles were more defined and showed a smoother appearance with increasing press cake concentra-tion. This research provides fundamental insights in the colloidal interactions between biomacromolecule blends during processing (e.g., protein cross-linking, microphase separation), and demonstrates the importance of un-derstanding the critical process parameters (e.g., heat, shear) leading to structure formation, facilitating the successful integration of complex materials such as press cakes and setting the basis for further processing of the blends and their utilisation as ingredients, for instance in functional drinks, snacks, or semi-solid spreads. 1. Introduction Production and distribution of food have signifciant impact on our environment through, e.g., use of land, nutrient resources, energy, and freshwater (Aiking, 2011). Processing of raw materials often generates side streams, which still contain some of the macro- and micronutrients of the raw material, such as protein, fbire, lipids, minerals, and poly-phenols, but that mostly end up as animal feed, substrates for biofuel production, or as landflil rather than in the human food chain (Raak,Symmank, Zahn, Aschemann-Witzel, & Rohm, 2017). Many concepts have been developed to extract valuable compounds from food pro-cessing side streams (Mirabella, Castellani, & Sala, 2014). However, in processes of purifciation, circularity and sustainability are not top pri-orities (Karefyllakis, Octaviana, van der Goot, & Nikiforidis, 2019; van der Goot et al., 2016). Albeit using purifeid ingredients is justifeid in some cases such as infant formula and nutritional beverages to reach consistency and/or predictable processing behaviour, they are recom-bined with other purifeid ingredients in many applications. Using less refnied ingredients that already contain different techno-functional biomolecules (proteins, fbire, lipids) as novel components is thus a promising way to decrease the environmental impact of food production (Lie-Pang, Braconi, Boom & van der Padt, 2021), especially when pro-duced from food processing side streams constantly generated in large quantities. *Corresponding author. Department of Food Science, Aarhus University, Agro Food Park 48, 8200, Aarhus N, Denmark. E-mail addresses: norbert@food.au.dk (N. Raak), mc@food.au.dk (M. Corredig). https://doi.org/10.1016/j.foodhyd.2023.108932 Received 13 March 2023; Received in revised form 15 May 2023; Accepted 29 May 2023 Availableonline5June2023 0268-005X/©2023TheAuthor(s).PublishedbyElsevierLtd.ThisisanopenaccessarticleundertheCCBYlicense(http://creativecommons.org/licenses/by/4.0/). One prominent example One prominent example f f o o r r f fo o o od d p p r ro oc c e e s s s s i i n n g g s s i i d d e e s s t t r r e e a a m m s s i i s s w w h h e e y y ,,which is a nearly casein- and fat-free l iquid generated in large volumes which is a nearly casein- and fat-free liquid generated in large volumes during the production of many cheese varieties (~3-–11 kg per kg during the production of many cheese varieties (~311 kg per kg cheese). Whey still contains ~50 g/L lactose, as well as ~10 g/L of major and minor whey proteins (in particular o-lactalbumin and p-lactoglob-and minor whey proteins (in particular -lactalbumin and -lactoglob-ul i n) with excellent amino acid prof i les, making whey one of the most ulin) with excellent amino acid proflies, making whey one of the most valuable food processing side streams in terms of protein quality (Prandi et al ., 2019). In the efficient supply chains of large dairy factories, the et al., 2019). In the effciient supply chains of large dairy factories, the valorisation of cheese whey has been brought to perf valorisation of cheese whey has been brought to perf e e c c t t i i o o n n b b y y f f r r a a c c --tionating the different compounds to produce ingredients such as whey protein isolates and concentrates as well as lactose, which are widely applied in, e.g., infant formula and sports nutrition (Smit h e rs , 2015).applied in, e.g., infant formula and sports nutrition (Smithers, 2015).However, this may not be the case for small, artisanal cheese manu-facturers, where whey streams are still not further utilised for human consumption. Another, currently underuti li sed side stream is the solid pressing Another, currently underutilised side stream is the solid pressing residue from vegetable oil production, so called press cake, which is a rich source of proteins and f ibre. Soybean, rapeseed, an rich source of proteins and fbire. Soybean, rapeseed, an d d s s u u n n f f lo ol w w e e r r a a r r e e three of the globally most abundant crops due to the production of three of the globally most abundant crops due to the production of vegetable oil. The side streams from soybean oil production have been valorised for many years due to their economy of scale to produce soy valorised for many years due to their economy of scale to produce soy protein isolates and concentrates. These ingredients have been suc-protein isolates and concentrates. These ingredients have been suc-cessfully used in nutritional beverages as well as plant-based dairy and meat alternatives (Zhang et al., 2021). However, other oilseed press cakes have received increased attention only in the recent years (Arru-tia, Binner, Williams, & Waldron, 2020; Avelar, Rodrigues, Pereira, &V i ce n te, 2022; Fi l h o & E g ea , 2021). Some oilseeds contain significant Vicente, 2022; Filho & Egea, 2021). Some oilseeds contain signifciant amounts of antinutritional compounds such as phytic acid, glucosino-lates, or chlorogenic acid, which have undesired effects on digestion and uptake of nut r ients (Ancut a & S on i a , 2020). However, strategies to uptake of nutrients (Ancuța & Sonia, 2020). However, strategies to decrease the amount of ant i nutri t ional com decrease the amount of antinutritional com p p o o u u n n d d s s a a r r e e c c u u r r r r e e n n t t l l y y u u n n d d e e r r development. For example, extrusion cooking of press cakes at tem-peratures between 100 and 130 °C was proven powerful to degrade peratures between 100 and 130 C was proven powerful to degrade antinutritional compounds while resulting in only minor aggregation,antinutritional compounds while resulting in only minor aggregation,denaturation, and structural changes of the proteins (Vidal et al., 2022). As many plant proteins have deficiencies in some essential amino As many plant proteins have defciiencies in some essential amino acids such as lysine, using blends of different protein sources is a acids such as lysine, using blends of different protein sources is a promising way to not only enhance their biological value, but also to promising way to not only enhance their biological value, but also to modulate their techno-functional behaviour (Jimenez-Munoz, Tavares,& Corredig, 2021), especially when blending plant and animal proteins (Alves & Tavares, 2019). Side stream blends such as whey and oilseed press cakes have therefore a great potential to obtain novel, sustainable press cakes have therefore a great potential to obtain novel, sustainable food ingredients of high nutritional value and good techno-functional properties (R aa k et a l ., 2022). Using such complex matrices that properties (Raak et al., 2022). Using such complex matrices that contain various types of biomacromolecules such as carbohydrates and contain various types of biomacromolecules such as carbohydrates and different proteins, however, requires a complete understanding of the synergies and thermodynamic incompatibilities of the components synergies and thermodynamic incompatibilities of the components present in the system in terms of structure formation during processing,from the molecular level up to aggregates and networks (from the molecular level up to aggregates and networks (C C o o r r r r e e d d i i g g ,,Young, & Dalsgaard, 2020). The aim of this research was to investigate systematically the The aim of this research was to investigate systematically the structure formation in blends of sunflower press cake and whey during structure formation in blends of sunfolwer press cake and whey during different heat treatments under moderate shear conditions. Heat treat-ment is an important process to ensure microbial and enzymatic stability of food products, while shear at different intensities is often applied in food manufacturing to homogenise products and modulate their struc-food manufacturing to homogenise products and modulate their struc-ture formation and texture. For instance, high shear is applied in ture formation and texture. For instance, high shear is applied in extrusion to create fbirous structures of plant proteins, whereas mod-erate shear can be used to break yoghurt gels to obtain a smoother texture. Blends with varying amounts of press cakes but same overall dry matter and protein content were studied, thus allowing to draw con-clusions on the individual contributions of press cake and whey con-stituents on structure formation and physical properties of the blends.stituents on structure formation and physical properties of the blends.For the frist time, this study describes in detail the structuring mecha-nisms of such side stream blends to facilitate their implementation in a circular food chain.circular food chain. 2.1. Gross composition of basis materials The materials used in this study and their composition are sum-The materials used in this study and their composition are sum-marised in Table 1. The press cake from Schalk Mühle (Ilz, Austria) was obtained from cold pressing (55-–65°C) of dehulled sunflower seeds, and milled in a cold pressing (5565 C) of dehulled sunfolwer seeds, and milled in a hammer mil l. Sweet whey powder and whey protein hammer mill. Sweet whey powder and whey protein c c o o n n c c e e n n t t r r a a t t e e w w e e r r e e provided by Bayrische Milchindustrie eG (Palting, Germany) and Arla Foods Amba (Viby, Denmark). Milk ul t rafiltration permeate was pro-Foods Amba (Viby, Denmark). Milk ultraflitration permeate was pro-duced from pasteurised (72°C, 15 s) skim milk (Arla Foods Amba) by duced from pasteurised (72 C, 15 s) skim milk (Arla Foods Amba) by ultrafiltration (MWCO 30 kDa , PESH) using a Vibro LE System (Sani ultraflitration (MWCO 30 kDa, PESH) using a Vibro LE System (Sani Membranes ApS, Allero ø d, Denmark) as described previously (R aa k &Membranes ApS, Aller d, Denmark) as described previously (Raak &C o rr ed i g , 2022). 0.2 g/L NaN3 was added to the skim m Corredig, 2022). 0.2 g/L NaN ilk for preser- 3 was added to the skim milk for preser-vation prior to ultrafiltration, ensuring also t he microbial stabi l ity of the vation prior to ultraflitration, ensuring also the microbial stability of the samples prepared with the resulting permeate. Total dry matter was determined by drying the samples at 105 C in a heating chamber (Memmert GmbH + Co. KG, Schwabach, Germany)heating chamber (Memmert GmbH Co. KG, Schwabach, Germany)until constant mass was reached. Protein contents were obtained from their nitrogen contents (Gerhardt Dumatherm, C. Gerhardt GmbH&Co.KG, Konigswinter, Germany) by multiplying with conversion factors of Nx 5.80 (sunflower proteins) and N x 6.38 (whey proteins). The lipid N 5.80 (sunfolwer proteins) and N 6.38 (whey proteins). The lipid contents were determined according to AOAC method 954.02 using a Hydrotherm and Soxtherm@ from C. Gerhardt GmbH&Co.KG. Total Hydrotherm and Soxtherm® from C. Gerhardt GmbH&Co.KG. Total carbohydrate contents were determined according the phenol-H2SO4carbohydrate contents were determined according the phenol-H SO2 4colorimetric method described by Duboi s , Gill es , Ha milt o n, R e b er s , an d colorimetric method described by Dubois, Gilles, Hamilton, Rebers, and Smith (1956), which detects all classes of carbohydrates (i.e., mono-, di-,oligo-, and polysaccharides). Total starch content of the sunfolwer press cake was determined according to method 76-–13.01 (AAC C, 2015)cake was determined according to method 7613.01 (AACC, 2015)using the Megazyme total starch assay kit (K-TSTA-100A, Wicklow,using the Megazyme total starch assay kit (K-TSTA-100A, Wicklow,Ireland). Both, resistant starch and glucose are detected by the method.Ash contents were determined by thermo-gravimetric analysis (TGA-2STAR, Mettler Toledo, USA). Approx. 12 mg of sample were weighed STAR, Mettler Toledo, USA). Approx. 12 mg of sample were weighed into aluminium crucibles with punctured lids (Mett l er Toledo) and into aluminium crucibles with punctured lids (Mettler Toledo) and placed in the instrument. The samples were heated from ambient tem-perature to 600 °C at 10 K/min under nitrogen atmosphere and subse-perature to 600 C at 10 K/min under nitrogen atmosphere and subse-quently held at 600 °C for 45 min under air environment while quently held at 600 C for 45 min under air environment while constantly measuring the sample weight. The ash content was calculated from the ratio of fnial to initial sample weight. All compositional ana-lyses were performed at least in duplicate and are reported as mean values. 2.2. Sample preparation 2.2.1. Preparation of basis samples 2.2.1. Preparation of basis samples Various blends with sunflower press cake contents of 0-–Various blends with sunfolwer press cake contents of 0222255 g g //k k g g Table 1 Composition of the raw materials used for sample preparation. Sunfl SunflowerW Sower Whheeyy pprrootteeiinn Swweeeett MilkMilk press press cwcaakkee concentrate whheeyyu ltrafiltration ultraflitration powder permeate Dry matter (g/ 950 991 989 58 kg, w.b.) Protein (g/kg, w. 462 781 121 n.d. b.) Lipids (g/kg, w. 90 n.d. 9 n.d. b.) Total 212 97 731 n.d. carbohydrates (g/kg, w.b.) Total starch (g/ 11 n.d. n.d. n.d. kg, w.b.) Ash (g/kg, w.b.) 96 33 77 n.d. –w.b.wet basis. –n.d.not determined. were prepared by mixing press cake, whey protein concentrate, sweet whey powder, and milk ultrafil t ration permeate us i ng an Ultra Tur whey powder, and milk ultraflitration permeate using an Ultra Tur r r a a x x (0Ø 18 mm dispersing element , I KA Werke GmbH&Co.KG, Stauffen,(18 mm dispersing element, IKA Werke GmbH&Co.KG, Stauffen,Germany). The rotational speed was set to 9,500 rpm for 4 min, followed by 13,500 rpm for 4 min , and finally 20,500 rpm for 2 min, allowing a by 13,500 rpm for 4 min, and fnially 20,500 rpm for 2 min, allowing a thorough homogenisation without formation of clumps. Ta b le 2 l i sts the thorough homogenisation without formation of clumps. Table 2 lists the composition of the all blends prepared in this study. The blends were adjusted to both equal dry matter (259 g/kg) and equal protein content adjusted to both equal dry matter (259 g/kg) and equal protein content (104 g/kg) to evaluate the effects of the various components on the structure formation during heat treatment. 2.2.2. Heat and shear treatment 2.2.2. Heat and shear treatment Heat treatment of the blends were performed using a Perten rapid visco analyser (RVA 4800, PerkinElmer Inc., Waltham, MA, USA)visco analyser (RVA 4800, PerkinElmer Inc., Waltham, MA, USA)equipped with a pressure cell. The container was fliled with 30 g of sample, hermetically closed, and placed within the instrument. At the beginning of the measurement, the temperature was held at 30 °C for 4beginning of the measurement, the temperature was held at 30 C for 4min, followed by heating with 10 K/min, holding at a peak temperature of either 80, 120, or 140 °C for 5 min, cooling down to 30 °C with 5 K/of either 80, 120, or 140 C for 5 min, cooling down to 30 C with 5 K/min, and holding at 30C for 2 min. Dur i ng the experiment, the angular min, and holding at 30 C for 2 min. During the experiment, the angular velocity of the paddle was 160 rounds per minute (rpm), corresponding to an average shear rate of ~54/s (Lai, Steffe, & Ng, 2000). Reference samples without shear were prepared using the same procedure but without the paddle inserted. Additionally, to study the structure for-mation at various points of the process, the procedure was aborted at characteristic time points, and the samples were then rapidly cooled in ice water. In view of the complexity of the samples and the instrument geom-etry, the viscosity values calculated automatically by the RVA were transformed back to the original torque M=n·N/k"(mN.m), where n is transformed back to the original torque M N k (mN.m), where is the viscosity provided by the instrument (mPa.s), N = 160/min the the viscosity provided by the instrument (mPa.s), N 160/min the angular velocity of the paddle, and k"= 2,000/m’3 is the i nstrument angular velocity of the paddle, and k 2,000/m is the instrument constant (Lai et al., 2000). 2.3. Physical analyses 2.3. Physical analyses 2.3.1. pH measurements The pH was measured using an InoLab 7310 pH meter (WTW GmbH,Weilheim, Germany) equipped with a SenTix 82 electrode (WTW Weilheim, Germany) equipped with a SenTix 82 electrode (WTW GmbH).GmbH). Table 2 Composition used study. and pH of side stream blends in this SunflowerSunfl ower Whey Sweet Milk SunflowerSunfl ower pH(-)pH ( ) press cake protein whey ultrafiltrationultraflitration Protein to (g/kg) concentrate powder permeate (g/ Whey (g/kg) (g/kg kg) Protein Ratio 0 118.0 97.4 784.6 0:100 6.14 土 0.06aabb0.06 6.12 士 0.00°a0.00 6.14 士 0.03aabb0.03 50 91.8 75.8 782.5 22:78 100 65.5 54.1 780.3 44:56 150 39.3 32.5 778.2 67:33 6.25 bc 0.01 士 6.22 十 0.04aabbec 175 26.2 21.7 777.1 78:22 0.04 200 13.1 10.8 776.1 89:11 n.d. 225 0 00 775.0 100:0 6.29 土 c 0.00 2.3.2. Viscosity measurements 2.3.2. Viscosity measurements The apparent viscosity of the various blends of press cake and whey The apparent viscosity of the various blends of press cake and whey proteins was measured using a stress-controlled rheometer AR-G2 (TA Instruments, New Castle, DE, USA) equipped with a 40 mm cross-Instruments, New Castle, DE, USA) equipped with a 40 mm cross-hatched parallel plate geometry and a Peltier element for temperature control. Gap width and temperature were 1 mm and 25°C, respe control. Gap width and temperature were 1 mm and 25 C, respe c c t t i i v v e e l l y y ..The shear rate was increased from y =0.1/s to 1,000/s measuring 10The shear rate was increased from 0.1/s to 1,000/s measuring 10points per decade. At each point, the sample was pre-sheared for 20 s,followed by measuring the average apparent viscosity over a duration of followed by measuring the average apparent viscosity over a duration of 10 s. Data was collected and analysed using Rheology Advantage v5.7.0(TA Instruments). 2.3.3. Colour measurements 2.3.3. Colour measurements The colour of the side stream blends before and after heat treatment was measured using a CR400 chromameter (Konica Minolta Sensing Europe B.V., Nieuwegein, The Netherlands) and is reported in the CIE-LAB colour space , result i ng in the coordinates L*, a*, and b* for l ightness,LAB colour space, resulting in the coordinates L , a , and b for lightness,green/red, and blue/yellow, respectively. The change in colour induced by the heat treatments is expressed as t he colour difference AE*, where by the heat treatments is expressed as the colour difference E , where the colour values of the unheated samples were taken as reference: 2.3.4. Water expression 25 g of each sample were centrifuged at 3,000×g for 30 min at 25°℃25 g of each sample were centrifuged at 3,000 g for 30 min at 25 C us i ng a centrifuge (SL40R, ThermoFisher Scienti f ic, Waltham, MA,using a centrifuge (SL40R, ThermoFisher Scientifci, Waltham, MA,USA). The supernatant was collected for further analyses, and the USA). The supernatant was collected for further analyses, and the sediment was weighed out and is given as percentage of the original sample mass.sample mass. 2.3.5. Microstructure A 2 mg/mL solution of fluorescein isothiocyanate (FITC) dissolved in A 2 mg/mL solution of fulorescein isothiocyanate (FITC) dissolved in acetone was used for protein staining, and 60 uL of the staining solution acetone was used for protein staining, and 60 L of the staining solution were mixed with 30 g of side stream blend prior to treatments in the RVA. Small portions of each sample were placed on a glass slide, and the microstructure was visualised using a confocal laser scanning micro-scope (CLSM; Nikon C2, Nikon Instrument Inc., Tokyo, Japan). A laser beam with a wave length of 488 nm was applied for excitation to induce fulorescence emission of the dyed protein particles, and pictures were taken at a magnification of 20 × . Representative images are shown.taken at a magnifciation of 20 . Representative images are shown. 2.4. Protein analysis 2.4. Protein analysis Total nitrogen contents of the unheated blends as well as of the centrifugal supernatants of heated and unheated blends was determined centrifugal supernatants of heated and unheated blends was determined using a a Gerhardt Dumatherm (C. Gerhardt GmbH & Co. KG,using aGerhardt Dumatherm (C. Gerhardt GmbH & Co. KG,Konigswinter, Germany) and taken as indicator for serum protein. The nitrogen contents were not further converted to protein contents due to the complexity of the sample with regard to di f ferent conversion factors the complexity of the sample with regard to different conversion factors and non-protein nitrogen in the milk ultrafiltration permeate.and non-protein nitrogen in the milk ultraflitration permeate. was used for band identification. The experiments were run at 200 V for was used for band identifciation. The experiments were run at 200 V for 35 min using an XCell SureLockTM ™ Mini-Cell f illed with NuPAGET ™M MES 35 min using an XCell SureLockMini-Cell fliled with NuPAGEMES ™SDS running buffer. The gels were stained overnight in SimplyBlue SafeStain solution, rinsed in demineralised water for 24 h, and subse-quently digital i sed using a ChemiDoc XRS + gel imaging system (Bio quently digitalised using a ChemiDoc XRS gel imaging system (Bio Rad Laboratories). The protein bands were analysed semi-quantitatively using Image Lab (v6.0.1; Bio Rad Laboratories). 2.5. Statistical analysis All samples were prepared in duplicate. Statistically significant dif-All samples were prepared in duplicate. Statistically signifciant dif-ferences between unheated blends were ident if ied using a on ferences e-way between unheated blends were identifeid using a one-way analysis of variance (ANOVA), and the effect of both heating tempera-ture and press cake concentration was analysed using a two-way ture and press cake concentration was analysed using a two-way ANOVA. The statistical acceptance level was P <0.05.ANOVA. The statistical acceptance level was 0.05. 3. Results and discussion 3.1. Composition of the sunflower press cake and the side stream blends 3.1. Composition of the sunfolwer press cake and the side stream blends The gross composi t ion of the sunflower press The gross composition of the sunfolwer press c c a a k k e e ((T T a a b b l l e e 11)) w w a a s s within the range of previously reported data within the range of previously reported data ((A A n n c c u u t ț a a && S S o o n n i i a a ,, 22002200))..However, due to the use of dehulled sunflower seeds for pressing, the However, due to the use of dehulled sunfolwer seeds for pressing, the protein content (462 g/kg) was higher and carbohydrate content (212g/kg) lower compared recent studies (B a rt a et a l ., 20g/kg) lower compared recent studies (Barta et al., 202211;; F F i i l l h h o o && E E g g e e a a ,,2021; Ma ng ieri e t a l ., 2022). The press cake also contain 2021; Mangieri et al., 2022). The press cake also contain e e d d 9900 g g //k k g g unextracted lipids, probably in form of native oleosomes. The blends (T ab le 2) were obtained by mixing 0-–225 g/kg sunflower The blends (Table 2) were obtained by mixing 0 225 g/kg sunfolwer press cake with different amounts of sweet whey powder, whey protein concentrate, and milk ultrafiltration permeate (containing mainly concentrate, and milk ultraflitration permeate (containing mainly lactose and minerals) necessary to reach equal dry matter (259 g/kg)and protein content (104 g/kg). As a consequence, the blends differed in their sunflower protein:whey protein ratio (0:100-–100:0), lactose con-their sunfolwer protein:whey protein ratio (0:100100:0), lactose con-centration, and polysaccharide content. The pH ranged from 6.12 to 6.29, with a signifciant difference only between the blends without and with the highest amount of press cake (Table 2). I t is expected that the polysaccharides of the sunflower press cake It is expected that the polysaccharides of the sunfolwer press cake (fbire and starch) will contribute to the overall viscosity of the blends,whereas the presence of lactose will play a role in Maillard-type protein cross-linking during heating. In Maillard reactions, reducing sugars such cross-linking during heating. In Maillard reactions, reducing sugars such as lactose or glucose react with amino groups of proteins, initiating a cascade of chemical reactions, which eventually lead to protein cross-linking (Lund & Ray, 2017). A small prop linking (Lund & Ray, 2017). A small prop o o r r t t i i o o n n o o f f r r e e d d u u c c i i n n g g s s u u g g a a r r s s such as glucose and galactose in the blends is der i ving fr such as glucose and galactose in the blends is deriving fr o o m m t t h h e e s s u u n n --folwer press cake (Guo, Klinkesorn, Lorjaroenphon, Ge, & Jom, 2021),whereas the major part stems from the lactose present in the milk ul-trafiltration permeate and the sweet whey powder.traflitration permeate and the sweet whey powder. 3.2. Rheological characterisation of the unheated side stream blends 3.2. Rheological characterisation of the unheated side stream blends Fig. 1A shows the apparent viscosity of the different side stream blends as a function of shear rate. With increasing press cake concen-tration, the apparent viscosity increased and the rheological behaviour tration, the apparent viscosity increased and the rheological behaviour changed. Blends with 0 g/kg press cake (i.e., only whey components)had a low apparent viscosity and Newtonian folw behaviour, i.e., the apparent viscosity was independent of the shear rate. Although the press cake corresponded to less tha cake corresponded to less tha n n 2200%% o o f f t t h h e e d d r r y y m m a a t t t t e e r r o o f f t t h h e e b b l l e e n n d d ,, t t h h e e samples containing 50 g/kg press cake already showed a decreasing apparent viscosity with increasing shear rate, i.e., shear thinning apparent viscosity with increasing shear rate, i.e., shear thinning behaviour, with both the low shear (y<0.3/s) and high shear plateau (y behaviour, with both the low shear ( 0.3/s) and high shear plateau (> 100/s) being clearly visible. With i ncreasing press cake content, these 100/s) being clearly visible. With increasing press cake content, these plateaus were shifted outside the measured shear rate range, implying that the shear thinning occurred over a broader range of shear rates. The protein content was 104 g/kg in all blends, lower than the concentra-tions at which shear thinning occurred in suspensions of whey proteins tions at which shear thinning occurred in suspensions of whey proteins (~150 g/kg; Purwanti et al., 2011) and sodium caseinate (~140 g/kg;Pitk owski , Dura n d, & Ni co lai, 2008; R a a k et a l ., 2020). It is possible to Pitkowski, Durand, & Nicolai, 2008; Raak et al., 2020). It is possible to conclude that the pronounced shear thinning behaviour as well as the increase in apparent viscosity with increasing press cake concentration increase in apparent viscosity with increasing press cake concentration was a consequence of the higher fibre contents, as i t is known tha t sol-was a consequence of the higher fbire contents, as it is known that sol-uble and insoluble fibres such as pectin and cellulose dramatically in-uble and insoluble fbires such as pectin and cellulose dramatically in-crease the apparent viscosity of a solution and result in shear thinning behaviour (Dikeman & Fahey, 2006). Fig. 1B illustrates the apparent viscosity of the blends at low shear rate (y=0.1/s) as a function of the press cake concentration and sun-rate ( 0.1/s) as a function of the press cake concentration and sun-folwer protein to whey protein ratio. It is evident that the apparent viscosity increased dramatically with increasing press cake content viscosity increased dramatically with increasing press cake content above 150 g/kg, which corresponds to 55% of the dry matter and ~50%of the carbohydrates in the blend coming from the press cake. Such a of the carbohydrates in the blend coming from the press cake. Such a behaviour is very typical for biomacromolecules such as polysaccharides and proteins, which are jammed at high concentrat ions, lea and proteins, which are jammed at high concentrations, lea d d i i n n g g t t o o increased i nteractions due to entanglements and interpenetration of the increased interactions due to entanglements and interpenetration of the polymer chains or soft particles, respectively (de Kruif, Bhatt, Anema, &Coker, 2015; Nachtigall et al., 2020; Raak et al., 2020). The protein content was equal in all blends (104 g/kg), and we conside r the differ-content was equal in all blends (104 g/kg), and we consider the differ-ence in protein composition to be negligible. Therefore, this behaviour must stem from the i ncreased fraction of polysaccharides with must stem from the increased fraction of polysaccharides with increasing press cake content. These results demonstrate the contribu-tion of biomacromolecule interactions to the bulk apparent viscosity during processing of unrefined, protein-rich food matrices.during processing of unrefnied, protein-rich food matrices. 3.3. Characterisation of the heated blends 3.3. Characterisation of the heated blends 3.3.1. Heat-induced colour changes of side stream blends 3.3.1. Heat-induced colour changes of side stream blends Al l side stream blends were subjected to heat treatment under All side stream blends were subjected to heat treatment under Suflower Protein : Whey Protein Ratio Fig. 1. (A) Apparent viscosity of side stream blends as a Fig. 1. (A) Apparent viscosity of side stream blends as a f f u u n n c c t t i i o o n n o o f f s s h h e e a a r r r r a a t t e e ((n n u u m m b b e e r r s s r r e e f f e e r r t t o o p p r r e e s s s s c c a a k k e e c c o o n n c c e e n n t t r r a a t t i i o o n n i i n n g g //k k g g a a n n d d s s u u n n f f lo lo w w e e r r p p r r o o t t e e i i n n t t o o w w h h e e y y protein ratio). (B) Apparent viscosity of side stream blends at a shear rate of 0.1/s as a function of the press cake concentration and sunflower protein to whey protein ratio. All blends had a dry matter of 259 g/kg and a protein content of 104 g/kg. continuous shear in the RVA, and the samples were taken for further continuous shear in the RVA, and the samples were taken for further analyses at the end of the treatment. Fig. 2 illustrates the colour properties of the side stream blends as affected by the press cake concentration and heating temperature. The l l i i g g h h t t n n e e s s s s ((L L * )) o o f f t t h h e e u u n n h h e e a a t t e e d d s s i i d d e e s s t t r r e e a a m m b b l l e e n n d d s s d d e e c c r r e e a a s s e e d d s s i i g g n n i i f f ic ci a a n n t t l l y y w w i i t t h h i i n n c c r r e e a a s s i i n n g g p p r r e e s s s s c c a a k k e e c c o o n n t t e e n n t t u u p p t t o o 115500 g g //k k g g a a n n d d r r e e a a c c h h e e d d a a p p l l a a t t e e a a u u at higher concentrations (Fig. 2A). With increasing press cake content,a* increased from -5 to a increased from 5 to 55 ((F F i i g g .. 22B B )),, i i n n d d i i c c a a t t i i n n g g a a s s h h i i f f t t f f r r o o m m s s l l i i g g h h t t l l y y g g r r e e e e n n t t o o s s l l i i g g h h t t l l y y r r e e d d c c o o l l o o u u r r .. A As s b bo o t t h h t t h h e e w w h h e e y y i i n n g g r r e e d d i i e e n n t t s s a a n n d d t t h h e e s s u u n n f f lo ol w w e e r r p p r r e e s s s s c c a a k k e e h h a a d d a a y y e e l l l l o o w w c c o o l l o o u u r r ,, b b * had po had po s s i i t t i i v v e e n n u u m m b b e e r r s s i i n n a a l l l l c c a a s s e e s s (Fig. 2C). However, the parameter decreased slightly with increasing press cake content, indicating a press cake content, indicating a s s l l i i g g h h t t s s h h i i f f t t t t o o w w a a r r d d s s a a m m o o r r e e n n e e u u t t r r a a l l c c o o l l o o u u r r .. I I t t i i s s w w o o r r t t h h n n o o t t i i n n g g t t h h a a t t t t h h e e r r e e w w a a s s n n o o m m o o r r e e c c h h a a n n g g e e i i n n t t h h e e c c o o l l o o u u r r parameters with increasing press cake content above 150 g/kg, when more than half of the solids in the blends derived from press cake. A A s s i i n n d d i i c c a a t t e e d d b b y y A E E * ((F F i i g g .. 22D D )),, h h e e a a t t t t r r e e a a t t m m e e n n t t a a t t 8800 a a n n d d 112200 ° ℃C c c a a u u s s e e d d o o n n l l y y a a m m i i n n o o r r c c h h a a n n g g e e i i n n c c o o l l o o u u r r .. A A t t l l o o w w p p r r e e s s s s c c a a k k e e c c o o n n t t e e n n t t s s (( ≤ 115500g g //k k g g )),, t t h h i i s s w w a a s s m m a a i i n n l l y y d d u u e e t t o o t t h h e e s s i i g g n n i i f f ic ci a a n n t t l l y y i i n n c c r r e e a a s s e e d d L L * , , w w h h e e r r e e a a s s A E E *w w a a s s g g e e n n e e r r a a l l l l y y l l o o w w e e r r w w i i t t h h m m o o r r e e p p r r e e s s s s c c a a k k e e p p r r e e s s e e n n t t .. I I n n c c o o n n t t r r a a s s t t ,, h h e e a a t t i i n n g g o o f f t t h h e e b b l l e e n n d d s s a a t t 114400 C C c c a a u u s s e e d d m m o o r r e e s s e e v v e e r r e e c c o o l l o o u u r r c c h h a a n n g g e e s s ,, w w h h i i c c h h w w a a s s r r e e f f le el c c t t e e d d i i n n d d e e c c r r e e a a s s e e d d L L * ((F F i i g g .. 22A A )) a a n n d d i i n n c c r r e e a a s s e e d d a a * ((F F i i g g .. 22B B )) a a n n d d b b *values (Fig. 2C), demonstrating the pronounced browning during heat-i i n n d d u u c c e e d d M M a a i i l l l l a a r r d d r r e e a a c c t t i i o o n n s s ((M M a a r r u u t t a a ,, 22002211)).. I I t t i i s s i i m m p p o o r r t t a a n n t t t t o o n n o o t t e e t t h h a a t t t t h h e e c c o o l l o o u u r r c c h h a a n n g g e e i i n n d d u u c c e e d d b b y y h h e e a a t t i i n n g g a a t t 114400 ° C C w w a a s s s s i i g g n n i i f f ic ci a a n n t t l l y y m m o o r r e e pronounced at press cake contents below 150 g/kg due to the higher c c o o n n t t e e n n t t s s o o f f l l a a c c t t o o s s e e i i n n t t h h e e s s e e b b l l e e n n d d s s ,, w w h h i i c c h h p p l l a a y y s s a a m m a a j j o o r r r r o o l l e e i i n n M M a a i i l l l l a a r r d d r r e e a a c c t t i i o o n n s s .. A A t t h h i i g g h h e e r r c c o o n n t t e e n n t t s s o o f f p p r r e e s s s s c c a a k k e e (( ≥ 115500 g g //k k g g )),, h h o o w w e e v v e e r r ,, t t h h e e dark colour of the blends changed to a much lesser extent with heating. 33..33..22.. H H e e a a t t --i i n n d d u u c c e e d d c c h h a a n n g g e e s s i i n n t t h h e e d d i i s s t t r r i i b b u u t t i i o o n n o o f f s s o o l l u u b b l l e e a a n n d d i i n n s s o o l l u u b b l le e material in the blends T T h h e e side stream blends were cen side stream blends were cen t t r r i i f f u u g g e e d d b b e e f f o o r r e e a a n n d d a a f f t t e e r r h h e e a a t t t t r r e e a a t t m m e e n n t t t t o o e e v v a a l l u u a a t t e e t t h h e e e e f f f f e e c c t t s s o o f f h h e e a a t t t t r r e e a a t t m m e e n n t t o o n n t t h h e e p p r r o o p p o o r r t t i i o o n n s s o o f f soluble and insoluble material. F ig. 3 shows the relative amounts soluble and insoluble material. Fig. 3 shows the relative amounts o of f sediment after centrifugation of the blends, providing information on the amount of insoluble material as well as its water holding capacity,a a n n d d F F i i g g .. 44 d d e e p p i i c c t t s s t t h h e e n n i i t t r r o o g g e e n n c c o o n n t t e e n n t t s s o o f f t t h h e e w w h h o o l l e e b b l l e e n n d d s s ((~~1177 m m g g //g g for all samples) as for all samples) as w w e e l l l l a a s s o o f f t t h h e e s s e e r r u u m m p p h h a a s s e e s s e e x x p p e e l l l l e e d d b b y y Sunflower Protein : Whey Protein Ratio Press Cake (g/kg) Fig. 3. Relative amount of sediment after centrifugation (3,000 g, 30 min,25 C) of side stream blends with various press cake concentrations and sun-flower protein to whey protein ratios after heat treatment under moderate shear i i n n t t h h e e r r a a p p i i d d v v i i s s c c o o a a n n a a l l y y s s e e r r ((w w h h i i t t e e c c i ir rc c l l e e s s :: u u n n t tr re e a a t t e e d d ,, l l i i g g h h t t g g r r e e y y s s q q u u a a r r e es s :: 8800 °C C ,,dark grey triangles: 120 °C,dark grey triangles: 120 C, b b l l a a c c k k d d i i a a m m o o n n d d s s :: 114400 ° C C )).. A A l l l l b b l l e e n n d d s s h h a a d d a a d d r r y y m m a a t t t t e e r r o o f f 225599 g g //k k g g a a n n d d a a p p r r o o t t e e i i n n c c o o n n t t e e n n t t o o f f 110044 g g //k k g g .. c c e e n n t t r r i i f f u u g g a a t t i i o o n n .. Samples with 0 g/kg press cake showed almost no sedimentation, as these blends contained only whey cons these blends contained only whey cons t t i i t t u u e e n n t t s s ,, w w h h i i c c h h h h a a v v e e a a h h i i g g h h s s o o l l --u u b b i i l l i i t t y y .. H H e e a a t t t t r r e e a a t t m m e e n n t t a a t t 8800 a a n n d d 112200 ° C C s s i i g g n n i i f f ic ci a a n n t t l l y y i i n n c c r r e e a a s s e e d d t t h h e e amount of sediment due to whey protein denaturation and protein cross-l l i i n n k k i i n n g g ((F F i i g g .. 33)).. T T h h i i s s w w a a s s a a l l s s o o r r e e f f le el c c t t e e d d i i n n a a d d e e c c r r e e a a s s e e o o f f t t h h e e n n i i t t r r o o g g e e n n c c o o n n t t e e n n t t i i n n t t h h e e s s u u p p e e r r n n a a t t a a n n t t ((F F i i g g .. 44)),, w w h h i i c c h h s s e e r r v v e e d d a a s s a a n n i i n n d d i i c c a a t t o o r r f f o o r r s s e e r r u u m m p p r r o o t t e e i i n n .. T T o o l l k k a a c c h h a a n n d d K K u u l l o o z z i i k k ((22000077)) s s h h o o w w e e d d t t h h a a t t β --l l a a c c t t o o g g l l o o b b u u l l i i n n is almost completely denatured after heating at 80 C for 5 min. How-ever, this is not necessarily related to a loss in solubility, which requires Fig. 2. Colour parameters L * (A), a* (B), b* (C) of side stream blends with various press cake concentrations and sunflower protein to whey protein ratios after h Fig. 2. Colour parameters L (A), a (B), b (C) of side stream blends with various press cake concentrations and sunflower protein to whey protein ratios after h e e a a t t treatment under moderate shear in the rapid visco analyser (white circles: untreated, light grey squares: 80 C, dark grey triangles: 120 C, black diamonds: 140 C),and colour difference E (D) of heated compared unheated blends. All blends had a dry matter of 259 g/kg and a protein content of 104 g/kg. Fig. 4. Ni t rogen content of Fig. 4.Nitrogen content of s s i i d d e e s s t t r r e e a a m m b b l l e e n n d d s s w w i i t t h h 00 ((w w h h i i t t e e c c i i r r c c l l e e s s )),, 110000 ((l l i i g g h h t t grey squares), 175 (dark grey triangles) or 225 (black diamonds) g/kg press cake and their serum phases extracted by centrifugation (3,000 g, 30 min,25 C) after different heat treatments under moderate shear in the rapid visco analyser. All blends had a dry matter of 259 g/kg and a protein content of 104g/kg. Italic numbers refer to sunflower protein to whey protein ratio g/kg. Italic numbers refer to sunflower protein to whey protein ratio .. m m o o r r e e s s e e v v e e r r e e a a g g g g r r e e g g a a t t i i o o n n t t h h a a t t i i s s f f a a v v o o u u r r e e d d b b y y h h e e a a t t --i i n n d d u u c c e e d d c c r r o o s s s s --l l i i n n k k i i n n g g a a t t h h i i g g h h e e r r t t e e m m p p e e r r a a t t u u r r e e s s .. H H e e a a t t t t r r e e a a t t m m e e n n t t a a t t 114400 ° C C r r e e s s u u l l t t e e d d i i n n a a s s i i g g n n i i f i f --i cantly lower amount of sediment compared to heating at 120 C (Fig. 3),w w h h i i c c h h i i n n t t u u r r n n m m e e a a n n s s a a g g r r e e a a t t e e r r a a m m o o u u n n t t o o f f s s e e r r u u m m e e x x p p e e l l l l e e d d b b y y c c e e n n t t r r i i f f u u --g g a a t t i i o o n n .. T T h h i i s s i i n n d d i i c c a a t t e e s s a a r r e e d d u u c c e e d d w w a a t t e e r r h h o o l l d d i i n n g g c c a a p p a a c c i i t t y y o o f f t t h h e e w w h h e e y y protein aggregates due to more extensive protein cross-linking at 140 C,as the amount of nitrogen in the serum did not change (Fig. 4). I I n n u u n n h h e e a a t t e e d d b b l l e e n n d d s s ,, t t h h e e s s e e d d i i m m e e n n t t a a m m o o u u n n t t i i n n c c r r e e a a s s e e d d s s i i g g n n i i fi f c ci a a n n t t l l y y w w i i t t h h i i n n c c r r e e a a s s i i n n g g p p r r e e s s s s c c a a k k e e c c o o n n t t e e n n t t ((F F i i g g .. 33)) d d u u e e t t o o t t h h e e p p r r e e s s e e n n c c e e o o f f b b o o t t h h i i n n s s o o l l u u b b l l e e f f ib bi r r e e a a n n d d i i n n s s o o l l u u b b l l e e s s u u n n f f lo ol w w e e r r p p r r o o t t e e i i n n s s .. T T h h i i s s w w a a s s a a l l s s o o r r e e f f le el c c t t e e d d i i n n t t h h e e s s i i g g n n i i f f ic ci a a n n t t d d e e c c r r e e a a s s e e i i n n s s e e r r u u m m n n i i t t r r o o g g e e n n w w i i t t h h i i n n c c r r e e a a s s i i n n g g p p r r e e s s s s c c a a k k e e c co o n n t t e e n n t t ,, a a l l t t h h o o u u g g h h t t h h e e w w h h o o l l e e ,, u u n n c c e e n n t t r r i i f f u u g g e e d d b b l l e e n n d d s s s s h h o o w w e e d d n n o o d d i i f f f f e e r r e e n n c ce e ((F F i i g g .. 44)).. A A f f t t e e r r h h e e a a t t t t r r e e a a t t m m e e n n t t a a t t 8800 °C C ,, t t h h e e a a m m o o u u n n t t o o f f s s e e d d i i m m e e n n t t w w a a s s h h i i g g h h e e r r f f o o r r b b l l e e n n d d s s w w i i t t h h ≤ 117755 g g //k k g g p p r r e e s s s s c c a a k k e e ,, w w h h e e r r e e a a s s n n o o s s i i g g n n i i f f ic ci a a n n t t e e f f f f e e c c t t w w a a s s f f o o u u n n d d f f o o r r p p r r e e s s s s c c a a k k e e c c o o n n t t e e n n t t s s o o f f 220000 a a n n d d 222255 g g //k k g g ,, p p o o s s s s i i b b l ly y d d u u e e t t o o t t h h e e i i n n c c r r e e a a s s e e d d f f r r a a c c t t i i o o n n o o f f i i n n s s o o l l u u b b l l e e p p o o l l y y s s a a c c c c h h a a r r i i d d e e s s .. T T h h e e n n i i t t r r o o g g e e n n content in the expelled serum phases also decreased upon heating at Heat treatments at 120 and 140 °C resulted in significantly less Heat treatments at 120 and 140 C resulted in signifciantly less expelled serum and, in turn, significantly higher sediment amounts expelled serum and, in turn, signifciantly higher sediment amounts (Fig. 3). High temperature treatments cause a higher degree of protein denaturation and polysaccharide hydration, thus reducing the amount denaturation and polysaccharide hydration, thus reducing the amount of material in the serum (Fig. 4) and resulting in a greater water holding capacity of the sediment. For all blends containing press cake ( 0 g/kg),there were no differences between the two heating temperatures in there were no differences between the two heating temperatures in terms of sedimentation, and the effect of the press cake content was smal l . Since the amount of fibre present in the blends increased with small. Since the amount of fbire present in the blends increased with increasing press cake content, one would expect a better water holding of the sediment of those blends. It might therefore be hypothes i sed that of the sediment of those blends. It might therefore be hypothesised that the denatured whey proteins have a high water holding capacity, and the denatured whey proteins have a high water holding capacity, and that their substitution with sunflower press cake was compensated due that their substitution with sunfolwer press cake was compensated due to the presence of fibres.to the presence of fbires. The proteins present in the blends and i n the expelled centrifugal The proteins present in the blends and in the expelled centrifugal supernatants were further characterised using denaturing and reducing supernatants were further characterised using denaturing and reducing gel electrophoresis (Fig. 5). Samples containing sunfolwer press cake showed a number of bands corresponding to two major groups of sun-showed a number of bands corresponding to two major groups of sun-flower storage proteins, namely sunflower albumins (SFA; 10-–18 kDa)folwer storage proteins, namely sunfolwer albumins (SFA; 1018 kDa)and helianthinin (Hel). The latter belongs to the protein class of glob-ulins and is an oligomer of 300-–350 kDa composed of six polype ulins and is an oligomer of 300350 kDa composed of six polype p p t t i i d d e e chains with either acidic (30-–44 kDa) or basic (20-–27 kDa) isoe l ectric chains with either acidic (30 44 kDa) or basic (2027 kDa) isoelectric point (G onzalez-P é rez , 2015), which dissociate under reducing and point (Gonzalez-Perez, 2015), which dissociate under reducing and denaturing conditions. Bands at ~50 kDa corresponded to the undis-sociated Hel trimer (7S). Due to similar molar masses, the major whey proteins o-lactalbumin and p-lactoglobulin (14 kDa and 18 kDa,proteins -lactalbumin and -lactoglobulin (14 kDa and 18 kDa,respectively; Farrell Jr. et al., 2004) migrated to a similar position as SFA and could barely be distinguished in the blends. In contrast, bovine serum albumin (66 kDa; F a r r ell J r . et a l ., 2004) was separated from all serum albumin (66 kDa; Farrell Jr. et al., 2004) was separated from all other protein bands. Overall, the gel electrophoresis patterns confirm the findings Overall,on the gel electrophoresis patterns confrim the fnidings on serum nitrogen (F i g .4): with i ncreasing press cake content, less protein serum nitrogen (Fig. 4): with increasing press cake content, less protein was found in the supernatants, and heat treatment further decreased the amount of serum protein, with almost no protein bands detectable in the serum phases of blends treated at 120 and 140 C (Fig. 5). This also confirmed that the 4-–6 mg/g serum nitrogen found in the supernatants confrimed that the 46 mg/g serum nitrogen found in the supernatants after high temperature treatments of the curds corresponded to non-protein nitrogen. Fig. 5 clearly shows that the band intensities of the major whey proteins (o-lactalbumin, β-lactoglobulin, bovine serum major whey proteins ( -lactalbumin, -lactoglobulin, bovine serum BSA B-Lg C-La Fig. 5. Reducing and denaturing gel electrophoresis Fig. 5. Reducing and denaturing gel electrophoresis of side stream blends with different press cake (PC)contents and sunflower protein to whey protein ratios contents and sunflower protein to whey protein ratios (S:W), and their serum phases extracted by centrifu-gation (3,000×g, 30 min, 25°C) after different heat gation (3,000 g, 30 min, 25 C) after different heat treatments under moderate shear in the rapid visco analyser. Different protein fractions are indicated:analyser. Different protein fractions are indicated:BSA -– bovine serum albumin, p-l g-B-lactoglobul i n,BSA bovine serum albumin, -lg -lactoglobulin,α-la - a-lactalbumin, Hel acidic -– helianthinin acidic -la -lactalbumin, Hel acidichelianthinin acidic –polypeptides, Hel basic - helianthinin basic poly-polypeptides, Hel basichelianthinin basic poly-peptides, SFA -– sunflower albumins , Hel 7S -– hel i -peptides, SFAsunflower albumins, Hel 7Sheli-anthinin trimeric subunits. albumin) were similar for the whole blends and the corresponding su-albumin) were similar for the whole blends and the corresponding su-pernatants, i ndicating a high solubility of these proteins. In contrast , al l pernatants, indicating a high solubility of these proteins. In contrast, all major sunfolwer proteins showed weaker band intensities in the super-natants compared to the whole blend, especially the Hel subunits,natants compared to the whole blend, especially the Hel subunits,indicating a poor solubility in water. Heat treatment at 80 C did not indicating a poor solubility in water. Heat treatment at 80 C did not change the composition of sunflower proteins in the serum phase,change the composition of sunfolwer proteins in the serum phase,whereas the intensi t ies of the whey proteins became lower, as is whereas the intensities of the whey proteins became lower, as is consistent with the increase in sediment (Fig. 3) and decrease in serum nitrogen (Fig. 4) of blends containing more whey proteins. In contrast,almost all proteins except for some SFA disappeared from the serum phase after heating at 120 and 140 °C. Interestingly, no high molecular phase after heating at 120 and 140 C. Interestingly, no high molecular weight molecules appeared on the top of the gel, i ndicating that all weight molecules appeared on the top of the gel, indicating that all proteins that were covalently cross-linked during the heat treatment were insoluble. 3.4. Structuring of s 3.4. Structuring of s i i d d e e s s t t r r e e a a m m b b l l e e n n d d s s d d u u r r i i n n g g h h e e a a t t t t r r e e a a t t m m e e n n t t u u n n d d e e r r moderate shear 3.4.1. RVA torque profiles 3.4.1. RVA torque proflies The structural changes occurring in the blends during heating under moderate shear were characterised in more detail by following the moderate shear were characterised in more detail by following the changes in torque measured by the RVA. Fig. 6 shows the temperature prof i les as well as the torque development in selected samples during proflies as well as the torque development in selected samples during heating to 80 (A), 120 (B), or 140 °C (C) and subsequent cooling. The heating to 80 (A), 120 (B), or 140 C (C) and subsequent cooling. The torque is a measure for the resistance of the sample against the constant stirring of the RVA paddle at 160 rpm and can thus be seen as an indi-cator for viscosity changes and a mean to follow structure formation. The initial torque values were in agreement with the bulk viscosities measured using rotational rheometry (F i g .1B), showing higher values measured using rotational rheometry (Fig. 1B), showing higher values with increasing press cake content i n the blends. For all blends with >0with increasing press cake content in the blends. For all blends with 0g/kg press cake, the torque decreased during the initial holding at 30 C,pointing to also thixotropic behaviour in addition to the shear thinning observed for these samples (F ig.1A), and heating first caused a decrease observed for these samples (Fig. 1A), and heating frist caused a decrease in torque, reaching a minimum between 80 and 90 °C. Further heat i ng in torque, reaching a minimum between 80 and 90 C. Further heating had different effects on the blends depending on composition and had different effects on the blends depending on composition and temperature. At 80°C (F ig .6A), t he i nit i al low torque value of the sample with 0g/At 80 C (Fig. 6A), the initial low torque value of the sample with 0 g/kg press cake (~0.04 mN m) increased continuously by more than a factor of 10 to ~0.45 mN m, whereas it remained nearly constant during the holding stage and increased to the original value during cooling for the holding stage and increased to the original value during cooling for the sample with 225 g/kg press cake and without whey proteins. The the sample with 225 g/kg press cake and without whey proteins. The other blends containing both whey proteins and press cake showed an intermediate behaviour between these two samples, with a slight intermediate behaviour between these two samples, with a slight decrease in torque during heating and an increase in torque during cooling to a value greater than the initial torque. torque with a first peak at a temperature of ~120 °C. Two peaks were torque with a frist peak at a temperature of ~120 C. Two peaks were observed in each torque profile, where the second one became more observed in each torque proflie, where the second one became more pronounced with increasing press cake content and was followed by a decrease in torque, with a larger drop for heat treatment at 140decrease in torque, with a larger drop for heat treatment at 140compared to 120 °C. During the cooling stage, there was an increase in compared to 120 C. During the cooling stage, there was an increase in torque due to the formation of hydrogen bonds at lower temperatures.The torque proflie of the sample with 225 g/kg press cake treated at 120°C does not seem to match this general pattern. However, i t has to be 120 C does not seem to match this general pattern. However, it has to be pointed out that the repeatability of this measurement was poorer than for the other treatments, especially after reaching the frist peak, and while the second peak could be observed in some of the individual measurements, it was evened out when averaging all curves. This might have been due to the very high peak viscosity, possibly resulting in an unstable measurement signal due to an inhomogeneous folw within the sample. Remarkably, the final samples showed only small deviations sample. Remarkably, the fnial samples showed only small deviations wi t h regard to colour (F i g. 2), i nsoluble material (Fi g. 3), and serum with regard to colour (Fig. 2), insoluble material (Fig. 3), and serum nitrogen (Fig. 4).nitrogen (Fig. 4). The RVA has been extensively used to study the pasting and gelati-nisation of starch suspensions, for which different parameters such as peak viscosity, breakdown viscosity, and setback have been defined and peak viscosity, breakdown viscosity, and setback have been defnied and related to structural changes in the starch granules and interactions related to structural changes in the starch granules and interactions between the starch molecules (Balet, Guelpa, Fox, & Manley, 2019). In the current study, however, starch was a minor component, accounting for only ~11 g/kg of the original press cake material (Tab l e 1) and thus for only ~11 g/kg of the original press cake material (Table 1) and thus –for 02.5 g/kg in the different blends. Proteins, which accounted for 104g/kg in the blends, are known to form elastic gel networks du g/kg in the blends, are known to form elastic gel networks du r r i i n n g g heating due to non-covalent i nteracti heating due to non-covalent interacti o o n n s s ((e e ..g g ..,, h h y y d d r r o o p p h h o o b b i i c c ,, h h y y d d r r o o g g e e n n bonds) and covalent disulphide bonds, even at lower concentrations (Nicolai, 2019). Treatments that are more severe in terms of heating time and/or temperature can also result in covalent proteins cross-links deriving from advanced Mai l lard reaction products, which can addi -deriving from advanced Maillard reaction products, which can addi-tionally contribute to the gel network (H ann B ß , Hu bbe , & Hen l e, 2018).tionally contribute to the gel network (Hann, Hubbe, & Henle, 2018). However, the RVA has also been used to evaluate protein-rich sys-tems such as processed cheese, were changes in viscosity at 80tems such as processed cheese, were changes in viscosity at 80 ° C C w w e e r r e e related to hydration and oil uptake of the casein proteins (K apo o r,related to hydration and oil uptake of the casein proteins (Kapoor,Lehtola , & M e t zge r, 2004; Kap oo r & M Lehtola,Metzger,et zge r , 2005). Furt & 2004; Kapoor & Metzger, 2005). Furt h h e e r r m m o o r r e e ,,heat-induced structure formation in blends of whey proteins and starch heat-induced structure formation in blends of whey proteins and starch were studied using the RVA, showing a shift from starch-dominated networks to whey protein-dominated networks with inc networks reasing con- to whey protein-dominated networks with increasing con-tent of whey proteins (Sopade, Hardin, Fitzpatrick, Desmee, & Halley,2006). T he authors , however, pointed out that complementary methods 2006). The authors, however, pointed out that complementary methods are crucial to be able to relate the torque profiles obtained from the RVA are crucial to be able to relate the torque proflies obtained from the RVA to the heat-induced structure forming behaviour of biomacromolecule blends. Therefore, the blends were analysed also by gel electrophoresis blends. Therefore, the blends were analysed also by gel electrophoresis and CLSM at different time points of the treatment. E Z E Time (min) Fig. 6. Temperature profiles (grey curves ) and torque development (black curves) of side stream blends with 0 (dotted lines), 100 (dashed l i nes), 175 (d Fig. 6. Temperature proflies (grey curves) and torque development (black curves) of side stream blends with 0 (dotted lines), 100 (dashed lines), 175 (d o o t t t t e e d d d d a a s s h h e e d d lines), and 225 g/kg press cakes (full lines) during heat treatment under moderate shear in the rapid visco analyser. Peak temperature were 80 (A), 120 (B), or 140 C (C). All blends had a dry matter of 259 g/kg and a protein content of 104 g/kg. 3.4.2. Protein pro 3.4.2. Protein pro fi f l l e ie o o f f t t h h e e p p r r e e s s s s c c a a k k e e b b l l e e n n d d s s a a t t d d i i f f f f e e r r e e n n t t s s t t a a g g e e s s o o f f h h e e a a t t i i n n g g To evaluate the formation of protein cross-l inks during heating, the To evaluate the formation of protein cross-links during heating, the blends were analysed for their protein composition at various stages of the treatments in the RVA. The selected time points corresponded to the first local minimum (10 min), the first and second peak, the second local frist local minimum (10 min), the frist and second peak, the second local minimum, and the end point in the RVA curves (see Fig. 6). Fig. 7 shows exemplarily the reducing gel electrophoresis patterns of the blends exemplarily the reducing gel electrophoresis patterns of the blends containing 175 g/kg press cake (78:22 sunflower protein to whey pro-containing 175 g/kg press cake (78:22 sunfolwer protein to whey pro-tein ratio) taken before and at different time points during heat treat-tein ratio) taken before and at different time points during heat treat-ment at 80, 120 or 140 °C in the RVA. Heating at 80 °C barely affected ment at 80, 120 or 140 C in the RVA. Heating at 80 C barely affected the protein proflie of the blend, suggesting that interactions were mainly non-covalent ones as well as disulphide bonds, which were disrupted by non-covalent ones as well as disulphide bonds, which were disrupted by the addi t ion of the reducing agent. Samples treated at 120 a the addition of the reducing agent. Samples treated at 120 a n n d d 114400 ℃C ,,however, showed decreased band intensities of the monomeric proteins and increased intensities of high molar mass polymers appearing at the top of the gel, which were most likely a result of covalent protein cross-linking at high temperatures. Heat treatment at 140 °C caused a more linking at high temperatures. Heat treatment at 140 C caused a more pronounced decrease of monomeric proteins, indicating a greater extent of polymerisation due to covalent cross-linking of proteins, which is in line with the more pronounced change in colour due to Maillard re-actions (Fig. 2). In both cases, 120 and 140°C, high molar mass poly-actions (Fig. 2). In both cases, 120 and 140 C, high molar mass poly-mers were already noticeable in samples taken from the RVA at the frist peak in the torque profile , but appeared even more clearly at the second peak in the torque proflie, but appeared even more clearly at the second peak in the torque prof i le, indicating the onset of the Maillard-type peak in the torque proflie, indicating the onset of the Maillard-type cross-linking of the proteins. Remarkably, a considerable amount of proteins in the blends heated at 120 and 140°C was stil l detected in their proteins in the blends heated at 120 and 140 C was still detected in their monomeric form, although no monomeric proteins were found in the respective serum phases (Fig. 5). This indicates that the proteins in the curd were largely cross-linked by disulphide bonds, which were dis-rupted in gel electrophoresis by a reducing agent.rupted in gel electrophoresis by a reducing agent. 3.4.3. Microstructure of the press cake blends at different stages of heating The microstructure of the side stream blend with 175 g/kg press cake (78:22 sunflower protein to whey protein ratio) before and at di f ferent (78:22 sunfolwer protein to whey protein ratio) before and at different time points of heat treatment at 80, 120, or 140 C is shown in Fig. 8A.Only the proteins were stained and visualised in green. The unheated Fig. 7. Reducing and denaturing gel electrophoresis of side stream blends with Fig. 7. Reducing and denaturing gel electrophoresis of side stream blends with 175 g/kg press cake (78:22 sunflower protein to whey p 175 g/kg press cake (78:22 sunflower protein to whey p r r o o t t e e i i n n )) a a t t d d i i f f f f e e r r e e n n t t t t i i m m e e points during heat treatment at 80, 120 or 140 °C under moderate shear in the points during heat treatment at 80, 120 or 140 C under moderate shear in the rapid visco analyser. Different protein fractions are indicated: BSA -– bovine rapid visco analyser. Different protein fractions are indicated: BSA bovine serum albumin, WP -– whey proteins (B-lactoglobulin and o-l actalbumin), Hel serum albumin, WPwhey proteins ( -lactoglobulin and -lactalbumin), Hel acidic -– helianthinin acidic polypeptides, Hel basic -– helianthinin basic poly-acidichelianthinin acidic polypeptides, Hel basichelianthinin basic poly-peptides, SFA -– sunflower albumins, Hel 7S -– helianthinin trimeric subunits.peptides, SFAsunflower albumins, Hel 7Shelianthinin trimeric subunits. blend was a rather heterogeneous suspension of small protein particles with various sizes, which were dispersed in the aqueous, fibre-with various sizes, which were dispersed in the aqueous, fbire-containing matrix. The treatment at 80 °C affected the microstructure containing matrix. The treatment at 80 C affected the microstructure only marginally, and no effect of shear was noticeable. In contrast, large protein aggregates of 10-–100 um were observed for heat treatment at protein aggregates of 10100 m were observed for heat treatment at 120 and 140 C, where no effect of the heating temperature and no 120 and 140 C, where no effect of the heating temperature and no difference between samples taken from the RVA at the frist peak and at the end could be noticed. The microstructure of blends heat treated without shear was, however, considerably different, showing a dense,homogeneous gel network. The effect of shear on the heat-induced homogeneous gel network. The effect of shear on the heat-induced formation of protein micr formation oparticles wa of protein microparticles wa s s a a l l s s o o s s t t u u d d i i e e d d i i n n t t h h e e p p a a s s t t ,,particularly with regard to microparticulated whey proteins (E rabit ,particularly with regard to microparticulated whey proteins (Erabit,F l i c k , & A lv a r e z , 2014; Ta n g e r, Ra mo s, & Kul o z i k , 2021). Fig . 8B Flick, & Alvarez, 2014; Tanger, Ramos, & Kulozik, 2021). Fig. 8B compares the microstructures of side stream blends containing 100, 175,or 225 g/kg press cake and heated at 120 °C under moderate shear. With or 225 g/kg press cake and heated at 120 C under moderate shear. With increasing press cake content, the protein aggregates seemed more increasing press cake content, the protein aggregates seemed more compact and showed a more defined surface structure, whereas at 100compact and showed a more defnied surface structure, whereas at 100g/kg press cake, the aggregates seemed bigger with a less homogeneous surface. This is most likely a consequence of the increased f ibre content surface. This is most likely a consequence of the increased fbire content with i ncreasing press cake concentration, as the fibres wil l compete with with increasing press cake concentration, as the fbires will compete with the proteins for water, leaving the protein aggregates less hydrated the proteins for water, leaving the protein aggregates less hydrated compared to blends with lower fbire content. 3.5. Proposed mechanism for structure formation during heat treatment under moderate shear under moderate shear From these results, the following mechanisms for structure formation during heat treatment of the side stream blends under moderate shear might be proposed (F ig . 9).might be proposed (Fig. 9). Heat treatment at 80 C mainly had an impact on the whey proteins,which were denatured and partly aggregated through cross-linking by which were denatured and partly aggregated through cross-linking by disulphide bonds,leading to an increased sample viscos i ty (F ig. 6A) and disulphide bonds, leading to an increased sample viscosity (Fig. 6A) and higher amounts of sedimentable material of blends with higher whey protein content and less press cake (Fig. 3). On the other hand, the treatment had only minor effects on the sunflower press cake, as th treatment had only minor effects on the sunfolwer press cake, as th e e starch content was too low to cause major changes in sample viscosity with heating, and the majority of the sunflower proteins were already with heating, and the majority of the sunfolwer proteins were already insoluble before the treatment (Fig . 4).insoluble before the treatment (Fig. 4). The high temperature treatments, however, caused severe changes to the sample. A steep increase in torque induced at temperatures of >85°C the sample. A steep increase in torque induced at temperatures of 85 C indicated pronounced protein denaturation and aggregation (Fig. 6B and C). The first peak in torque was reached at around 120 °C for both and C). The frist peak in torque was reached at around 120 C for both high temperature treatments, and was followed by a second peak, which became more pronounced with increasing press cake content, suggesting that this second peak was somehow related to the fbires in the press cake. Assuming that the initial increase in torque was solely related to protein denaturation and aggregation, the f irst peak might be due to a protein denaturation and aggregation, the frist peak might be due to a loss in the water holding capacity of the protein particles, thereby loss in the water holding capacity of the protein particles, thereby decreasing their volume fraction and reducing the serum viscosity. As shown in Fig. 7, there was a considerable increase in high molecular weight protein polymers between the first and second peak in the RVA weight protein polymers between the frist and second peak in the RVA torque proflie, suggesting severe covalent protein cross-linking in this stage of the treatment. This might have resulted in a compacting of the protein particles and thus a loss of water, which could then have been protein particles and thus a loss of water, which could then have been taken up by the fbires, resulting in an increase in bulk viscosity and thus the second peak in the torque profiles (Fi g. 6B and C). A competi t ion for the second peak in the torque proflies (Fig. 6B and C). A competition for water between the protein particles and the fibres was also i ndicated by water between the protein particles and the fbires was also indicated by the micrographs, which showed more compact protein particles in the micrographs, which showed more compact protein particles in blends with higher fbire content (Fig. 8B). The second peak maximum was reached even before the cooling stage, followed by a decrease in the was reached even before the cooling stage, followed by a decrease in the torque signal. No differences in the microstructure of the samples taken out at different times of the treatment were found using CLSM, indi-cating that this drop in viscosity is related to structural changes at cating that this drop in viscosity is related to structural changes at smaller length scales. This could, for instance, be a transition of the polysaccharide fraction from crystall i ne to amorphous structures. When polysaccharide fraction from crystalline to amorphous structures. When entering the cooling stage, the torque signal increased again, indicating No Heat 80°C 120°C 200pm 200um 200 pm Fig. 8. Confocal laser scanning microscopy of (A) side streams blends with 175 g/kg press cake at di f ferent time points during heat treatment at 80, 120 or 140°C Fig. 8. Confocal laser scanning microscopy of (A) side streams blends with 175 g/kg press cake at different time points during heat treatment at 80, 120 or 140 C with or without moderate shear in the rapid visco analyser, and of (B) side stream blends with different press cake concentrations at the end of heat treatment at 120°C under moderate shear. Numbers in brackets refer to sunflower protein to whey protein ratio.120 C under moderate shear. Numbers in brackets refer to sunflower protein to whey protein ratio. properties of whey proteins compared to both sunfolwer proteins and fbires. an increase in viscosity due to swelling of the protein particles and fbires (de Kruif et al., 2015) as well as the formation of hydrogen bonds. The torque (Fig. 6) at the end of the process relative to the torque at the beginning of the heating ramp was higher at press cake contents of ≤175 g/kg (78:22 sunflower protein to whey protein ratio), meaning a 175 g/kg (78:22 sunfolwer protein to whey protein ratio), meaning a greater relative viscosity increase in systems containing more whey greater relative viscosity increase in systems containing more whey proteins and less press cake. This could be due to the better gelling 4. Conclusions 4. Conclusions This study described the structure formation in different blends of This study described the structure formation in different blends of sunflower press cake and whey ingredients with sunfolwer press cake and whey ingredients with e e q q u u a a l l d d r r y y m m a a t t t t e e r r a a n n d d > Whey proteins are mainly non- Fig. 9. Proposed mechanism for structure formation during heat t reatment of side stream blends under moderate shear.Fig. 9. Proposed mechanism for structure formation during heat treatment of side stream blends under moderate shear. Legend protein content but different press cake contents during heat and shear treatment performed in the RVA. The results suggested a complex treatment performed in the RVA. The results suggested a complex interplay of protein denaturation and aggregation and fbire swelling and breakdown. I t seemed that the whey proteins were general l y more breakdown. It seemed that the whey proteins were generally more capable of i ncreasing the apparent viscosity of the blends due to their capable of increasing the apparent viscosity of the blends due to their heat-induced gelling, whereas the f ibres in the press cake contributed heat-induced gelling, whereas the fbires in the press cake contributed more to the overall apparent viscosity. Heat treatment at 120°C seemed more to the overall apparent viscosity. Heat treatment at 120 C seemed most favourable in terms of viscosity development, phase stability, and colour stability. The resul t s of this study wi l l help valorising these two colour stability. The results of this study will help valorising these two food processing side streams in future food processing side streams in future ,, s s u u s s t t a a i i n n a a b b l l e e f f o o o o d d a a p p p p l l i i c c a a t t i i o o n n s s ,, a a s s it provides a detailed understanding of the systems.Future in-it provides a detailed understanding of the systems.Future in-vestigations wil l include the fermentation of the heated side stream vestigations will include the fermentation of the heated side stream blends using co-cultures of lactic acid bacteria and yeast strains (Man-g ier i e t a l ., 2022), which will increase their microbial stability and gieri et al., 2022), which will increase their microbial stability and enhance their sensory properties, fostering the development of sus-enhance their sensory properties, fostering the development of sus-tainable food applications.tainable food applications. Funding The authors acknowledge the f inancial support for this project pro-The authors acknowledge the fniancial support for this project pro-vided by translational funding bodies, partners of the H2020 ERA-NETs SUSFOOD2 and CORE Organic Cofunds, under the Joint SUSFOOD2/CORE Organic Call 2019. The national partner organisation was the CORE Organic Call 2019. The national partner organisation was the Ministry of Food, Agriculture and Fisheries of Denmark.Ministry of Food, Agriculture and Fisheries of Denmark. Additional funding was received from Novo Nordisk Fonden (grant number NNF21OC0071375) for NR, and from Villum Fonden (grant number 37759) for MC. Credit authorship statement Credit authorship statement Norbert Raak: Conceptualization; Methodology; Validation; Formal Norbert Raak: Conceptualization; Methodology; Validation; Formal analysis; Investigation; Data curation; Writing-– original draft; Visuali-analysis; Investigation; Data curation; Writingoriginal draft; Visuali-zation. Milena Corredig: Conceptualization; Methodology; Resources;zation. Milena Corredig: Conceptualization; Methodology; Resources;–Writingreview & editing; Supervision; Project administration; Fund-ing acquisition.ing acquisition. Declaration of competing interest The authors declare that they have no known competing financial The authors declare that they have no known competing fniancial interests or persona l relationships that could h interests or personal relationships that could h a a v v e e a a p p p p e e a a r r e e d d t t o o i i n n f f lu ul e e n n c c e e the work reported in this paper. Data availability Data will be made available on request. Acknowledgements Acknowledgements The authors kindly thank Schalk Mühle Gmbh & Co KG (Ilz, Austria)for donating the sunfolwer press cake, Bayerische Milchindustrie eG (Palting, Germany) for gifting the sweet whey powder, and Arla Foods (Palting, Germany) for gifting the sweet whey powder, and Arla Foods Amba (Viby, Denmark) for providing the whey protein concentrate and skim milk. Special thanks go to Laura Roman Rivas, Kubra Tarin, and Rita Albrechtsen (Department of Food Science, Aarhus University) for Rita Albrechtsen (Department of Food Science, Aarhus University) for support in the laboratory work. References th AACC. (2015). Approved methods of the American association of cereal chemists (11 ed.).St. Paul, Minnesota: American Association of Cereal Chemists . Aiking, H. (2011). Future protein supply. Trends in Food Science & Technology, 22,–112120. https://doi.org/10.1016/j.tifs.2010.04.005 Alves, A. C., & Tavares, G. M. (2019). Mixing animal and plant proteins: Is this a way to improve protein techno-functionalities? Food Hydrocolloids, 97, Article 105171.https://doi.org/10.1016/j.foodhyd.2019.06.016 Ancuța, P., & Sonia, A. (2020). Oil press-cakes and meals valorization through circular economy approaches: A review. Applied Sciences, 10, 7432. https://doi.org/10.3390/app10217432 Arrutia, F., Binner, E., Williams, P., & Waldron, K. W. (2020). Oilseeds beyond oil: Press cakes and meals supplying global protein requirements. Trends in Food Science &Technology, 100, 88-–102. h t tps://d o i .o rg/10.1016/j .ti fs.2020.03.044Technology, 100, 88102. https://doi.org/10.1016/j.tifs.2020.03.044 Avelar, Z., Rodrigues, R. M., Pereira, R. N., & Vicente, A. A. (2022). Future food —–proteinstrends and perspectives. In Future foods (pp. 267285). Elsevier. https://doi.org/10.1016/B978-0-323-91001-9.00007-4. Balet, S., Guelpa, A., Fox, G., & Manley, M. (2019). Rapid visco analyser (RVA) as a tool for measuring starch-related physiochemical properties in cereals: A review. Food –Analytical Methods, 12, 23442360. https://doi.org/10.1007/s12161-019-01581-w arta, J., Bartova, V., Jarosova, M., Svajner, J., Smetana, P., Kadlec, J., et al. (2021).Oi l seed cake flour composition, functional properties and antioxidant potential as Oilseed cake folur composition, functional properties and antioxidant potential as effects of sieving and species differences. Foods, 10, 2766. https://doi.org/10.3390/ foods10112766 Corredig, M., Young, N., & Dalsgaard, T. K. (2020). Food proteins: Processing solutions –and challenges. Current Opinion in Food Science, 35, 4953. https://doi.org/10.1016/j.cofs.2019.12.010 Dikeman, C. L., & Fahey, G. C., Jr. (2006). Viscosity as rel Dikeman, C. L., & Fahey, G. C., Jr. (2006). Viscosity as rel a a t t e e d d t t o o d d i i e e t t a a r r y y f f ib bi r r e e :: A A r r e e v v i i e e w w ..Critical Reviews i n Food Science and Nutrition, 46, 649-–663. h t t ps ://d o i .org/10.1080/Critical Reviews in Food Science and Nutrition, 46, 649663. https://doi.org/10.1080/10408390500511862 Dubois, M., Gilles, K. A., Hamilton, J. K., Rebers, P. A., & Smith, F. (1956). Colorimetric method for determination of sugars and related substances. Analytical Chemistry, 28,–350356. Erabit, N., Flick, D., & Alvarez, G. (2014). Formation of -lactoglobulin aggregates during thermomechanical treatments under controlled shear and temperature conditions.Journal of Food Engineering, 120, 57-–68. ht tp s://doi.org /10.1016/j.Journal of Food Engineering, 120, 5768. https://doi.org/10.1016/j. jfoodeng.2013.07.003 Farrell, H. M., Jr., Jimenez-Flores, R., Bleck, G. T., Brown, E. M., Butler, J. E.,Creamer, L. K., et al. (2004). Nomenclature of the proteins of cows ’ ’ m i l k ——sixth Creamer, L. K., et al. (2004). Nomenclature of the proteins of cows milk sixth revision. Journal of Dairy Science, 87(6), 1641-–1674. h t tps://do i .or g /10.3168/j ds.revision. Journal of Dairy Science, 87(6), 16411674. https://doi.org/10.3168/jds. S0022-0302(04)73319-6 Fi l ho, J. G., & Egea, M. B. (2021). Sunflower seed byproduct and its fracti Filho, J. G., & Egea, M. B. (2021). Sunfolwer seed byproduct and its fracti o o n n s s f f o o r r f f o o o o d d application: An attempt to improve the sustainability of the oil process. Journal of Food Science, 86(5), 1497-–1510. htt ps://d o i .o r g/10.1111/1750-3841.15719Food Science, 86(5), 14971510. https://doi.org/10.1111/1750-3841.15719 Gonzalez-Perez, S. (2015). In E. Martínez-Force, N. T. Dunford, & J. J. Salas (Eds.),Sunfolwer proteins. Elsevier. https://doi.org/10.1016/B978-1-893997-94-3.50018-0.Sunfilower (pp. 331-–393).Sunfolwer (pp. 331393). van der Goot, A. J., Pelgrom, P. J. M., Berghout, J. A. M., Geerts, M. E. J., Jankowiak, L.,Hardt, N. A., et al. (2016). Concepts for further sustainable production of foods.Journal of Food Engineering, 168, 42-–51. ht tp s://doi.org /10.1016/j .Journal of Food Engineering, 168, 4251. https://doi.org/10.1016/j. jfoodeng.2015.07.010 Guo, S., Klinkesorn, U., Lorjaroenphon, Y., Ge, Y., & Jom, K. N. (2021). Effects of germination temperature and time on metabolite proflies of sunfolwer (Helianthus –annus L.) seed. Food Science and Nutrition, 9, 2810-2822. htt ps://d oi.o r g /10.1002/annus L.) seed. Food Science and Nutrition, 9, 2810 2822. https://doi.org/10.1002/ fsn3.1983 ßHann, M., Hubbe, N., & Henle, T. (2018). Acid-induced gelation of caseins glycated with –lactoseimpact of maillard reaction-based glycoconjugation and protein cross-linking. Journal of Agricultural and Food Chemistry, 66, 11477-–11485. h t tps ://d o i .linking. Journal of Agricultural and Food Chemistry, 66, 1147711485. https://doi.o r g/10.1021/a cs .j a f c.8b04176org/10.1021/acs.jafc.8b04176 Jimenez-Munoz, L. M., Tavares, G. M., & Corredig, M. (2021). Design future foods using plant protein blends for best nutritional and technological functionality. Trends in Food Science & Technology, 113, 139-–150. htt ps ://d o i .or g/10.10Food Science & Technology, 113, 139 150. https://doi.org/10.101166//j j ..t i fs .2021.04.049 tifs.2021.04.049 Kapoor, R., Lehtola, P., & Metzger, L. E. (2004). Comparison of pilot-scale and rapid visco –analyser process cheese manufacture. Journal of Dairy Science, 87, 28132821.https://doi.org/10.3168/jds.S0022-0302(04)73409-8 Kapoor, R., & Metzger, L. E. (2005). Small-scale manufacture of process cheese using a –rapid visco analyser. Journal of Dairy Science, 88, 33823391. https://doi.org/10.3168/jds.S0022-0302(05)73022-8 Karefyllakis, D., Octaviana, H., van der Goot, A. J., & Nikiforidis, C. V. (2019). The emulsifying performance of mildly derived mixtures from sunflower seeds. Food emulsifying performance of mildly derived mixtures from sunfolwer seeds. Food –Hydrocolloids, 88, 7585. https://doi.org/10.1016/j.foodhyd.2018.09.037 de Kruif, C. G., Bhatt, H., Anema, S. G., & Coker, C. (2015). Rheology of caseinate fractions in relation to their water holding capacity. Food Hydrocolloids, 51,–503511. https://doi.org/10.1016/j.foodhyd.2015.05.026 Lai, K. P., Steffe, J. F., & Ng, P. K. W. (2000). Average shear rates in the rapid visco analyser (RVA) mixing system. Cereal Chemistry, 77. https://doi.org/10.1094/C C HEM .2000.77.6.714,714-–176.CCHEM.2000.77.6.714, 714176. Lie-Piang, A., Braconi, N., Boom, R. M., & van der Padt, A. (2021). Less refnied ingredient s have lower environmental impact -– a l i fe cycle assessment of protein-ingredients have lower environmental impacta life cycle assessment of protein-rich ingredients from oil- and starch-bearing crops. Journal of Cleaner Production,292, Article 126046. https://doi.org/10.1016/j.jclepro.2021.126046 Lund, M. N., & Ray, C. A. (2017). Control of maillard reactions in foods: Strategies and –chemical mechanisms. Journal of Agricultural and Food Chemistry, 65, 45374552.https://doi.org/10.1021/acs.jafc.7b00882 Mangieri, N .,Ambrosini , D., Baroffio, S., Vigentini , I ., Foschino, R., & De Noni, I . (2022)Mangieri, N., Ambrosini, D., Baroffoi, S., Vigentini, I., Foschino, R., & De Noni, I. (2022).V V a a l l o o r r i i s s a a t t i i o o n n o o f f b b o o v v i i n n e e s s w w e e e e t t w w h h e e y y a a n n d d s s u u n n f f lo ol w w e e r r p p r r e e s s s s c c a a k k e e b b l l e e n n d d t t h h r r o o u u g g h h controlled fermentation as platform for innovative food materials. Foods, 11, 1417.https://doi.org/10.3390/foods11101417 Maruta, M. (2021). Browning and pigmentation in food through the Maillard reaction.–Glucoconjugate Journal, 38, 283291. https://doi.org/10.1007/s10719-020-09943-x Mirabella, N., Castellani, V., & Sala, S. (2014). Current options for the valorization of –food manufacturing waste: A review. Journal of Cleaner Production, 65, 2841.https://doi.org/10.1016/j.jclepro.2013.10.051 Nachtigall, C., Surber, G., Herbi, F., Wefers, D., Jaros, D., & Rohm, H. (2020). Production and molecular structure of heteropolysaccharides from two lactic acid bacteria.Carbohydrate Polymers, 236, Article 116019. https://doi.org/10.1016/j. carbpol.2020.116019 Nasrollahzadeh, F., Roman, L., Swaraj, V. J. S., Ragavan, K. V., Vidal, N. P.,Dutcher, J. R., et al. (2022). Hemp (Cannabis sativa L.) protein concentrates from wet and dry industrial fractionation: Molecular properties, nutritional composition, and anisotropic structuring. Food Hydrocolloids. , Article 107755. https://doi.org/10.1016/j.foodhyd.2022.107755 Nicolai, T. (2019). Gelation of food protein-protein mixtures. Advances in Colloid and I nterface Science, 270, 147-–164. h t tp s://d o i.o r g /10.1016/j .c i s.2019.06.006Interface Science, 270, 147164. https://doi.org/10.1016/j.cis.2019.06.006 Pitkowski, A., Durand, D., & Nicolai, T. (2008). Structure and dynamical mechanical properties of suspensions of sodium caseinate. Journal of Colloid and Interface Science,326, 96-–102. htt ps://d o i .or g/10.1016/j .j c i s .2008.07.003326, 96102. https://doi.org/10.1016/j.jcis.2008.07.003 Prandi, B., Faccini, A., Lambertini, F., Bencivenni, M., Jorba, M., Van Droogenbroek, B.,et al. (2019). Food wastes from agrifood industry as possible sources of proteins: A detailed molecular view on the composition of the nitrogen fraction, amino acid proflie and racemisation degree of 39 food waste streams. Food Chemistry, 286,–567575. https://doi.org/10.1016/j.foodchem.2019.01.166 Purwanti, N., Smiddy, M., van der Goot, A. J., de Vries, R., Alting, A., & Boom, R. (2011).Modulation of rheological properties by heat-induced aggregation of whey protein solution. Food Hydrocolloids, 25, 1482-–1489. h t tps ://doi.org/10.1016/j .solution. Food Hydrocolloids, 25, 1482 1489. https://doi.org/10.1016/j.foodhyd.2011.02.027 foodhyd.2011.02.027 Raak, N., Abbate, R. A., Alkhalaf, M., Lederer, A., Rohm, H., & Jaros, D. (2020).Concentration-triggered liquid-to-solid transition of sodium caseinate suspensions as a function of temperature and enzymatic cross-linking. Food Hydrocolloids, 101,Article 105464. https://doi.org/10.1016/j.foodhyd.2019.105464 Raak, N., & Corredig, M. (2022). Kinetic aspects of casein micelle cross-linking by transglutaminase at different volume fractions. Food Hydrocolloids, 128, Article 107603. https://doi.org/10.1016/j.foodhyd.2022.107603 Raak, N., Struck, S., Jaros, D., Hernando, I., Giilseren, I ., Michalska-C i echanowska, A.,Raak, N., Struck, S., Jaros, D., Hernando, I., Gülseren, I., Michalska-Ciechanowska, A.,et al. (2022). Blending side streams. A potential solution to reach a resource effciient, circular, zero-waste food system. Future Foods, 6, Article 100207. https:// doi.org/10.1016/j.fufo.2022.100207 Raak, N., Symmank, C., Zahn, S., Aschemann-Witzel, J., & Rohm, H. (2017). Processing-and product-related causes for food waste and implications for the food supply chain. Waste Management, 61, 461-–472. h tt ps://d o i .or g/10.1016/j .chain. Waste Management, 61, 461472. https://doi.org/10.1016/j.wasman.2016.12.027 Smithers, G . W. (2015). Whey-ing up the options –-yesterday, today and tomorrow.Smithers, G. W. (2015). Whey-ing up the optionsyesterday, today and tomorrow.–International Dairy Journal, 48, 214. https://doi.org/10.1016/j.idairyj.2015.01.011 Sopade, P. A., Hardin, M., Fitzpatrick, P., Desmee, H., & Halley, P. (2006). Macromolecular interactions during gelatinisation and retrogradation in starch-whey systems as studied by rapid visco-analyser. International Journal of Food Engineering, 2, 7. https://doi.org/10.2202/1556-3758.1074 Tanger, C., Ramos, P. Q., & Kulozik, U. (2021). Comparative assessment of thermal aggregation of whey, potato, and pea protein under shear stress for microparticulation. ACS Food Science & Technology, 1, 975-–985. htt p s://doi.org /microparticulation. ACS Food Science & Technology, 1, 975985. https://doi.org/10.1021/acsfoodscitech.1c00104 Tolkach, A., & Kulozik, U. (2007). Reaction kinetic pathway of reversible and irreversible thermal denaturation of β-lactoglobulin. Le Lait, 87, 301-–315. h t tps://do i.o rg /thermal denaturation of -lactoglobulin. Le Lait, 87, 301315. https://doi.org/10.1051/lait:2007012 Vidal, N. P., Roman, L., Swaraj, V. J. S., Ragavan, K. V., Simsek, S., Rahimi, J., et al.(2022). Enhancing the nutritional value of cold-pressed oilseed cakes through extrusion cooking. Innovative Food Science & Emerging Technologies, 77, Article 102956. https://doi.org/10.1016/j.ifset.2022.102956 Zhang, T., Dou, W., Zhang, X., Zhao, Y., Zhang, Y., Jiang, L., et al. (2021). The development history and recent updates on soy protein-based meat alternatives.Trends in Food Science and Technolology, 109, 702-–710. htt ps://d o i .o rg /10.1016/j .Trends in Food Science and Technolology, 109, 702710. https://doi.org/10.1016/j.tifs.2021.01.060
关闭-
1/12

-
2/12
还剩10页未读,是否继续阅读?
继续免费阅读全文产品配置单
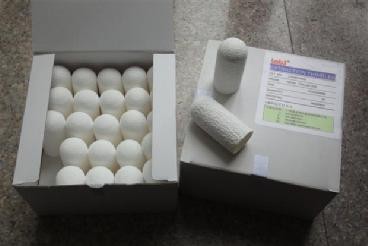

中国格哈特为您提供《葵花籽压榨饼蛋白质和脂肪含量,干酪乳清蛋白质含量的检测》,该方案主要用于其他食品中营养成分检测,参考标准《GB 5009.5 食品安全国家标准 食品中蛋白质的测定》,《葵花籽压榨饼蛋白质和脂肪含量,干酪乳清蛋白质含量的检测》用到的仪器有格哈特杜马斯定氮仪DT N Pro、格哈特全自动超级水解脂肪测定系统HT6、格哈特全自动快速索氏提取SOXTHERM、格哈特快速干燥仪STL56、滤纸筒、德国移液器MM。
我要纠错


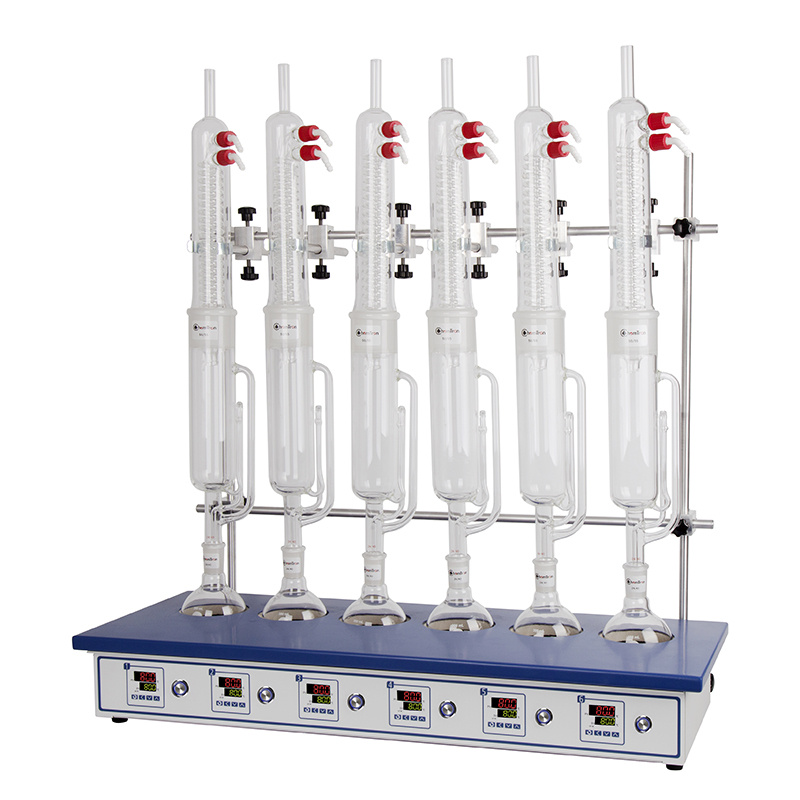

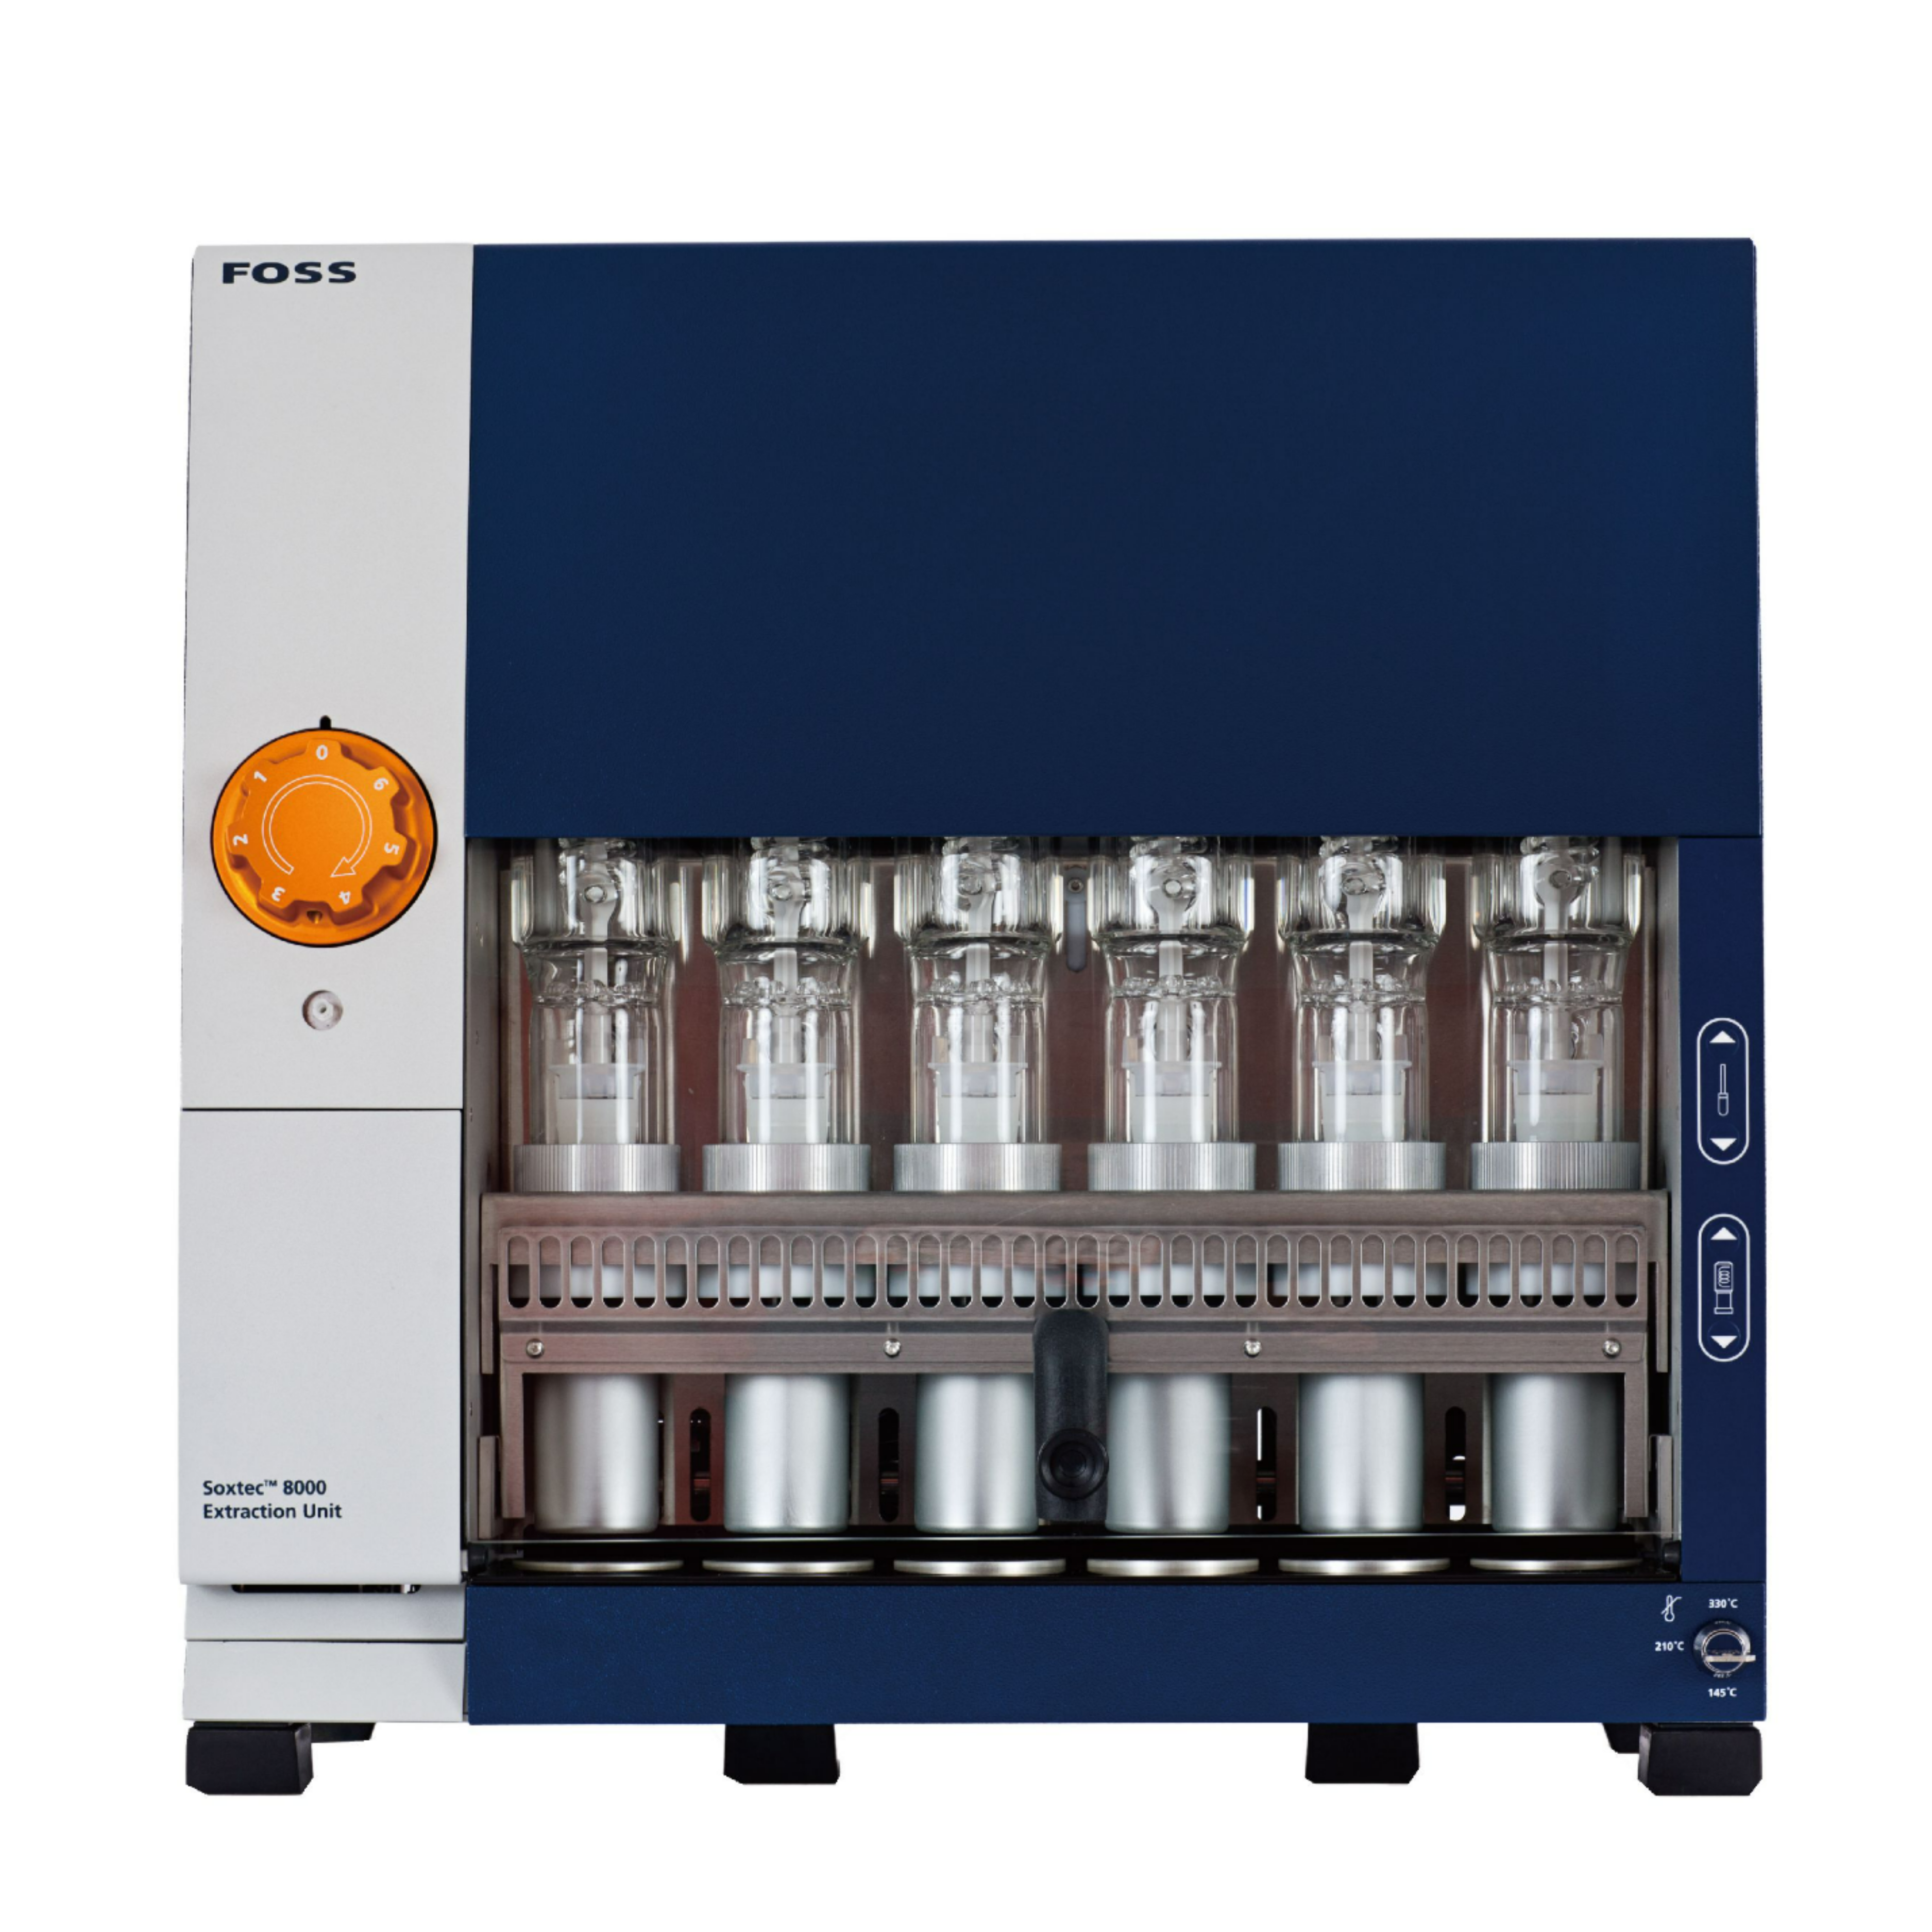
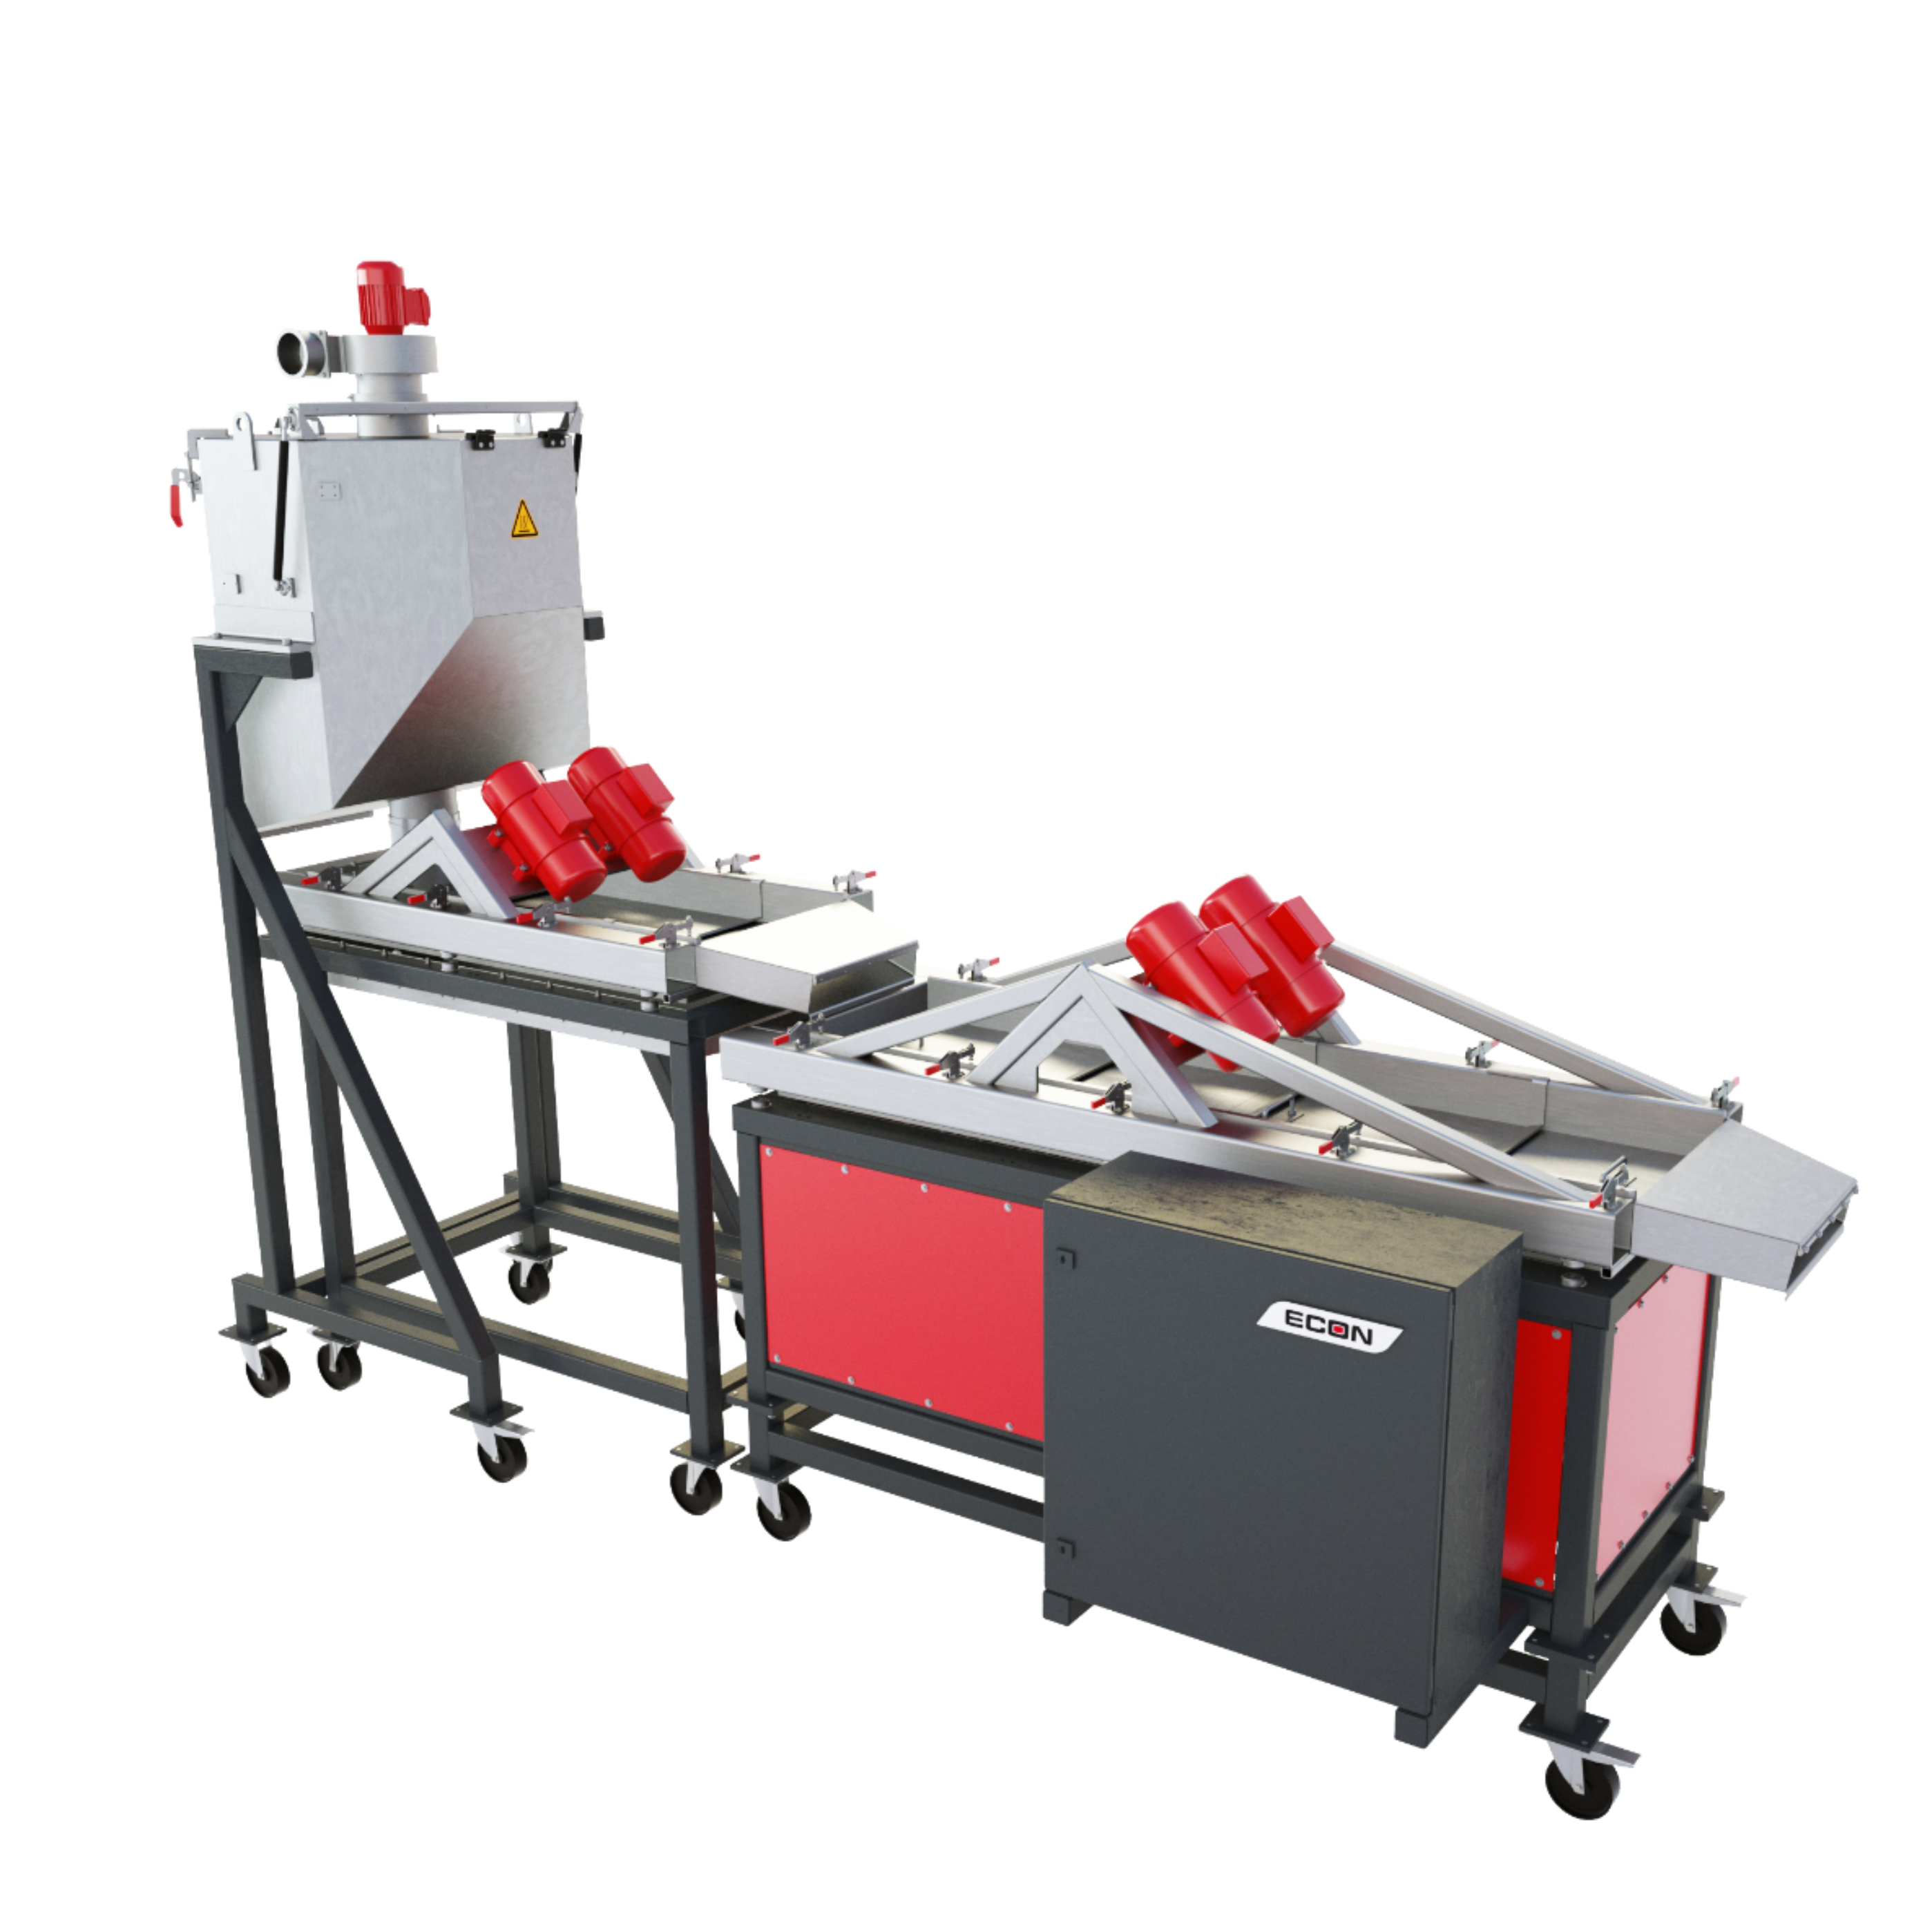
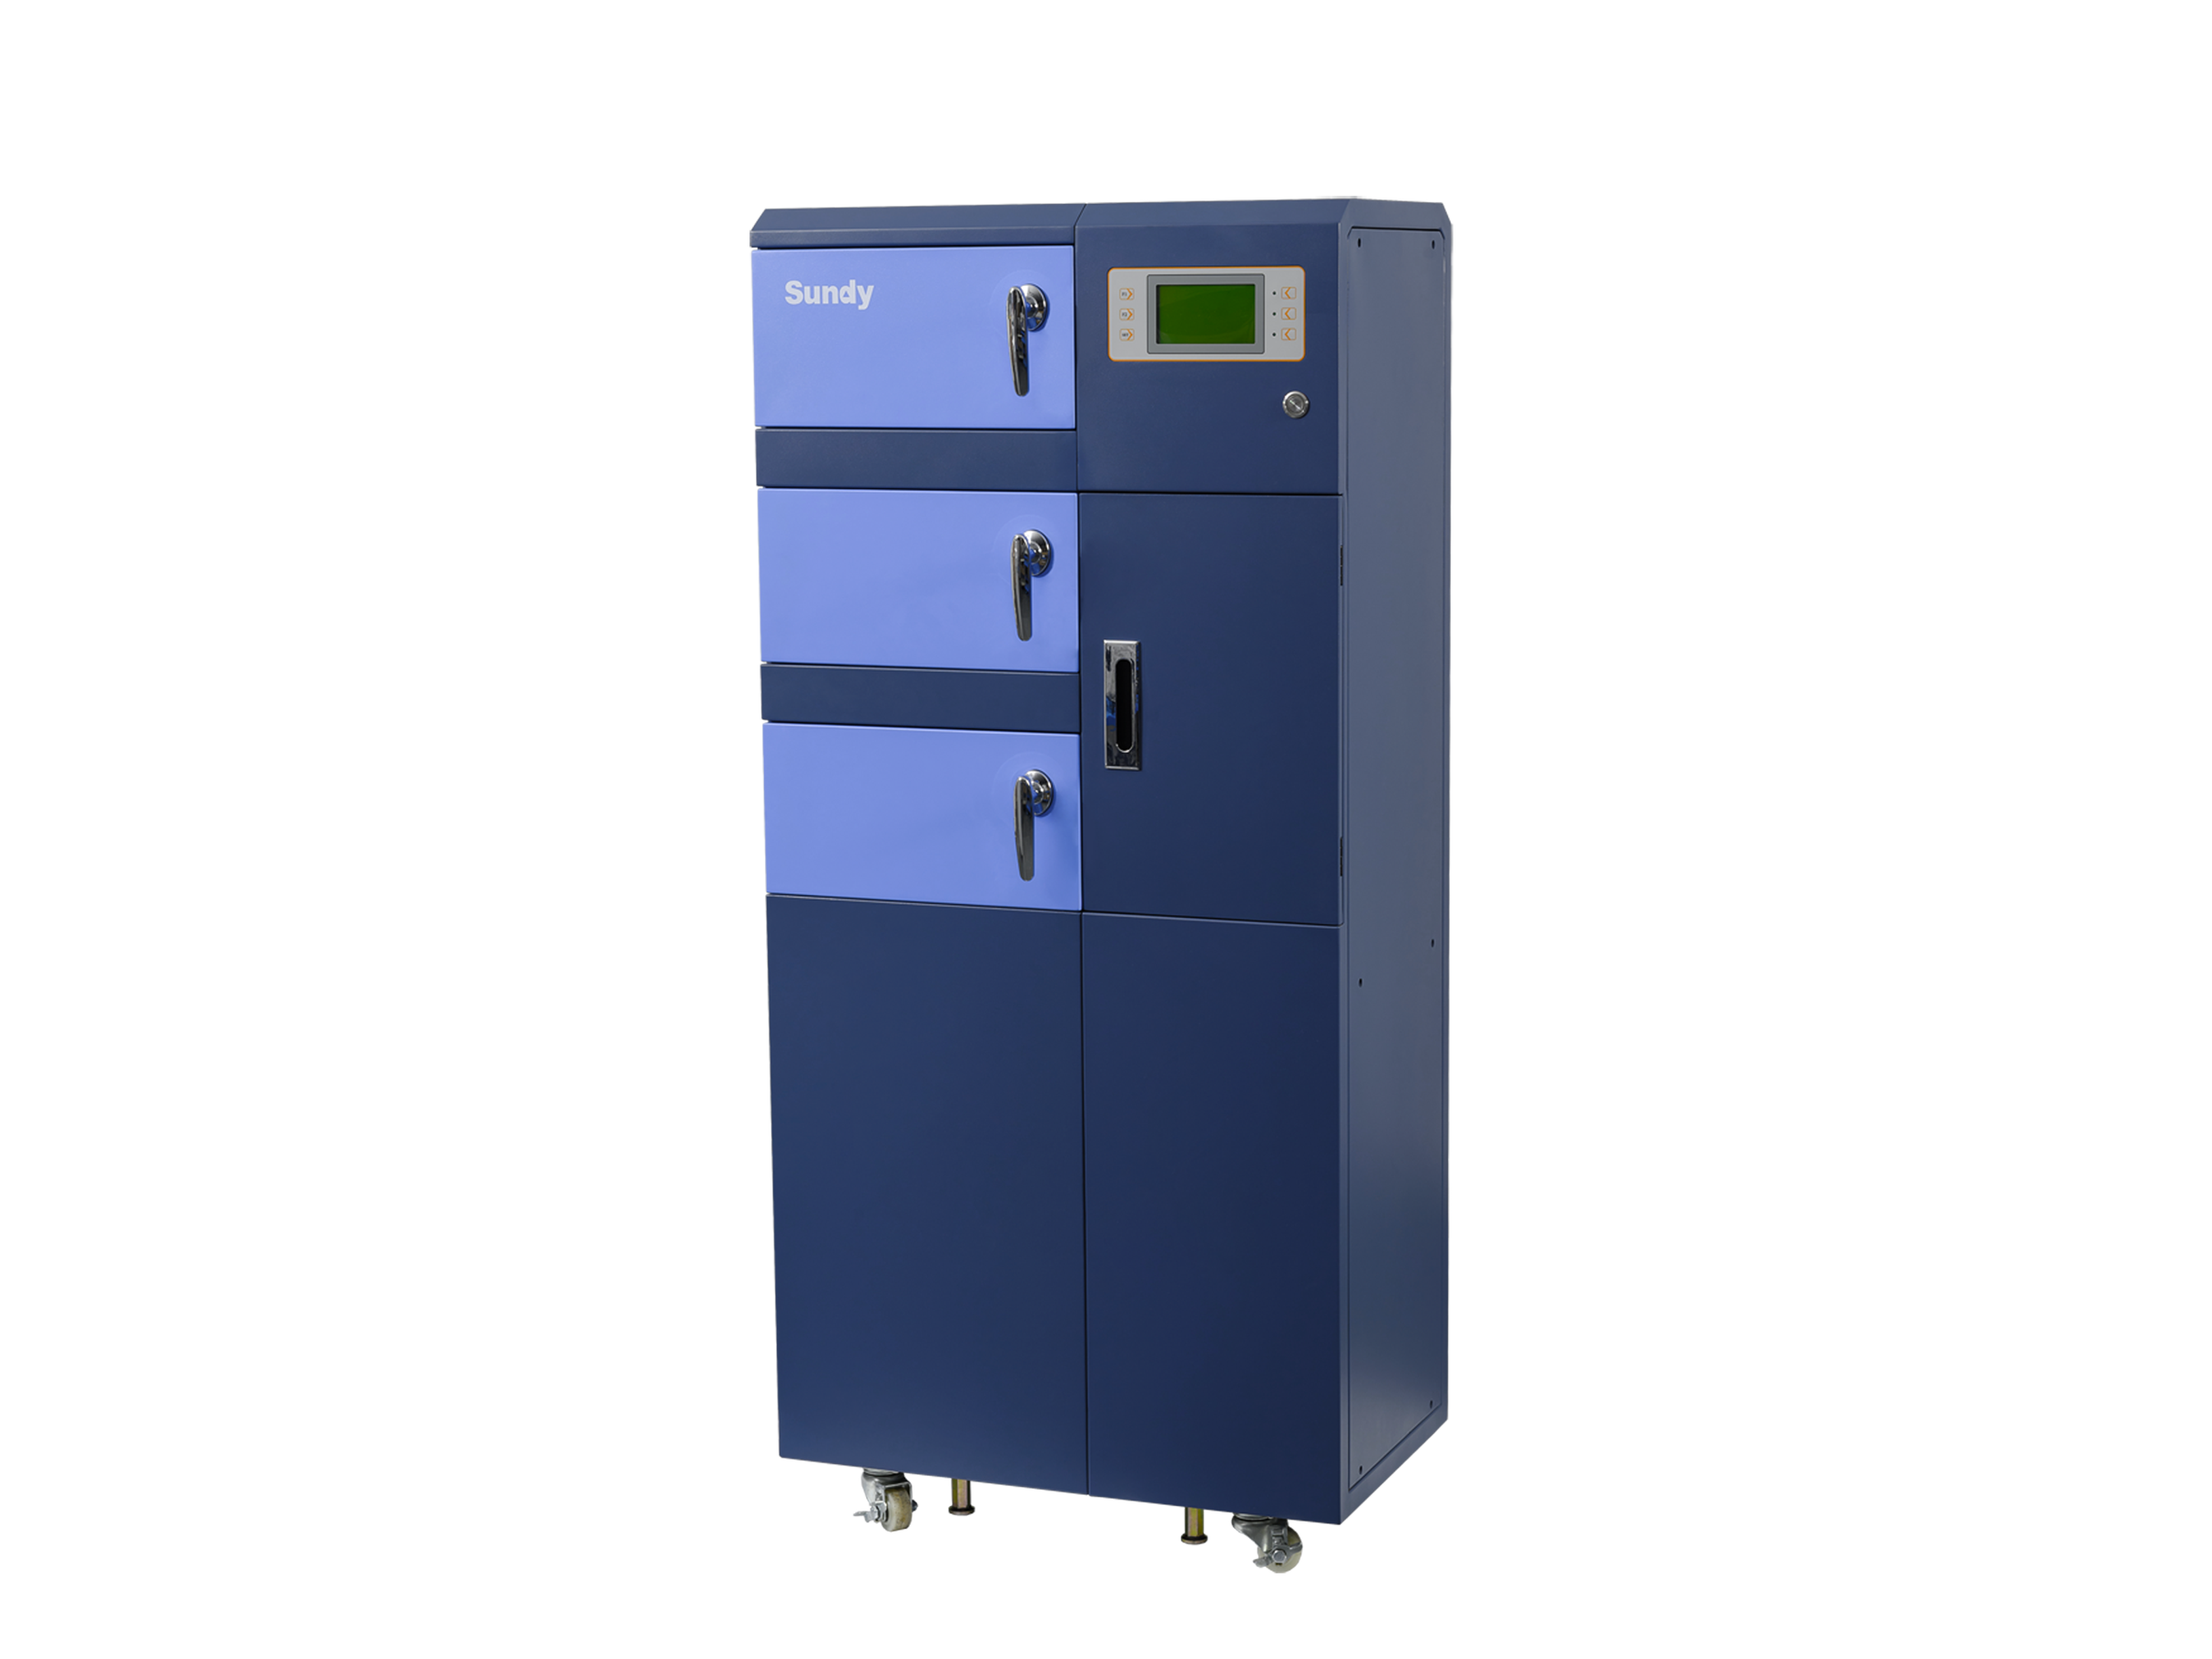
相关方案
 咨询
咨询