-
+关注
私聊
-

fragr
第13楼2010/10/17
Journal of Environmental Sciences
Volume 22, Issue 10, October 2010, Pages 1481-1490
Seasonal variability in CDOM absorption and fluorescence properties in the Barataria Basin, Louisiana, USA
Abstract
Absorption and fluorescence properties of chromophoric dissolved organic matter (CDOM) along a 124 km transect in the Barataria Basin, a large estuary located in Louisiana, USA, were investigated during high and low flow periods of the Mississippi River in the spring and winter of 2008–2009. Mean CDOM absorption at 355 nm from the marine to the freshwater end member stations ranged from (3.25 ± 0.56) to (20.76 ± 2.43) m−1 for the three month high flow period whereas it varied from (1.48 ± 1.08) to (25.45 ± 7.03) m−1 for the same stations during low flow period. Corresponding salinity values at these stations indicated the influence of river and shelf exchanges in the lower basin and precipitation and runoff in the upper basin. An inverse relationship of CDOM absorbance and fluorescence with salinity observed in the basin could be a useful indicator of salinity. CDOM fluorescence also varied over a large range showing an approximately 8 to 12-fold increase between the marine and freshwater end members for the two flow seasons. Excitation-emission matrix spectral plots indicated the presence of various fluorescence components with highest being the A-peak, lowest the T-peak, and the C and M-peaks showing similar trends along the transect. During low flow season the A/C ratio were well correlated with station locations indicating increased terrestrial influence towards the upper basin. CDOM absorption and fluorescence at 355 nm were highly correlated and independent of CDOM sources suggesting that fluorescence could be used to characterize CDOM in the basin.
- 分
- 该帖子已被版主-pfz1985加10积分,加2经验;加分理由:应助
- 分
- 该帖子已被版主-pfz1985加10积分,加2经验;加分理由:应助
-
+关注
私聊
-

冬虫夏草竹
第16楼2013/10/27
moneygreat(moneygreat) 发表:各位大家好:
本人做了一批水样的三维荧光图,从表面上看似乎能看出一些很有趣的想象,但是从阅读的文献上看,很多对该图都用了平行因子分析法,我想通过数学的方法从每张图中提取几个参数比如来分析,希望有志同道合之人来交流交流。
三维荧光光谱提供的数据量实在太大,如果不能用数学方法提取有意义的数据,很容易使人在论文写作当中陷入数据报告的状态,因此迫切希望能有熟悉MATLAB之人指教指教。本人做了尝试但实在是学艺不精。附上一些资料希望能给大家有所帮助。
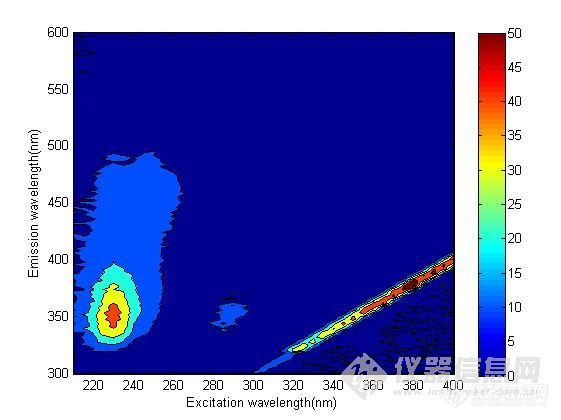
方法:varian 荧光仪
激发发射请看图,PMT电压设定780,水的空白已经扣除,硫酸奎宁每天校正,荧光强度换算成单位硫酸奎宁的荧光强度。
另附件有一篇参考文献的思路类似,请各位指教。