-
+关注
私聊
-

diamond
第164楼2007/04/09
The advantages of polarization modulation over the static approach can only be fully realized by using simultaneous dual-channel data collection with two digitizers. In this case, both the static background and the differential absorption are recorded simultaneously in a single experiment. With dual-channel capability, any spectral features other than the differential absorption by the sample will be almost completely cancelled out after the differential signal is normalized over the static reference collected simultaneously. In addition, dual-channel collection reduces the experiment time by half compare to single-channel spectroscopy. The dual-channel advantage is demonstrated by an IRRAS experiment with a sample of C16H33SH sun-monolayer on gold substrate. The experiment was conducted with a Table Optical Module (TOMTM)-based PM-IRRAS setup. The TOM module was opened and then closed right before each data collection was started. During the data collection, the amount of water vapor and CO2 was changing because of the purge. With dual-channel data collection, the water vapor and CO2 bands are almost completely removed from the PM-IRRAS spectrum, as illustrated in Figure 6.3. However, there was a considerable amount of water vapor and CO2 features on the ratioed PM-IRRAS spectrum obtained by the single channel, sequential measurements, despite the fact that the conditions for all measurements were carefully reproduced.
-
+关注
私聊
-
diamond
第165楼2007/04/10
6.4 Polarization Modulation Infrared Reflection absorption Spectroscopy (PM-IRRAS)
6.4.1 Introduction
Infrared reflection absorption spectroscopy (IRRAS) is a useful technique for studying thin films on reflective substrates. While optically reflective substrates can be formed from different kings of condensed phase (solid or liquid) substances, metallic (or electrically conductive) substrates are mainly discussed in this section. Molecular orientations of a thin film on a metallic substrate can be determined based on the selective absorption of s- and p-polarized light by the absorbed molecules when the incident angle is in the grazing angle range.
-
+关注
私聊
-
diamond
第166楼2007/04/11
6.4.2 Surface Selection Rule
When a beam of light is reflected from a metallic substrate, the phase of the reflected beam shifts by an amount determined by the angle of incidence, the state of polarization and wavenumber of the light. As illustrated in Figure 6.4, the phase shift for the s-polarized beam (with electric field vector, E, perpendicular to the plane of incident, or parallel to the surface of the sample) is close to 180°, irrespective of the angle of incidence and wavenumber. Thus the electric filed vectors of the incident and reflected beams for s-polarized light nearly cancel out at the surface. Since the IR absorption is proportional to (μ·E)2, where μand E refer to the transition dipole moment of the sample and the electric filed intensity of IR light, this cancellation of the E vector at surface (E≈0) means that little absorption is to be expected from a thin film on a metallic substrate for s-polarized IR light, regardless of the orientation of the transition dipole. The phase shift for a p-polarized beam (with E parallel to the plane of incidence, or perpendicular to the surface of the sample) increases rapidly from as small as a few degrees to the extreme 180° as the angle of beam incidence increases from 80-90°. When the phase shift is in the range of 0-90°, as it is the most common case for grazing angle incidence over large mid-IR wavenumber region, the incident and reflected beams usually produce a finite E perpendicular to the metal surface. Therefore, the p-polarized beam is strongly absorbed by molecules with transition moments oriented perpendicularly to the film surface. Figure 6.4 graphically illustrates the surface selection rule. In this Figure, the directions of polarization and transition dipole of the adsorbed molecules are labeled. The shortening of the bar representing the reflected p-polarized light indicates absorption by the surface molecules oriented perpendicular to the surface.
-
+关注
私聊
-
diamond
第168楼2007/04/12
6.4.3 PM-IRRAS Optical Setup on the PEM Module
The PEM Module for IRRAS has an integrated pin-in-place design for all optical components which are pre-installed and pre-aligned in factory. This PEM module is configured at typical reflection angles of 83°, 72°, and 67° for samples with metallic, glass, and dielectric substrates, respectively, by placing the detector in the corresponding locations. Figure 6.5 shows the optical setup of the PEM module. The parallel IR beam from the spectrometer is reflected twice by two flat mirrors and then focused onto the sample surface by a parabolic mirror. Between the focusing mirror and the sample are wire-grid polarizer, oriented parallel to the p-polarized IR light, and a photoelasitc modulator that modulates (rotates) the electric field vector of the IR light between p- and s-polarizations. The polarization modulated IT light impinges onto the surface of the sample at an angle that is suitable for the substrate. The reflected light from the sample surface is then collected by the detector assembly equipped with a focusing lens. Note that reflective focusing optics may scramble part of the polarized light and introduce artifacts in polarization modulation experiments (IRRAS, VLD and VCD) if they are used after the photoelastic modulator. Thus, it is critical to focus the light onto the detector element using a lens instead of a mirror.
-
+关注
私聊
-
diamond
第169楼2007/04/13
6.4.4 PM-IRRAS Signal Demodulation and Data Process
In a typical PM-IRRAS experiment, two modulations are applied simultaneously: the Fourier modulation produced by the interferometer and the polarization modulation by the PEM. Thus the raw detector signal contains contributions from both modulations if proper electronic filtering is used. Figure 6.6 shows interferograms of the detector signal with the PEM turned on and off, respectively. It can be see that when the PEM is turned on, the interferogram has both a high frequency contribution from the polarization modulation and a low frequency signal associated with the normal interferometric modulation.
-
+关注
私聊
-
diamond
第170楼2007/04/14
This raw PM-IRRAS signal from the detector can be mathematically expressed as follow:

where k(σ,fF, D*…) is a coefficient that is primarily related to wavenumber (σ) region, Fourier modulation frequency fF, D* and the preamplifier of the detector, Ip and Is are the intensities of reflected p- and s-polarized light, J2(ψ0) is the second-order Bessel function withψ0 equal to the function of the maximum voltage applied on the PEM. For simplicity we assume that k(σ,fF, D*…) is not polarization dependent, and we neglect the (Ip-Is) J0(ψ0) term since it is much smaller than the DC term (Ip+Is) for films on metallic substrates.
-
+关注
私聊
-
diamond
第171楼2007/04/15
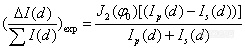
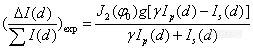
As illustrated in Figure 6.2, this detector signal is fed into the input channel of a synchronous sampling demodulator (SSD) that has a tuned demodulation frequency of twice the fPEM (e.g. 50kHz) and a high limit of signal input, usually up to ±10volts. The demodulator has built-in low-pass and high-pass electronic filters that optimize the sum (Ip+Is) and the difference [J2(ψ0)( Ip-Is)] PM-IRRAS signal outputs, respectively. The sum and difference outputs are then digitized simultaneously by two electronically balanced digitizers of the spectrometer. Thus an experimental PM-IRRAS spectrum can be calculated by ratioing the difference over the sum as follows:
-
+关注
私聊
-
diamond
第172楼2007/04/23
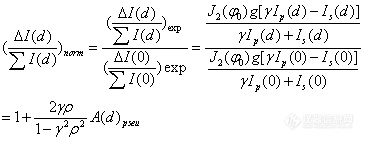
In Equation (6-2), the difference in signal amplification and filtering between the two channels for overall electric signal process, and the difference in overall optoelectronic setup for p and s linear polarizations are ignored and the notation d refers to the thickness of the film on the metal substrate. When these two factors are considered, Equation (6-2) becomes:
-
+关注
私聊
-
diamond
第173楼2007/04/24
where g=G+/G-, the ratio of overall gain for the two channels, and γ=Cp/Cs, the ratio of overall responses of the optioelectronic setup for p and s linear polarizations. Equation (6-3) indicates that the second order Bessel function envelope with multiple arches and nodes will define the overall spectral shape of the PM-IRRAS spectrum. In order of eliminate the factors J2(ψ0) and g, Equation (6-3) can be divided by the equivalent PM-IRRAS signal from the bare substrate under same experimental conditions to give the normalized PM-IRRAS spectrum: