-
+关注
私聊
-

diamond
第225楼2007/07/16
The final VCD spectrum can be obtained after a VCD calibration spectrum is collected using a multiple quarter waveplate (CdSe) with axes parallel or perpendicular to the stress axis of the PEM followed by a second polarizer (KRS-5 or ZnSe) oriented parallel or perpendicular to the linear polarizer placed before the PEM. The arrangement of optical components for measuring the VCD calibration curve is illustrated in Figure 6.18.
-
+关注
私聊
-
diamond
第226楼2007/07/17
These four possible settings for the waveplate and the second polarizer (or practically speaking, two settings corresponding to the two different directions of the second polarizer would be enough) produce 4 VCD “curves” and the intersection points of the curves define a calibration plot given by Equation (6-23):

-
+关注
私聊
-
diamond
第227楼2007/07/18
Ratioing Equation (6-22) over (6-23) then gives,
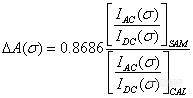
Where only the positive sign in Equation (6-23) is used. In VCD experiments, usually the AC channel signal is amplified with gain factor for both the VCD sample (Gs) and calibration (Gc) measurements thus Equation (6-24) can be adjusted to: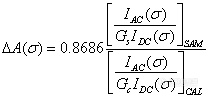
-
+关注
私聊
-
diamond
第229楼2007/07/20
6.6.4 Application Examples
VCD can be used for a wide variety of stereostructural analyses. The applications of VCD fall into three areas. The first and also the oldest area since the mid 1970’s was to study conformational properties of molecules where the absolute configurations were well known. The examples of this application include some typical biological molecules such as proteins, nucleic acids and sugars. The other two areas are more practical applications in the chemical and pharmaceutical industries. The interest in the potential of using VCD to determine the optical purity of manufactured samples and the absolute configuration of new chiral molecules intended for medicinal applications has been increasing over the last several years.
-
+关注
私聊
-
diamond
第230楼2007/07/21
In this section, only two kinds of classic chiral molecules used in VCD measurement are demonstrated, which are α-pinene, S- or R-camphors. Both samples can produce well-defined VCD spectra, and therefore, they are often used for testing the performance of VCD instruments.
-
+关注
私聊
-
diamond
第232楼2007/07/22
Shown in Figure 6.19 are: a) the VCD calibration intensity calibration curve that was generated from the raw VCD spectra of quarter waveplate, corresponding to the parallel and perpendicular directions of the second polarizer; and (b) regular absorbance spectrum and intensity calibrated VCD spectrum of (1R)-(-)- α-pinene (98%, C10H16, Aldrich Chemical Company) in absorbance units. These spectra were measured by using a Nicolet Nexus 870 spectrometer coupled with a PEM module for VCD. The VCD intensity calibration was performed by using Equation (6-25). In this VCD experiment, a liquid transmission cell (BaF2) with pathlength of 50 micrometers was used so that theα-pinene sample can be measured directly without dilution. Under these conditions, spectral saturation over 800-1350cm-1 region is generally avoided, and active bands are less than 0.7 absorbance unit, ensuring the linearity required for VCD measurement. Since the VCD signal is on the level of micro-absorbance unit, a large number of scans (typically 1000 or above) is often needed to improve the signal noise ratio. Another example of VCD measurement is based on S- and R- camphors. Figure 6.20 illustrates how VCD can be used to distinguish between these two molecules. These two mirror-image molecules also have “mirror image” VCD spectra whereas their regular IR spectra are virtually identical.
-
+关注
私聊
-
diamond
第233楼2007/07/30
CHAPTER 7 Two Dimensional Infrared (2D-IR) Correlation Spectroscopy
7.1 Introduction
Two-dimensional infrared (2D-IR) spectroscopy is a spectro-mathematical tool that correlates spectra synchronously and asynchronously in a third dimension defined by a physical parameter in a dynamic system under study. The conventional 2D-IR correlation method, proposed in 1990 by Noda, strictly applies to the analysis of a system with a sinusoidal perturbation, where two orthogonal in-phase and quadrature spectra are correlated in a third dimension, i.e. the phase angle. Typical application examples of conventional 2D-IR correlation spectroscopy include analysis of the responses of polymer films to mechanical strain and the responses of liquid crystals to electric field. However, the ambiguities of the conventional 2D-IR method, particularly, in situations of phase difference around 45°, and the strict condition on perturbation have limited its application to many systems.