-
+关注
私聊
-

diamond
第63楼2006/11/07
Continuous-scan FT-IR PAS is widely used for measuring spectra of homogeneous samples as a routine sampling method for samples that can be challenging using other techniques. In continuous-scan FT-IR, the Fourier frequency, fF=2vσ [where v is mirror velocity (cm/sec) and σ is IR wavenumber (cm-1)], is the actual modulation frequency of IR light. According to Equation (3-2), PAS sampling depth in the continuous-scan mode depends on both the mirror velocity and IR wavenumber. Modulation frequencies for different wavenumbers at different optical velocities (twice the mirror velocity) on the Nicolet FT-IR research spectrometers are listed in Table 3-1. Since the modulation frequency varies with wavenumber in continuous-scan PAS sampling, the probing depth (μ) varies across the entire spectrum as illustrated by Figure3.4. According to Equation (3-2), the probing depth at 400cm-1 is about three times deeper than that at 4000cm-1 in a continuous-scan PAS spectrum:

-
+关注
私聊
-
diamond
第64楼2006/11/08
For heterogeneous or layered samples, the variation in sampling depth across the entire spectral region makes the interpretation of a continuous-scan PAS spectrum somewhat ambiguous, because the spectral features in different regions could come from different layers. In order to simplify continuous-scan PAS spectral depth profiling analysis, a small portion of the spectrum, or a distinctive band is often monitored across all spectra taken at different velocities. In addition, the lake of a discrete modulation frequency in the continuous-scan mode makes extraction of PA signal phase difficult. As discussed earlier in Section 3.3.3. and further elucidated later in Section 3.5.5. and 3.5.6., the PA phase information is a signature of PA signal origin and can be used to enhance spatial resolution and determine layer thickness of samples. These two problems limit the use of continuous-scan FT-IR PAS for spectral depth profiling of heterogeneous materials. Finally, at a constant velocity of the moving mirror, the PA signal becomes much weaker at higher wavenumbers (shorter wavelengths) because the Fourier frequency (fF) depends on the wavenumber (σ) of the light and the velocity of the moving mirror (v), i.e. fF =2vσ. As a consequence, FT PAS in the visible spectral region is not feasible in the continuous-scan mode.
-
+关注
私聊
-
diamond
第65楼2006/11/09
3.3.5 Step-Scan Phase Modulation (S2ΦM) FT-IR PAS: Principles
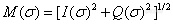
The limitation of continuous-scan PAS can be overcome by coupling the photoacoustic cell with a step-scan phase modulation (S2ΦM) FT-IR spectrometer. First, S2ΦM operation removes the spectral multiplexing of the interferomter from the time domain; there are effectively no (temporal) Fourier frequencies. A single-frequency phase (path difference) modulation applied ro the fixed mirror is therefore used to modulate all wavelengths of the radiation to generate the PA signal, resulting in a uniform probing depth across the entire spectrum as shown in Figure 3.5. Secondly, the use of a discrete phase modulation frequency (or several frequencies) offers the convenience of using digital signal processing (DSP) techniques to demodulate the PA signal and extract the signal phase from the simultaneously generated in-phase, I(σ), and quadrature, Q(σ), components of the signal. Thus the elimination of the calculation of the PA signal phase, Φ(σ), and magnitude, M(σ), spectra is made possible, as illustrated by Equation (3-8) and (3-9):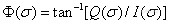
-
+关注
私聊
-
diamond
第66楼2006/11/10
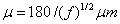
In S2ΦM FT-IR PAS, the probing depths can be calculated from Equation (3-2) if the properties of the sample are known. For most organic polymeric materials, their thermal diffusivity values α≈0.001cm2/s, thus the sampling depth at different ΦM frequencies can be calculated using the following simplified equation:
-
+关注
私聊
-
diamond
第67楼2006/11/11
Some representative data based on Equation (3-10) are listed in Table 3-2. For example, under a typical parameter setting of ΦM frequency 100Hz, and ΦM amplitude 3.5 λHe-Ne, the probing depth (μ) for most homogeneous organic polymers is about 18μm and the energy profile optimizes mid-IR spectral measurements. When heterogeneous/layered samples are involved, the actual probing depth can be as deep as 2μ if the surface layer(s) is (are) acting as an IR transparent window over the absorption region of the base layer. By changing phase modulation frequency, one is able to obtain frequency-resolved spectral depth profiling results. Thus S2ΦM FT-IR is a preferred choice for PA spectral depth profiling. Furthermore, S2ΦM technique not only offers an advantageous choice for FT PAS in mid-IR region but extends FT PAS to ultra-violet/visible/near-infrared (UV/Vis/NIR) spectral regions with reasonable signal strength (by using a single, low-frequency modulation).
-
+关注
私聊
-
diamond
第68楼2006/11/12
The use of PA signal phase, either alone or in combination with the variation of the modulation frequency, usually offers the prospect of much greater detail in depth profiling than use of the modualtion frequency alone. To properly generate PA phase data, a PA phase calibration is required. This calibration is performed by using a strongly absorbing material such as carbon black-filled rubber or glassy carbon to establish a "surface phase" reference.
-
+关注
私聊
-
diamond
第70楼2006/11/20
There have been several ways of using PA phase for depth profiling analysis. The first approach is simply the direct use of in-phase (I) and quadrature (Q) spectra. By using the surface phase reference, the in-phase spectrun enhances the surface absorption features and quadrature will enhances the those of the substrate. The second approach is to rotate the detection phase either in a trial-and-error approach or by systematic, continuous rotation, to eliminate certain bands from the spectrum or to illustrate the variation of intensity of relevant bands as a function of detection phase angle. By comparing the "extinction" angles (nodes) of selected bands from the phase rotation plot, qualitative results can be obtained. Mathematically, the phase rotation uses the simple vector algorithm:
