
使用表面增强拉曼光谱检测瓶装水中的聚对苯二甲酸乙二醇酯纳米塑料


导读:本研究合成了一种新型的表面拉曼增强光谱(SERS)衬底,该衬底可增强纳米颗粒的拉曼光谱信号,通过对不同粒径的聚苯乙烯(PS)纳米颗粒测试发现,粒径越小拉曼光谱信号增强因子越高。
近日,挪威科技大学与南开大学合作在Environmental Science & Technology上发表了题为“Identification of Poly(ethylene terephthalate) Nanoplastics in Commercially Bottled Drinking Water Using Surface-Enhanced Raman Spectroscopy”的研究论文。研究合成了一种新型的表面拉曼增强光谱(SERS)衬底,该衬底可增强纳米颗粒的拉曼光谱信号,通过对不同粒径的聚苯乙烯(PS)纳米颗粒测试发现,粒径越小拉曼光谱信号增强因子越高。使用该SERS衬底,对经100 纳米滤膜过滤后瓶装水进行了检测,通过与标准谱图比对,发现瓶装水中的纳米塑料为聚对苯二甲酸乙二醇酯,浓度高达108 个/毫升。
全文速览
微纳塑料作为新型污染物,引起了全球范围的广泛关注。而作为微纳塑料研究的基石,检测分析方法一直是该领域的重点和难点,尤其是粒径更小的纳米塑料。本研究合成了一种新型三角孔隙阵列SERS衬底,该衬底可增强纳米塑料的拉曼信号。通过对不同粒径(50,200,500,1000 nm)的PS纳米塑料测试,发现粒径越小,拉曼光谱信号的增强因子越高。对于50 nm的PS纳米塑料检测限为0.001%,约为1.5×10¹¹ 个/毫升。使用该衬底,检测了市售的瓶装水,瓶装水经100 nm滤膜过滤后,滴加在衬底上,可直接检测到拉曼光谱信号,经过与标准谱图的比对,发现为聚对苯二甲酸乙二醇酯,该塑料主要为瓶身材质,浓度约为108 个/毫升。该研究提供了一种快速且灵敏的纳米塑料检测方法。
引言
微纳塑料由于其独特物化性质,分析检测一直是微纳塑料研究领域的重点和难点。拉曼增强由于其可对小分子有机化合物以及纳米颗粒的拉曼光谱信号进行增强,近年来也逐渐应用于纳米塑料的检测。但目前关于SERS测试纳米塑料多集中于实验室内的加标样品,对于实际样品的检测的研究仍然很少。本研究通过合成一种新型的三角孔隙阵列衬底,测试了其对PS纳米塑料的增强效果,并检测分析了市售瓶装水中纳米塑料的赋存。
图文导读
阵列合成
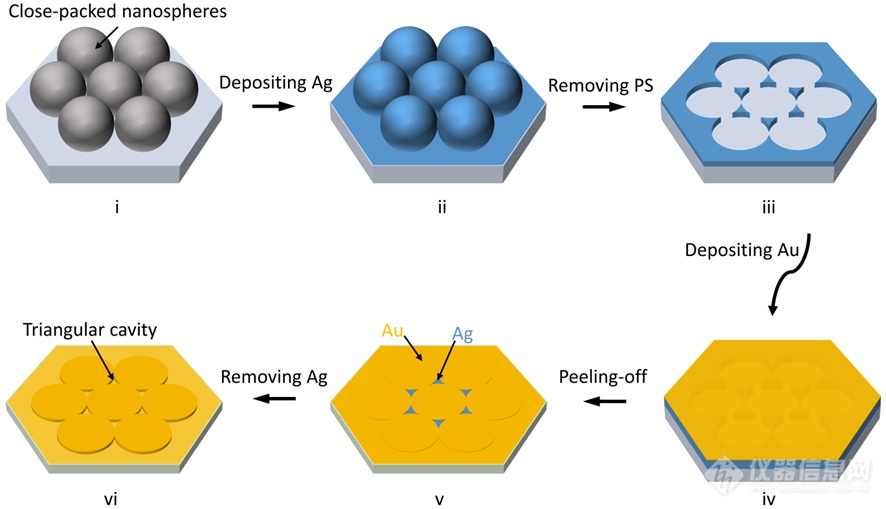
Figure 1. A schematic illustration of fabrication process for the triangular cavity arrays (TCAs). First, close-packed polystyrene (PS) nanospheres are self-assembled on a silicon substrate (i). A thin silver (Ag) film is deposited over the nanospheres (ii), which are then tape stripped away, leaving Ag nanotriangle arrays (iii). A gold (Au) film is then deposited over the entire substrate (iv). An adhesive epoxy is applied on the top of Au and then peeled off, transferring two metals Ag and Au sitting in a complementary arrangement side-by-side on epoxy (v). Simply removing of the Ag parts using chemically etching, revealed gold triangular cavity arrays as shown in (vi).
图1展示了该拉曼衬底的合成示意图,首先将一层500 nm的PS纳米微球平铺在硅胶板上,然后在表面添加一层Ag,去除掉纳米微球后,形成了Ag纳米三角阵列,再添加一层150 nm的Au薄膜,之后添加一层粘合剂环氧树脂,在紫外线照射下固化后剥离掉带着两层金属的环氧树脂,再去除孔隙中的Ag后,形成最终的三角阵列衬底。
阵列表征
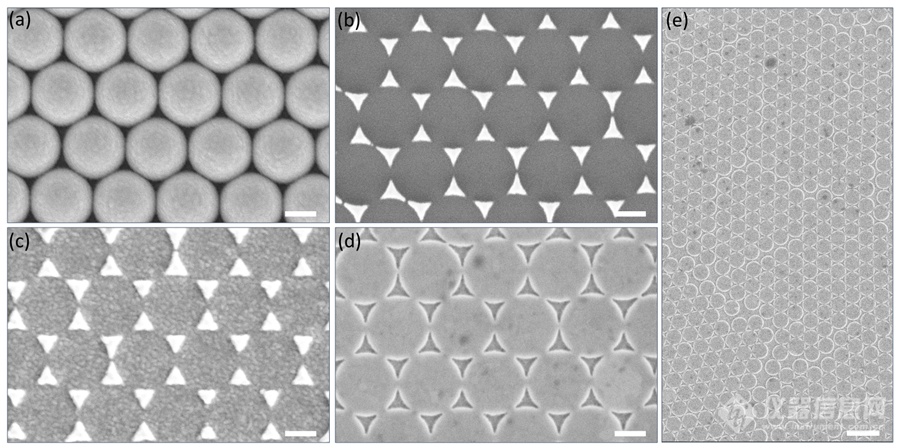
Figure 2. Scanning electron micrographs (SEMs) of the corresponding processing steps in Figure 1 to fabricate gold TCAs substrate: (a) Close-packed PS nanospheres that corresponds to step i in Figure 1; (b) Ag triangle arrays after removing of PS nanospheres that corresponds to step iii in Figure 1; (c) Top-view of morphology after depositing Au layer that corresponds to step iv in Figure 1; (d) Au TCAs arrays after removing of Ag parts that corresponds to step vi in Figure 1. Scale bar in a-d: 250 nm. (e) Patterned gold TCAs over large area, scale bar in e: 1 µm.
图2为经过图1合成的衬底的扫描电镜图,分别表示了衬底在不同合成阶段的扫描电镜图。从图中可清楚的表明于实际合成的衬底与图1中的示意图完全吻合。
PS纳米颗粒测试
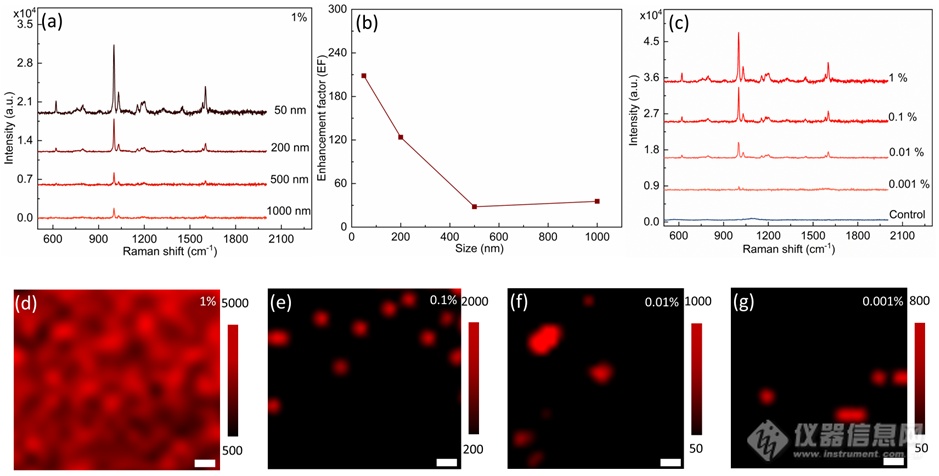
Figure 3. (a) Raman spectra of PS nanoplastics with different sizes on Au TCAs substrates at concentration of 1%. (b) Enhancement factor (EF) as a function of PS size. (c) Raman spectra of 50 nm PS nanoplastics with concentrations varying from 1% to 0.001% on TCAs substrates and on plain glass substrate at the concentration of 1% (control line). (d-g) Raman mapping images of 50 nm PS nanoplastics on Au TCAs substrates with different concentrations from 1% to 0.001%. Scale bar in d-g: 200 nm.
图3展示了不同粒径的PS纳米微球的增强测试,在50、200、500和1000 nm四个粒径中,50 nm的PS微球增强因子最高,随着粒径增加,增强因子变低。此外,还对50 nm的PS微球的不同浓度做了分析测试,发现在0.001%仍可检测到清晰的信号,特征峰1003 cm-1的信噪比为88。
瓶装水前处理
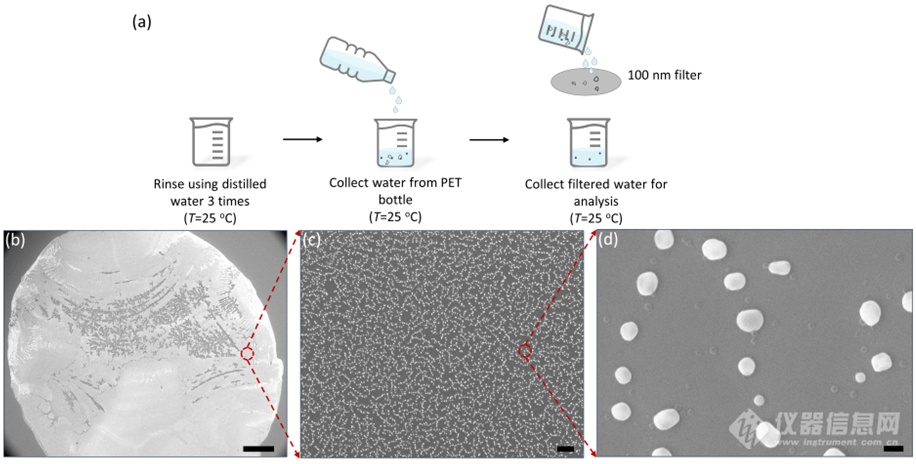
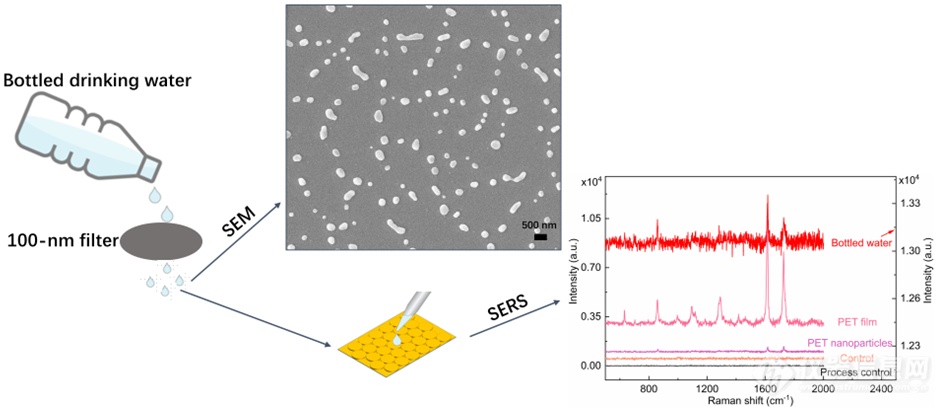
Figure 4. (a) Schematic of sample preparation from commercially bottled drinking water. (b-d) SEM images of an extracted sample that drop-casted on a silicon wafer after drying under ambient conditions. Scale bar: (b) 300 µm; (c) 5 µm; (d) 200 nm.
图4为瓶装水的处理过程和SEM结果。在采购瓶装水后,取100 mL过100 nm的滤膜,对过滤后的水样进行SEM检测,从图中可看出,在扫描电镜下,存在大量的颗粒物,经过不同倍数的放大,粒径小的可低至几十纳米。同时,采用去离子水做了过程空白对照,在扫描电镜下,无颗粒物检出,排除了实验过程中外部的污染。
瓶装水检测
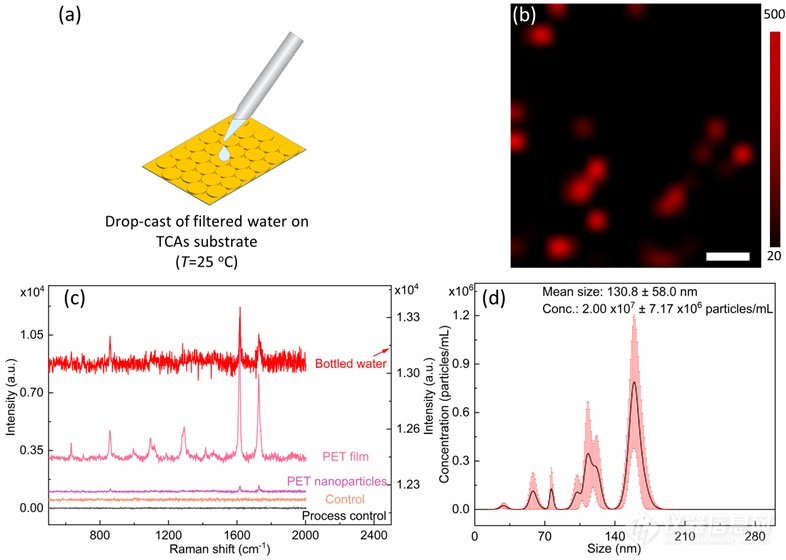
Figure 5. (a)Schematic of sample preparation from bottled drinking water. (b) Raman mapping image of sample extracted from bottled drinking water on TCAs substrate. Scale bar: 500 nm. (c) Raman spectra of sample extracted from bottled drinking water on TCAs substrate (red line) and plain glass substrate (brown line), and PET film (purple line). (d) Finite track length adjustment (FTLA) concentration/size image for NTA of sample extracted from bottled drinking water on TCAs substrate: indicating mean size of nanoplastics is ca. 130.8 ± 58.0 nm.
图5为瓶装水的拉曼检测结果,将过滤后的瓶装水直接滴加在衬底上,经过拉曼检测后,可鉴别出1620和1760 cm-1两个峰,与PET纳米塑料标准品和PET膜进行对比,可知瓶装水中的颗粒物为PET,在检测空白和过程空白中均无信号。此外,水样还进行了NTA测试,平均粒径约为88.2 nm(三个平行样品的平均值),浓度为1.66×10⁸ 个/毫升。
小结
通过合成新的SERS衬底,可实现对纳米塑料的拉曼信号的增强,纳米塑料的粒径越小增强因子越高,且该衬底的灵敏度高,可对过滤后的水样直接检测,同时还可重复使用。瓶装水的检测结果表明塑料瓶身是水样中纳米塑料的主要来源。
来源于:Environmental Advances


热门评论
最新资讯
新闻专题
更多推荐
