方案摘要
方案下载| 应用领域 | |
| 检测样本 | |
| 检测项目 | |
| 参考标准 |
Good graphical representation makes easier the understanding of the data. That''s why EC-Lab® and EC-Lab® Express software provide a traces processing tool (Fig. 1) which allows the user to customize its own traces. 24 mathematical functions (Fig. 2) are available (button “more” of the calculator) for writing mathematical expression of X-, Y1- or Y2-axis. In this application note, some examples of graphic customization are shown in various field of electrochemistry.

用OSP解除SECM中高度的影响--在腐蚀中的应用
华洋科仪:用DPS气相色谱仪进行生物柴油分析
华洋科仪:DPS气相色谱仪专用环境气体分析方法
相关产品
法国Bio-Logic 电化学工作站VSP-300(6通道)
法国Bio-Logic 电化学工作站 HCV-3048 Booster
法国Bio-Logic 电化学工作站FlexP 0060/0012
法国Bio-Logic高电流电化学工作站HCP-803
法国Bio-Logic高精度多通道电池测试系统MPG-2XX
法国Bio-Logic 电化学工作站SP-150e(双通道)
法国Bio-logic 电化学工作站SP-50e(单通道)
SIS-5100光波导光谱仪
全自动微孔板检测圆二色光谱仪
法国Bio-Logic 电化学工作站 VSP-3e(8通道)
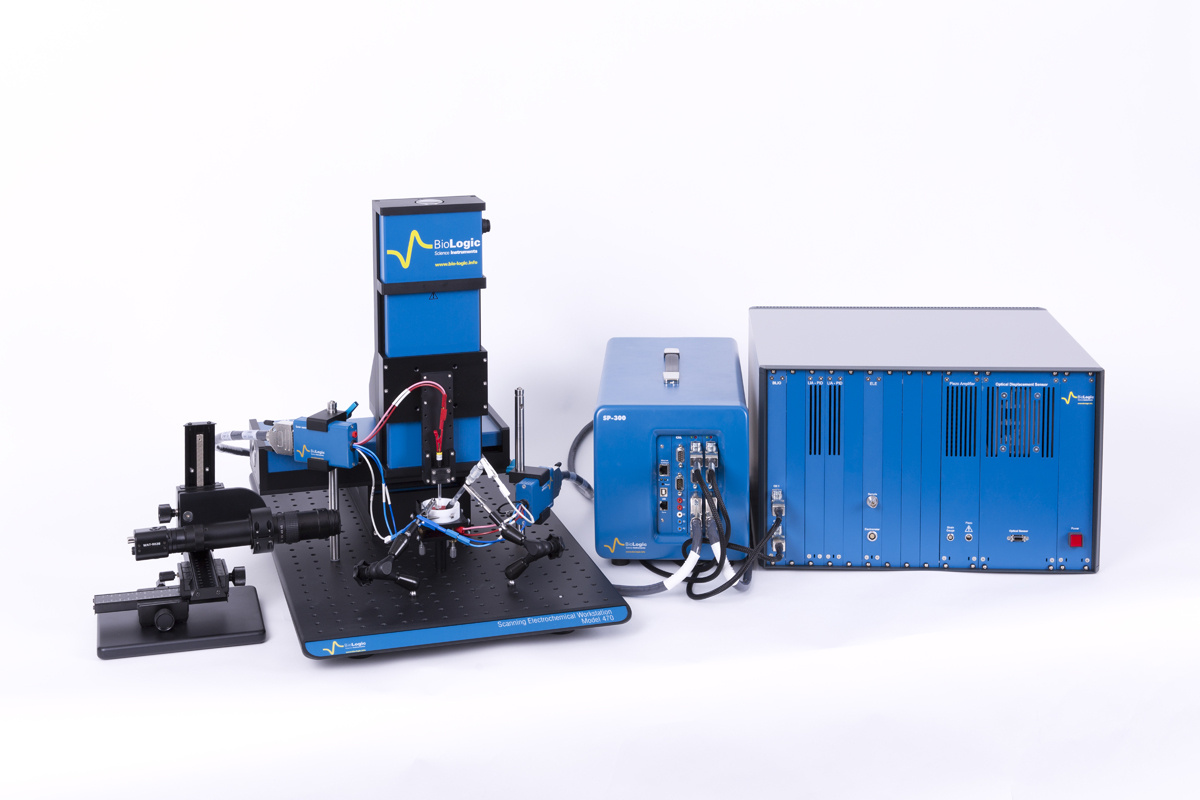
法国Bio-Logic微区扫描电化学工作站M470
Bio-Logic圆二色光谱仪MOS-500
BioTools振动圆二色光谱仪ChiralIR-2X
BioTools手性拉曼光谱仪ChiralRAMAN-2X
法国Bio-Logic 电化学工作站 VMP-3e(16通道)

关注

拨打电话

留言咨询