
方案详情文
智能文字提取功能测试中
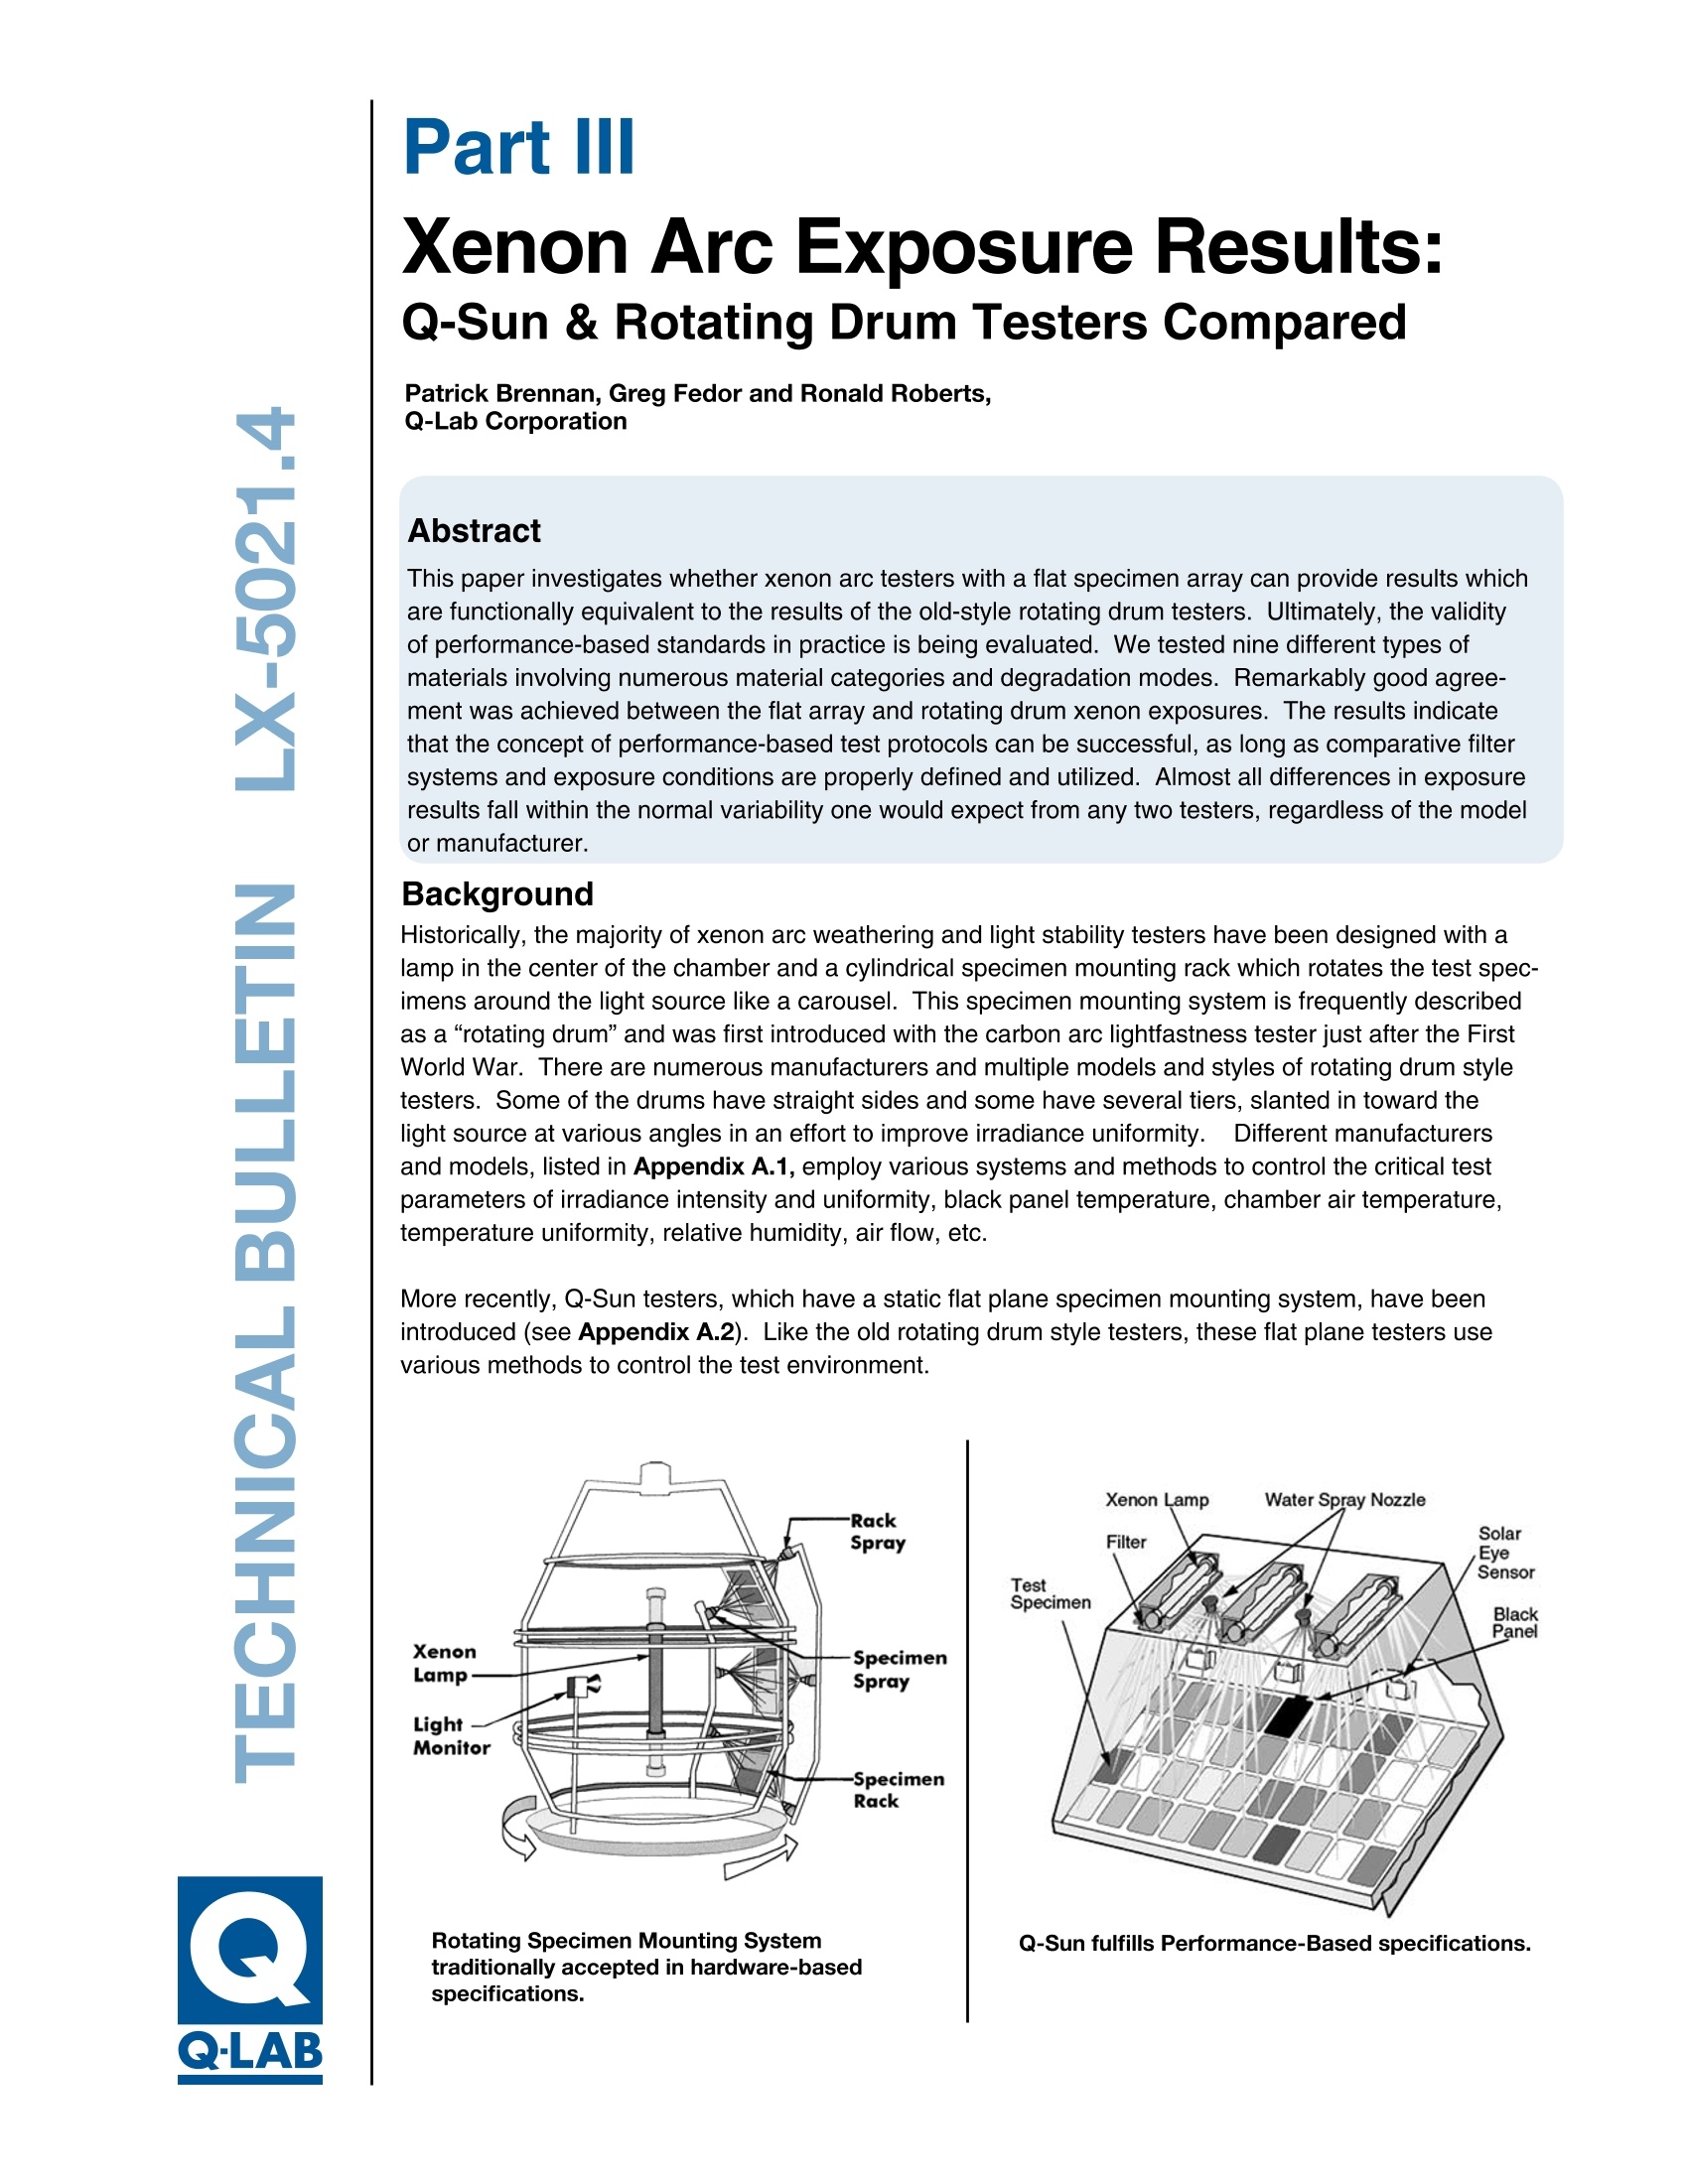
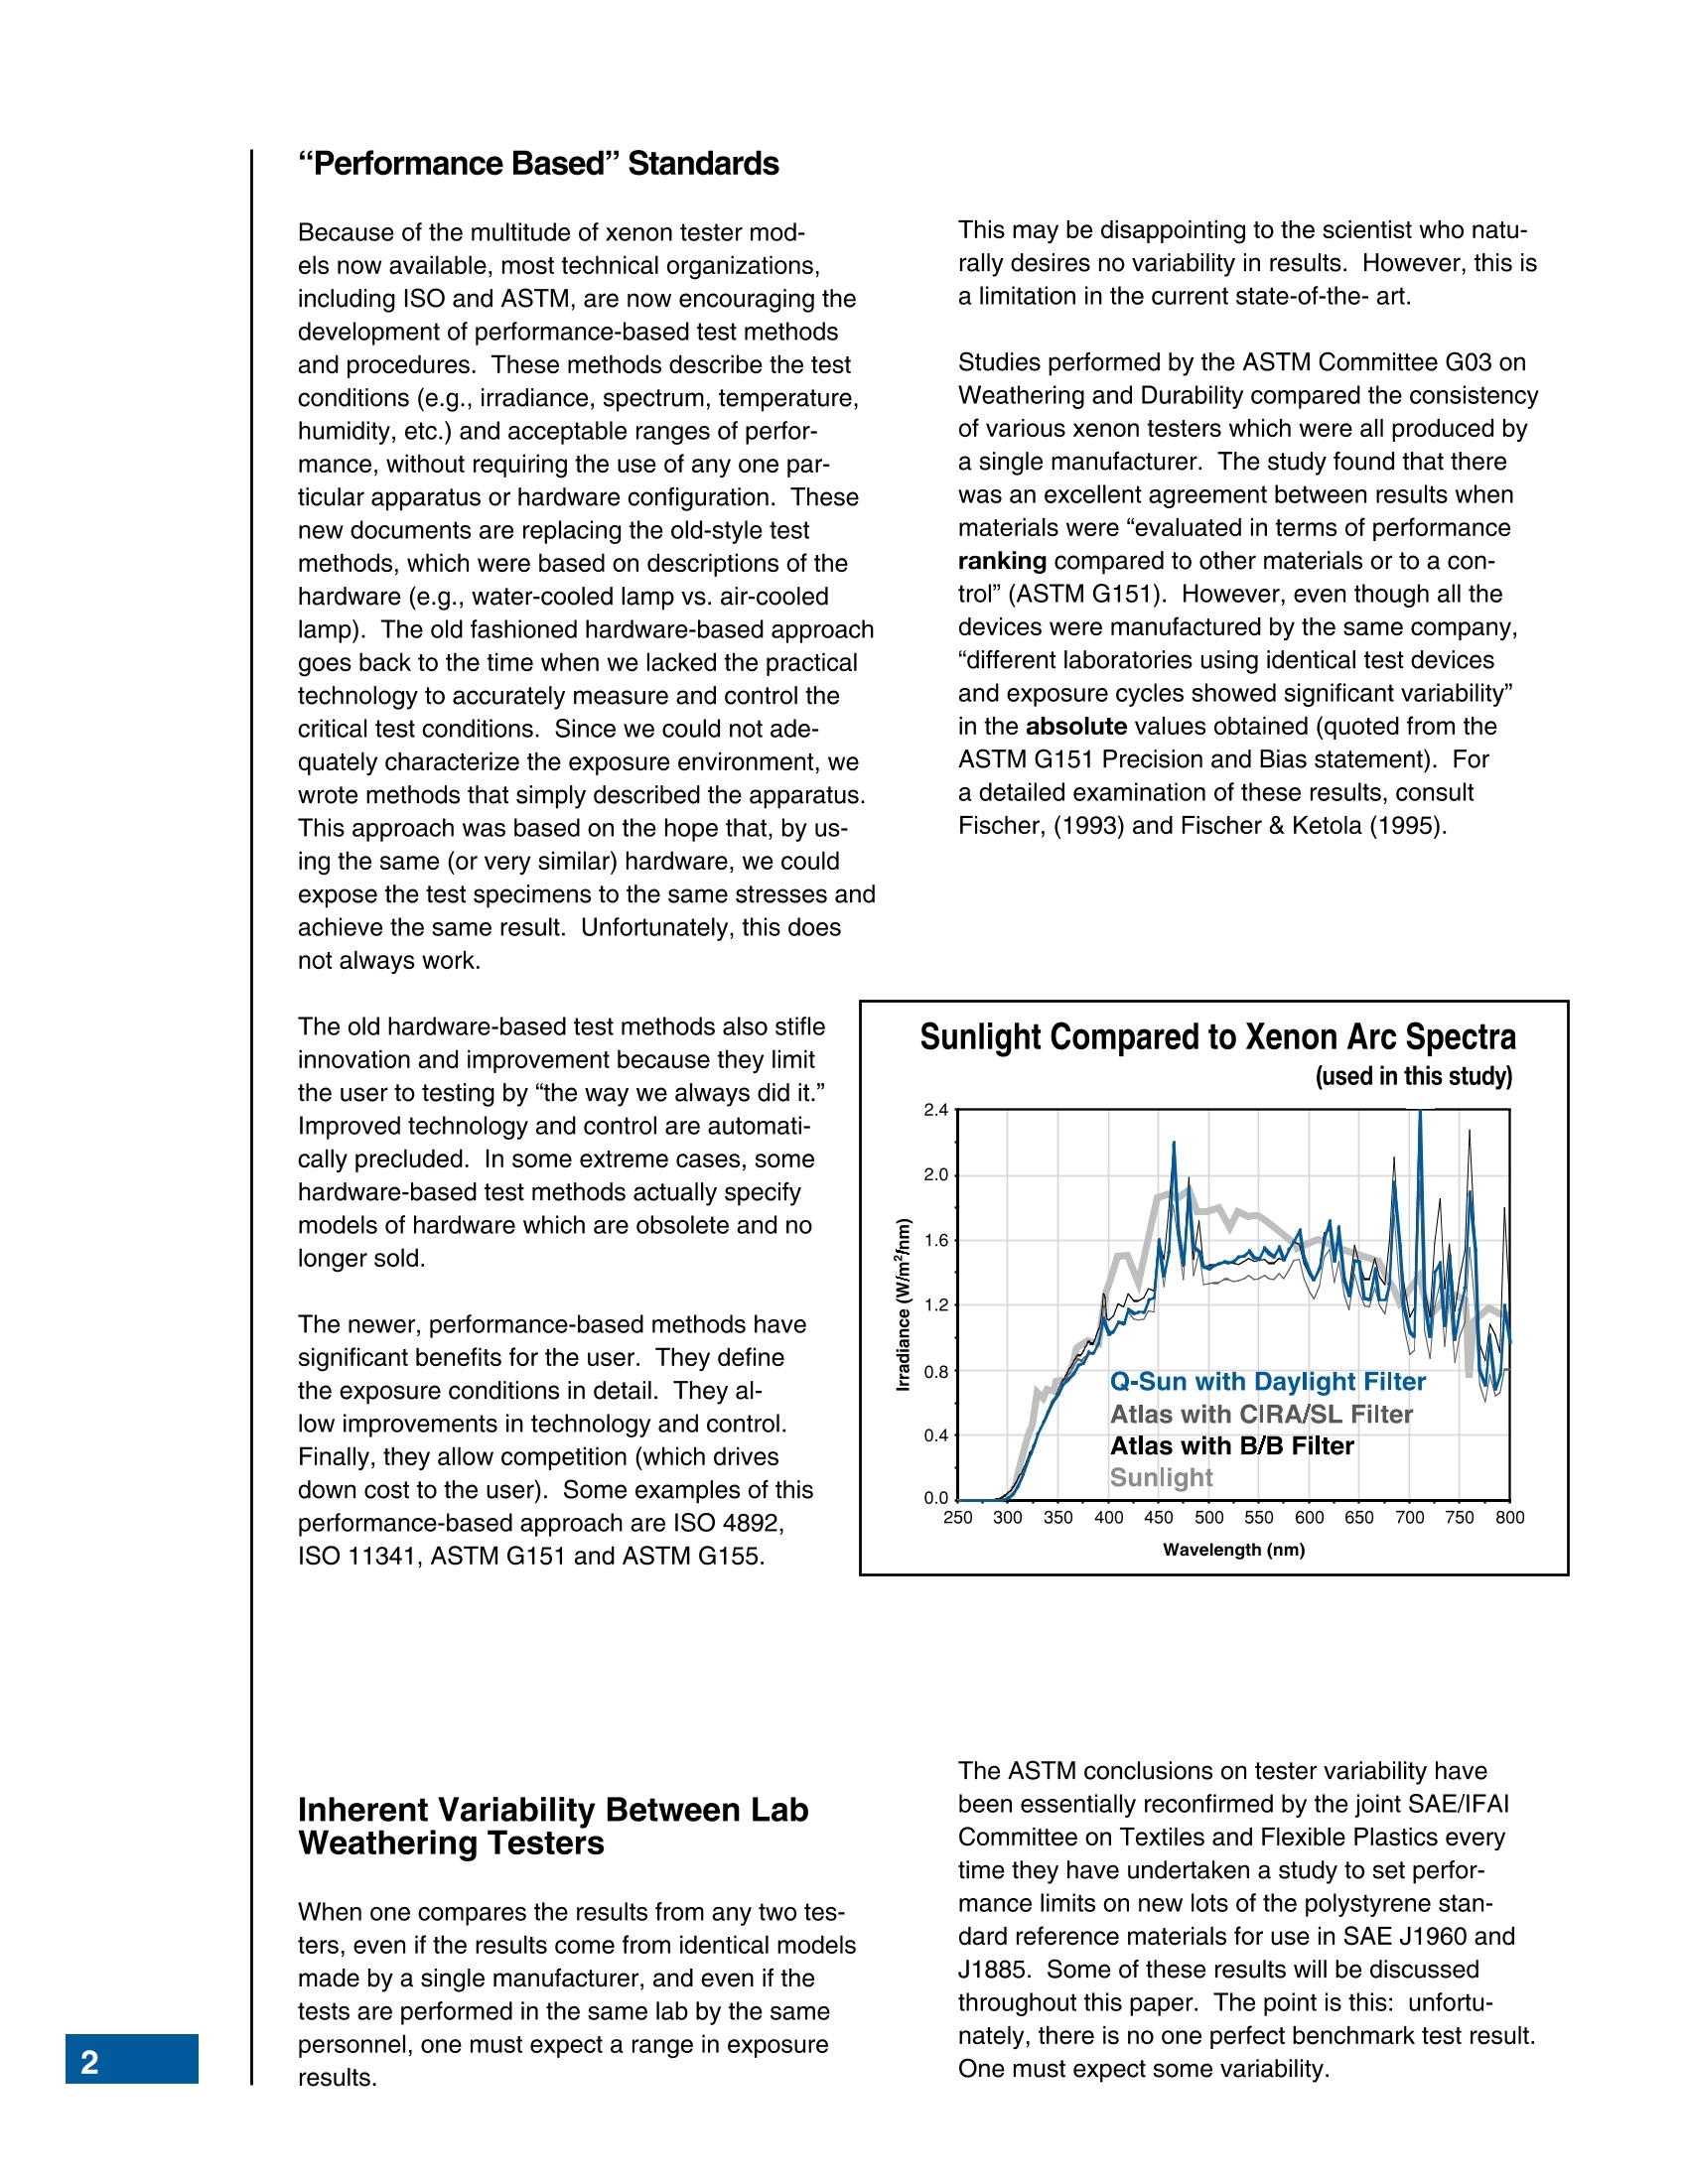
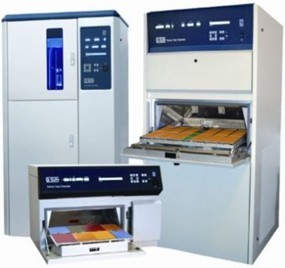
Vinyl Film: Gloss Loss PartII Xenon Arc Exposure Results: Q-Sun & Rotating Drum Testers Compared Patrick Brennan,Greg Fedor and Ronald Roberts,Q-Lab Corporation Abstract This paper investigates whether xenon arc testers with a flat specimen array can provide results whichare functionally equivalent to the results of the old-style rotating drum testers. Ultimately, the validityof performance-based standards in practice is being evaluated. We tested nine different types ofmaterials involving numerous material categories and degradation modes. Remarkably good agree-ment was achieved between the flat array and rotating drum xenon exposures. The results indicatethat the concept of performance-based test protocols can be successful, as long as comparative filtersystems and exposure conditions are properly defined and utilized. Almost all differences in exposureresults fall within the normal variability one would expect from any two testers, regardless of the modelor manufacturer. BackgroundwZ Historically, the majority of xenon arc weathering and light stability testers have been designed with alamp in the center of the chamber and a cylindrical specimen mounting rack which rotates the test spec-imens around the light source like a carousel. This specimen mounting system is frequently describedas a “rotating drum” and was first introduced with the carbon arc lightfastness tester just after the FirstWorld War. There are numerous manufacturers and multiple models and styles of rotating drum styletesters. Some of the drums have straight sides and some have several tiers, slanted in toward thelight source at various angles in an effort to improve irradiance uniformity.Different manufacturersand models, listed in Appendix A.1, employ various systems and methods to control the critical testparameters of irradiance intensity and uniformity, black panel temperature, chamber air temperature,temperature uniformity, relative humidity, air flow, etc. More recently, Q-Sun testers, which have a static flat plane specimen mounting system, have beenintroduced (see Appendix A.2). Like the old rotating drum style testers, these flat plane testers usevarious methods to control the test environment. Rotating Specimen Mounting Systemtraditionally accepted in hardware-basedspecifications. Q-Sun fulfills Performance-Based specifications. Because of the multitude of xenon tester mod-els now available, most technical organizations,including ISO and ASTM, are now encouraging thedevelopment of performance-based test methodsand procedures. These methods describe the testconditions (e.g., irradiance, spectrum, temperature,humidity, etc.) and acceptable ranges of perfor-mance, without requiring the use of any one par-ticular apparatus or hardware configuration. Thesenew documents are replacing the old-style testmethods, which were based on descriptions of thehardware (e.g., water-cooled lamp vs. air-cooledlamp). The old fashioned hardware-based approachgoes back to the time when we lacked the practicaltechnology to accurately measure and control thecritical test conditions. Since we could not ade-quately characterize the exposure environment, wewrote methods that simply described the apparatus.This approach was based on the hope that, by us.ing the same (or very similar) hardware,we couldexpose the test specimens to the same stresses andachieve the same result. Unfortunately, this doesnot always work. The old hardware-based test methods also stifleinnovation and improvement because they limitthe user to testing by “the way we always did it."Improved technology and control are automati-cally precluded. In some extreme cases, somehardware-based test methods actually specifymodels of hardware which are obsolete and nolonger sold. The newer, performance-based methods havesignificant benefits for the user. They definethe exposure conditions in detail. They al-low improvements in technologyand control.Finally, they allow competition (which drivesdown cost to the user). Some examples of thisperformance-based approach are ISO 4892,ISO 11341, ASTM G151 and ASTM G155. Inherent Variability Between LabWeathering Testers When one compares the results from any two tes-ters, even if the results come from identical modelsmade by a single manufacturer, and even if thetests are performed in the same lab by the samepersonnel, one must expect a range in exposureresults. This may be disappointing to the scientist who natu-rally desires no variability in results. However, this isa limitation in the current state-of-the-art. Studies performed by the ASTM Committee G03 onWeathering and Durability compared the consistencyof various xenon testers which were all produced bya single manufacturer. The study found that therewas an excellent agreement between results whenmaterials were“evaluated in terms of performanceranking compared to other materials or to a con-trol"(ASTM G151). However, even though all thedevices were manufactured by the same company,“different laboratories using identical test devicesand exposure cycles showed significant variability"in the absolute values obtained (quoted from theASTM G151 Precision and Bias statement). Fora detailed examination of these results, consultFischer, (1993) and Fischer & Ketola (1995). The ASTM conclusions on tester variability havebeen essentially reconfirmed by the joint SAE/IFAICommittee on Textiles and Flexible Plastics everytime they have undertaken a study to set perfor-mance limits on new lots of the polystyrene stan-dard reference materials for use in SAE J1960 andJ1885. Some of these results will be discussedthroughout this paper. The point is this: unfortu-nately, there is no one perfect benchmark test result.One must expect some variability. The Objective of the Study This paper investigates whether xenon arc testerswith a flat specimen array can provide results whichare functionally equivalent to the results of the old-style rotating drum testers. Ultimately, the validityof performance-based standards in practice is beingevaluated. In order to determine the correlation between xenonarc exposures conducted in rotating drum specimenmounting systems versus flat array specimen sys-tems, we tested nine different types of materials. The material types and degradation modes of thevarious comparative exposures are listed in Table A. Table A.Materials and Modes of Degradation Material Type: Degradation: Opaque Plastics Yellowing Clear Plastics Yellowing AATCC Blue Wools Fading SDC Blue Paper Ref. Matl. Color Change Blue Chip Ref. Matl. Transmission SAE Polystyrene Ref. Matl. Yellowing Printing Inks Color Change Vinyl Film Gloss Loss Artists' Materials Color Change This paper will present the comparison test resultsas a series of summaries. It will demonstrate thatperformance-based methods can successfullyachieve the appropriate results, as long as the criti-cal exposure parameters are properly controlled.The study utilized various models of Q-Sun XenonTest Chambers for the flat array testers and com-pared the results to various models of Atlas rotatingdrum testers. The results show that theQ-Suns produced essentially the same results as theAtlas testers, as long as comparative filter systemsand exposure conditions are used. As a check on xenon arc tester performance, certainSociety of Automotive Engineers (SAE) test methodsrequire that a Polystyrene Reference Material, man-ufactured by Test Fabrics, Inc., be exposed simulta-neously with the material undergoing test. The colorchange of the reference material (delta byellowing)is measured periodically. If the change falls withinpredetermined tolerances, it is assumed that the tes-ter is operating properly. A record of the referencematerial's performance is maintained by the testinglab and may be required as part of the test report. The delta b tolerances for the SAE Polystyrene Reference Material are established by the ReferenceMaterial Subcommittee of the Committee on Textilesand Flexible Plastics. This is a joint committeeof the SAE and the Industrial Fabrics AssociationInternational (IFAI). The tolerances are determinedby extensive testing of each new lot in multipleAtlas xenon arc testers and are only applicable to aparticular lot of reference material. Historically, thedata has been developed in Atlas models Ci5000, Ci4000, Ci65A and Ci35A operated by automotive OEMs, Atlas, and certified automotive suppliers. Exposures: In order to determine if the Q-Sun couldproduce the same color change as the rotating drumtesters, SAE Polystyrene Reference Material wasexposed in Q-Sun Xe-3-HS testers, equipped withQ/B filters. Exposure tests were performed in twodifferent labs according to SAE J1960 conditions(see the Annex for a description of exposure condi-tions). igure1 In each test, four replicate specimens of polystyrene were placed in the flat exposure tray of aQ-Sun in a diagonal pattern from the left-front to theright-rear corner. The specimens remained in thisposition for the duration of the exposure. (Becauseoperating procedures recommend periodic reposi-tioning of the test specimens, this provided a“worstcase” test to highlight any potential variability withinthe chamber.) Color was measured daily for oneweek in accordance with SAE J1960 instructions. The exposure was repeated eight times, with lampsof different ages, to determine if there was any effectfrom xenon lamp aging. Conclusions: When compared with the predeter-mined tolerances, all four replicates, in all eightQ-Sun exposures, performed in two different labs,at every measurement interval (224 measure-ments in total), fell within the range establishedby the SAE committee. The first figure shows theaverage performance ofeach set of four replicatesto quantify any effect of lamp aging. There doesnot appear to be any effect from lamp aging. Thesecond figure shows the performance of each ofthe 32 individual polystyrene plaques. For the SAE Polystyrene Reference Material,the flat array Q-Sun Xe-3-HS gave the same testresults as rotating drum xenon arc models. figure 2 Four opaque plastic plaques were exposed in both aflat array Q-Sun and in a rotating drum Atlas xenonarc tester to assess the relative difference in results.The specimen descriptions are listed in Table B. Table B.Opaque Plastic Specimens Specimen Color Thickness Notes Polyethylene White 0.125” Commercial Sheet ABS/1 White 0.125” Commercial Sheet Polypropylene White 0.1875” Commercial Sheet Nylon Natural 0.1875” 6/6 Commercial Sheet Exposures: Three different tests were conductedto determine the effect of different testers and filtertypes. The exposure employed the 102/18 cycledescribed in the Annex as "Cycle A.” Color wasmeasured every 168 hours in accordance withASTM D2244. Exposure duration was 2,000 hours. Four clear plastic plaques were exposed in boththe Q-Sun and in Atlas xenon arc testers to assessthe relative differences in results. The specimendescriptions are listed below: Table C.Clear Plastic Specimens Specimen Color Thickness Notes Polystyrene Clear 0.110” SAE Ref. Matl. CAB Clear 0.125” Commercial Sheet Polycarbonate Clear 0.125” Commercial Exposures: Three different exposures were con-ducted to determine the effect of different testersand filter types. The exposures utilized the 102/18cycle described in the Annex as“Cycle A.” Colorwas measured every 168 hours in accordance withASTM D2244. Exposure duration was 2,000 hours. The tester/filter configurations were: 1.) Q-Sun Xenon Test Chamber, model Xe-3-S,with Daylight filters 2.) Atlas Ci65 Weather-Ometer with Borosilicate Sinner and Borosilicate S outer filters 3.) Atlas Ci65 Weather-Ometer with CIRA innerand Soda Lime outer filters Conclusions: The exposure results are graphedbelow. There was virtually no difference in expo-sure results from the polystyrene, CAB and acrylic.Both testers and all filter types gave essentiallyidentical results. For the polycarbonate, there wasgood agreement between Q-Sun Daylight andAtlas Ci65 CIRA/SL filter results. However, theboro/boro filters provided a more severe exposure.Presumably this is due to the shorter wavelengthUV spectrum that this filter allows. CAB Plaques Q-Sun with Daylight FiltersCi65 with Boro/Boro Filters Ci65 with CIRA/SLFilters The American Association of Textile Chemists andColorists (AATCC) Test Method 16, Colorfastnessto Light, requires that the operator calibrate thexenon arc device by the use of AATCC Blue WoolLightfastness Standards prior to the performance ofan exposuretest. The AATCC offers 8 Blue Woolsof varying lightfastness levels ranging from L2 (veryfugitive) to L9 (very lightfast). The most commonlyused standards are L2 and L4. The Blue Wools areexposed to continuous light for 20 +/-2 hours at theappropriate temperature, humidity, etc. Afterexpo-sure, the material is evaluated for fading by eithervisual or instrumental procedures. Each new production lot of Blue Wool is extensivelytested by AATCC Committee RA50 on Lightfastnessin multiple rotating drum style xenon arc testers.Historically, the exposure tests have been performedin Atlas models Ci35, Ci65, Ci5000, Ci4000, andCi3000 operated by the AATCC Lab, Atlas, andmembers of Committee RA50. Only after it hasbeen determined that a new lot performs suitably is itreleased to the textile public. Exposures: In order to determine if the flat arrayQ-Sun could produce the same color change as ro-tating drum testers, a series of L2 and L4 Blue Woolexposures were run in a Q-Sun Xenon Test Cham-ber, model Xe-3-HS. The Q-Sun was operated atmethod 16E test conditions for 22 hours (see theAnnex for a full description of the 16E conditions).After exposure, the color was measured in accor-dance with AATCC Evaluation Procedure 6. For each test, four replicate specimens of theAATCC Blue Wool Lightfastness Standards wereplaced in the exposure tray of the Q-Sun in a diago-nal pattern from the left-front to the right-rear corner.The specimens remained in this position for theduration of the exposure. The exposure was repeated four times with L2 andfour times with L4. Conclusions: When compared with the pre-determined tolerances, all four replicates, in alleight exposures (total of 32), fell within the rangeestablished by AATCC Test Method 16. In AATCC Test Method 16, the flat array Q-SunXe-3-HS gave the same test result as rotatingdrum testers on the AATCC L2 and L4 Blue WoolLightfastness Standards. SDC Blue Paper Reference Material:Color Change The Society of Dyers & Colourists (SDC) suppliedspecimens of blue pigmented papers of varying light-fastness (Lightfastness Standards 1-8) for a study.These experimental papers are intended to have asimilar use as the ISO Blue Wools as a referencematerial. The SDC Lightfastness Standards vary inpigment formulations and in sensitivity to UV light. Exposures: The SDC papers were exposed in aQ-Sun and in an Atlas Ci35 in accordance withASTM D4303, Standard Test Methods for Evalu-ating Lightfastness of Artists’ Pigments, Method C(see Annex for a description of exposure conditions).Instrumental color measurements were performedbefore and after exposure in accordance with ASTME 1349 and D 2244. The tester/filter configurations were: 1.) Q-Sun Xenon Test Chamber, with WindowGlass filters 2.) Atlas Ci35 Weather-Ometer with Borosilicate Sinner and Soda Lime outer filters. Results: The color change is reported in total colordifference units (delta E). Following is the datashown in Table D and the graph below. Table D. SDC Blue Papers-delta E Specimen Q-Sun Xenon Ci35 Xenon SDC-1 68.3 72.8 SDC-1 72.4 73.7 SDC-2 71.6 70.8 SDC-2 73.7 72.2 SDC-3 80.8 79.0 SDC-3 79.6 79.2 SDC-4 9.6 11.0 SDC-4 9.3 9.9 SDC-5 10.4 12.4 SDC-5 9.5 12.8 SDC-6 7.2 10.3 SDC-6 7.2 10.2 SDC-7 6.1 9.4 SDC-7 5.9 9.1 SDC-8 3.6 5.9 SDC-8 3.3 6.3 Average: 32.4 34.1 Conclusions: Although there were some minordiscrepancies in the absolute color change values,as shown in the accompanying figure, the Spear-man Rank Order Correlation between the two ex-posures was an excellent 0.96. Rankings of 0.90and higher indicate very close correlation. If thereis perfect agreement in ranking, the Spearman rhowill have a value of 1.0. The two different testers gave the same colorchange results. A series of translucent blue plastic plaques devel-oped by Textile Innovators, Inc., have been used instudies by technical committees of the American As-sociation of Textile Chemists and Colorists (AATCC)and the International Standards Organization (ISO)as potential reference materials for use in weath-ering and lightfastness studies. The effects ofexposure are determined by measuring the changein either reflectance or transmission at 610 nm. Theintent was to use these “Blue Chips”in weatheringtests. The Blue Chips could thereby complementthe AATCC Blue Wools by providing a referencematerial which could withstand water spray. TheBlue Chips are 0.125 inches thick. Exposures: Four different chips, designed to pro-videvarying levels of lightfastness, were exposedin both the Q-Sun and an Atlas xenon arc tester toassess the relative differences in results. Threedifferent exposures were conducted to determinethe effect of different testers and filter types. Theexposures used the 102/18 cycle described in theAnnex as "Cycle A.” Degradation was monitored bymeasuring transmission at 610 nm every 168 hoursin accordance with ASTM D2244. Exposure dura-tion was 2,000 hours. The tester/filter configurations were: 1.) Q-Sun Xenon Test Chamber, model Xe-3-S,with Daylight filters 2.) Atlas Ci65 Weather-Ometer with Borosilicate Sinner and Borosilicate S outer filters 3.) Atlas Ci65 Weather-Ometer with CIRA innerand Soda Lime outer filters. Conclusions: As shown in the figures below, thechange was linear for all of the chips, regardlessof the tester used. The differences in xenon spectra from the differentfilters used in the two Ci65 exposures seem tohave had no significant effect on the Blue Chipexposure results. There was no significant dif-ference in the results between the rotating drumtesters versus the flat array Q-Sun Xe-3-S. Artists’Materials: Color Change ASTM Subcommittee D01.57 on Artists’Materialsconducted a study to determine the correlationbetween various exposure methods on a series of15 colored artists'pencils. Although the study alsoincluded outdoor exposures under glass, for this pa-per we will only focus on a comparison of the resultsfrom a Q-Sun and an Atlas Ci35. (For a full discus-sion of the data, including correlation to outdoors,see Brennan & Everett, 2000). Three manufacturers participated in the study. Eachprepared two replicate specimens of five differentcolored pencil types. Each pencil type was appliedto a replicate paper substrate. To provide a repre-sentative spread in the data, the specimens providedby the manufacturers were of various colors and du-rability levels, ranging from very good to very poor. Exposures: The specimens were exposed in aQ-Sun and in an Atlas Ci35 in accordance withASTM D4303, Standard Test Methods for EvaluatingLightfastness of Artists’ Pigments, Method C (seeAppendix for a description of exposure conditions).Instrumental color measurements were performedbefore and after exposure in accordance with ASTME 1349 and D 2244. The tester/filter configurations were: 1.) Q-Sun Xenon Test Chamber, with WindowGlass filters 2.) Atlas Ci35 Weather-Ometer with Borosilicate Sinner and Soda Lime outer filters. Table E.Artists’Materials Color Data -delta E Printing Inks: Color Change Historically, carbon arcs were used to test thelightfastness of printing inks. However, over thelast 15 years, most labs have switched to xenon arcbecause the xenon’s spectrum allows a much morerealistic exposure test. Exposures: Comparative exposures were con-ducted to determine the correlation between testersand filter types. The exposures utilized the AATCC16 E conditions as described in the Annex. Colorwas measured every 20 hours in accordance withASTM D2244. Exposure duration was 100 hours. Seventeen ink formulations from one manufacturerwere tested to determine the relationship betweenthe rotating drum style and flat array style xenontesters. The tester/filter configurations were: 1.) Q-Sun Xenon Test Chamber, model Xe-3-S,with Window Glass filters 2.) Atlas Ci65 Weather-Ometer with Borosilicate Sinner and Soda Lime outer filters. 16 Exposure Time (hours) Green U Ci65 30 Pantone 348 U Yosemite Green 20· Q-Sun Ci65 10 Pantone 356 U Pine Green Q-Sun Ci65 Q-Sun 10 Ci65 5 0 20 40 60 80 100 Exposure Time (hours) Conclusions: There was a wide range in the per-formance of the various colored printing inks. Somechanged dramatically, while several were fairlystable. For 11 of the 17 specimens, the delta E colorchange was essentially identical in both exposures.For three of the inks, the Atlas Ci65 exposure pro-vided slightly faster fading. For the remaining threeinks, the Q-Sun Xenon was slightly faster. Table F.Data Sets with a rho of 0.9975 Material Q-Sun Atlas Rank Order Number delta E delta E Q-Sun Atlas 55 45.43 44.27 17 16 56 45.36 49.14 16 17 57 30.64 36.79 15 15 58 29.60 31.57 14 14 59 29.08 28.73 13 13 60 16.17 16.20 9 9 61 4.80 4.51 3 3 62 21.71 19.04 10 10 63 4.18 4.31 2 2 64 11.92 12.84 6 6 65 22.74 23.43 11 11 66 13.49 13.54 7 7 67 1.46 1.56 1 1 68 15.94 15.54 8 8 69 28.94 27.29 12 12 70 8.00 7.65 4 4 71 10.54 9.84 5 5 Spearman rho=0.9975 One way to analyze the data is to compare the rankorder of the two data sets. Rankings of 0.90 andhigher indicate very close correlation. If there isperfect agreement in ranking, the Spearman rho willhave a value of 1.0. As shown in Table F, there was excellent agreementbetween the data sets with a rho of 0.9975. ( The results from t he two testers exhibited excellent agreement. There were no significant differences be-tween the test r esults in either absolute numbers or in rank order. ) Fischer and Ketola of 3M have published severalpapers examining the data generated by ASTMCommittee G03 (on Weathering and Durability) onthe precision, repeatability and reproducibility ofvarious types of weathering testers. These studiesemployed a series of 10 different colored polyvi-nyl chloride films (0.002 inch thick, with pressuresensitive adhesive) provided by 3M. The films wereapplied over aluminum test panels. These particularspecimens were chosen for the ASTM studies be-cause the durability (gloss retention) varies signifi-cantly among the ten materials. In order to determine the correlation in test resultsbetween rotating drum and flat array xenon testers,these same 3M films were used in a comparativestudy. Exposures: Three different exposures were con-ducted to determine the effect of different testersand filter types. The exposures employed the102/18 cycle described in the Annex as "Cycle A."Gloss loss (60°) was measured every 168 hours inaccordance with ASTM D523. Exposure durationwas 2,000 hours. The tester/filter configurations were: 1.) Q-Sun Xenon Test Chamber, model Xe-3-S,with Daylight filters 2.) Atlas Ci65 Weather-Ometer with Borosilicate Sinner and Borosilicate S outer filters 3.) Atlas Ci65 Weather-Ometer with CIRA innerand Soda Lime outer filters. Exposure Time (hours) Vinyl Film: Gloss Loss Conclusions: Initial gloss measurements of the unexposed specimens ranged from 75 to 85. After 2000hours exposure, the gloss ranged from 15 to 75. One way to look at the relationship of the data is to plot the Ci65 results vs the Q-Sun results as shownin the figures below. If the two testers gave the exact results in absolute numbers, the data would line upexactly on the 45° diagonal line bisecting the graph. As illustrated in figure 1, there was extremely goodagreement between the two data sets. A third way to analyze the data is to compare the rank order of the two data sets. As shown in figure 2,there was perfect agreement between the data sets after 1000 hours exposure. Regardless of the timeinterval, the rho was better than 0.9. The Q-Sun and the Ci65 showed excellent correlation on the 3M vinyl films. Given the normal range of pre-cision, repeatability and reproducibility in xenon testers, it would be unlikely that two exposures done in the figure l 5 3 7 4 10 no. figure 2 1.0 0.8 Spearman Rank Correlation vs. ExposureTime 0.6 0.4 0.2 0.0D- 0 500 1000 1500 2000 Exposure Time (hours) Summary & Conclusions 1. In the nine studies documented in this paper, involving numerous material categories and degradation modes,remarkably good agreement was achieved between the flat array and rotating drum xenon exposures. The re-sults indicate that the concept of performance-based test protocols can be successful, as long as comparative fil-ter systems and exposure conditions are properly defined and utilized. Almost all differences in exposure resultsfall within the normal variability one would expect from any two testers, regardless of the model or manufacturer. 2. The Q-Sun Daylight filters and the Atlas CIRA/SL filters are a better match with each other (and with sun-light). However, certain filter systems, notably the Borosilicate/Borosilicate combination used in the rotating drumtesters, may in some instances, give more severe (i.e., faster) results on some materials. Presumably, this isbecause they transmit unnaturally short UV wavelengths. Cycle A Exposure Conditions Irradiance controlled at 0.55 W/m2/nm @ 340 nm; Daylight filters; . 102 minutes light @ 63℃ Black Panel Temperature; 18 minutes of light & water spray, temperature not controlled; ● Specimens repositioned weekly. Note: The Atlas Ci65 exposures controlled the humidity at 50% RH during the light cycle. The Q-Sun was notequipped to control humidity, but the effective RH during the exposure was approximately 15% (calculated onambient conditions). AATCC Test Method 16E Exposure Conditions Irradiance controlled at 1.10 W/m2/nm @ 420 nm; Window Glass filters; . Continuous Light Only @ 63℃ Black Panel Temperature; . 43℃ Chamber Air Temperature (dry Bulb); 30% Relative Humidity; Specimens were not repositioned. ASTM D4303, Method C, Exposure Conditions Irradiance controlled at 0.35 W/m2/nm @ 340 nm; Window Glass filters; Continuous Light only @ 63℃ Black Panel Temperature; Specimens were not repositioned. Note: The Atlas Ci35 exposure controlled the humidity at 55% RH. The Q-Sun used in this exposure was notequipped to control humidity, but the effective RH during the exposure was approximately 15% (calculated onambient conditions). SAE J1960 Exposure Conditions Irradiance controlled at 0.55 W/m2/nm @ 340 nm during light cycle; . Extended UV Filters (quartz inner/borosilicate outer or Q-Panel type Q/B); 40 minutes light @ 70℃ Black Panel Temperature, 50% Relative Humidity; 20 minutes light & water spray on the specimen face; . 60 minutes light @ 70°℃ Black Panel Temperature, 50% Relative Humidity; . 60 minutes dark & water spray on specimen face & back @38℃ Black Panel Temperature; Specimens were not repositioned. Note: In the Q-Sun exposures there was one small deviation from the SAE J1960 procedure: during the dark/moisture cycle. Front spray only (no "back spray"). Appendix: Summary of Manufacturers & Models Table A.1 Manufacturers/Models ofRotating Drum Xenon Test Chambers Manufacturer Model Suga WEL-6X-HC-B-Ec WEL-45AX-HC FAL-25AX-HC Ci35 Ci65 Atlas Ci3000 Ci5000 Ci4000 Heraeus Xenotest 1200 Xenotest 150 Xenotest Alpha Xenotest Beta Table A.2 Manufacturers/Models ofStatic Flat Plane Test Chambers Manufacturer Model Suga Table Sun Atlas XR260 K.H. Steuerangle Solar Climatic Heraeus Suntest Q-Panel Q-Sun Xe-1 Q-Sun Xe-3 Brennan, P., and Everett, E.,Lightfastness of Artists’ Pencils,Natural and Accelerated Exposure Results,ASTM STP 1385,2000 Fischer, R., Results of Round Robin Studies of Light and Water Exposure Standard Practice, ASTMSTP 1202, 1993 Fischer, R., and Ketola, W., Impact of Research on Development of ASTM Durability Testing Standards,ASTM STP 1294, 1995 Ketola, W., and Fischer, R.,Characterization and Use of Reference Materials in Accelerated DurabilityTests, VAMAS Technical Report No. 30, available from NIST, Gaithersburg, MD. Ketola, W., and Skogland, T., Fischer, R., Effects of Filter and Burner Aging on the Spectral PowerDistribution of Xenon Arc Lamps, ASTM STP 1294, 1995 AATCC Test Method 16, Colorfastness to Light ASTM D2244, Standard Test Method for Calculation of Color Differences from Instrumentally MeasuredColor Coordinates ASTM D523, Standard Test Method for Specular Gloss ASTM D4303, Standard Test Methods for Evaluating Lightfastness of Artists’ Pigments ASTM E1349, Standard Test Method for Reflectance Factor and Color by Spectrophotometry UsingBidirectional Geometry ASTM G151, Standard Practice for Exposing Nonmetallic Materials in Accelerated Test Devices thatUse Laboratory Light Sources, Annual Book of ASTM Standards, Vol 14.04 ASTM G155, Standard Practice for Operating Xenon-Arc Light Apparatus for Exposure of NonmetallicMaterials, Annual Book of ASTM Standards, Vol 14.04 ISO 4892-2, Plastics -Methods of Exposure to Laboratory Light Sources- Xenon Arc SAE J1885,Accelerated Exposure of Automotive Interior Trim Components Using a Controlled IrradianceWater Cooled Xenon Arc Apparatus SAE J1960, Accelerated Exposure of Automotive Exterior Material using a Controlled Irradiance WaterCooled Xenon Arc Apparatus Notes: This paper, Xenon Arc Exposure Results: Rotating vs. Q-Sun Specimen Mounting Systems Compared,was originally published at the Materials Life Society (Japan), 5th International Symposium on Weatherability;October 2002 SAE Polystyrene Reference Material may be obtained from Test Fabrics Inc., P.O. Box 420, 200 Blackford Ave.,Middlesex, NJ 08846 AATCC Blue Wool Lightfastness Standards are available from the American Association of Textile Chemists andColorists. Acknowledgements Q-Lab Corporation is responsible for the accuracy of these test results. However, we would like tothank the following companies for supplying test materials: The American Association of Textile Chemists and ColoristsThe Society of Dyers & Colourists (UK)3M CompanyAmerichem CorporationTextile Innovators, Inc.Test Fabrics, Inc. Q-Lab Corporation www.q-lab.com Q-Lab HeadquartersQ-Lab Europe, Ltd.Q-Lab China& Instruments DivisionBolton, EnglandShanghai, ChinaQCleveland, OH USATel. +44 (0) 1204-861616Tel.+1-440-835-8700 Tel. +86-21-5879-7970 Weathering Research Service LX-5021.4 Q·LAB Q-Lab Florida Q-Lab Arizona )2007 Q-Lab CorporationMiami, FL USA Phoenix, AZ USATel. +1-305-245-5600 Tel. +1-623-386-5140 All Rights Reserved Q-Panel, QUV, Q-Lab, Q-Sun, Q-Trac, and Solar Eye are trademarks of Q-Lab Corporation.
关闭-
1/20
-
2/20
还剩18页未读,是否继续阅读?
继续免费阅读全文产品配置单
美国Q-Lab公司中国代表处为您提供《材料,成品中耐候老化性能检测方案(氙灯试验箱)》,该方案主要用于汽车灯具中耐候老化性能检测,参考标准《暂无》,《材料,成品中耐候老化性能检测方案(氙灯试验箱)》用到的仪器有Q-SUN氙灯试验箱。
我要纠错
推荐专场
氙灯耐气候试验箱、氙灯老化试验箱
更多
相关方案
 咨询
咨询