
方案详情文
智能文字提取功能测试中
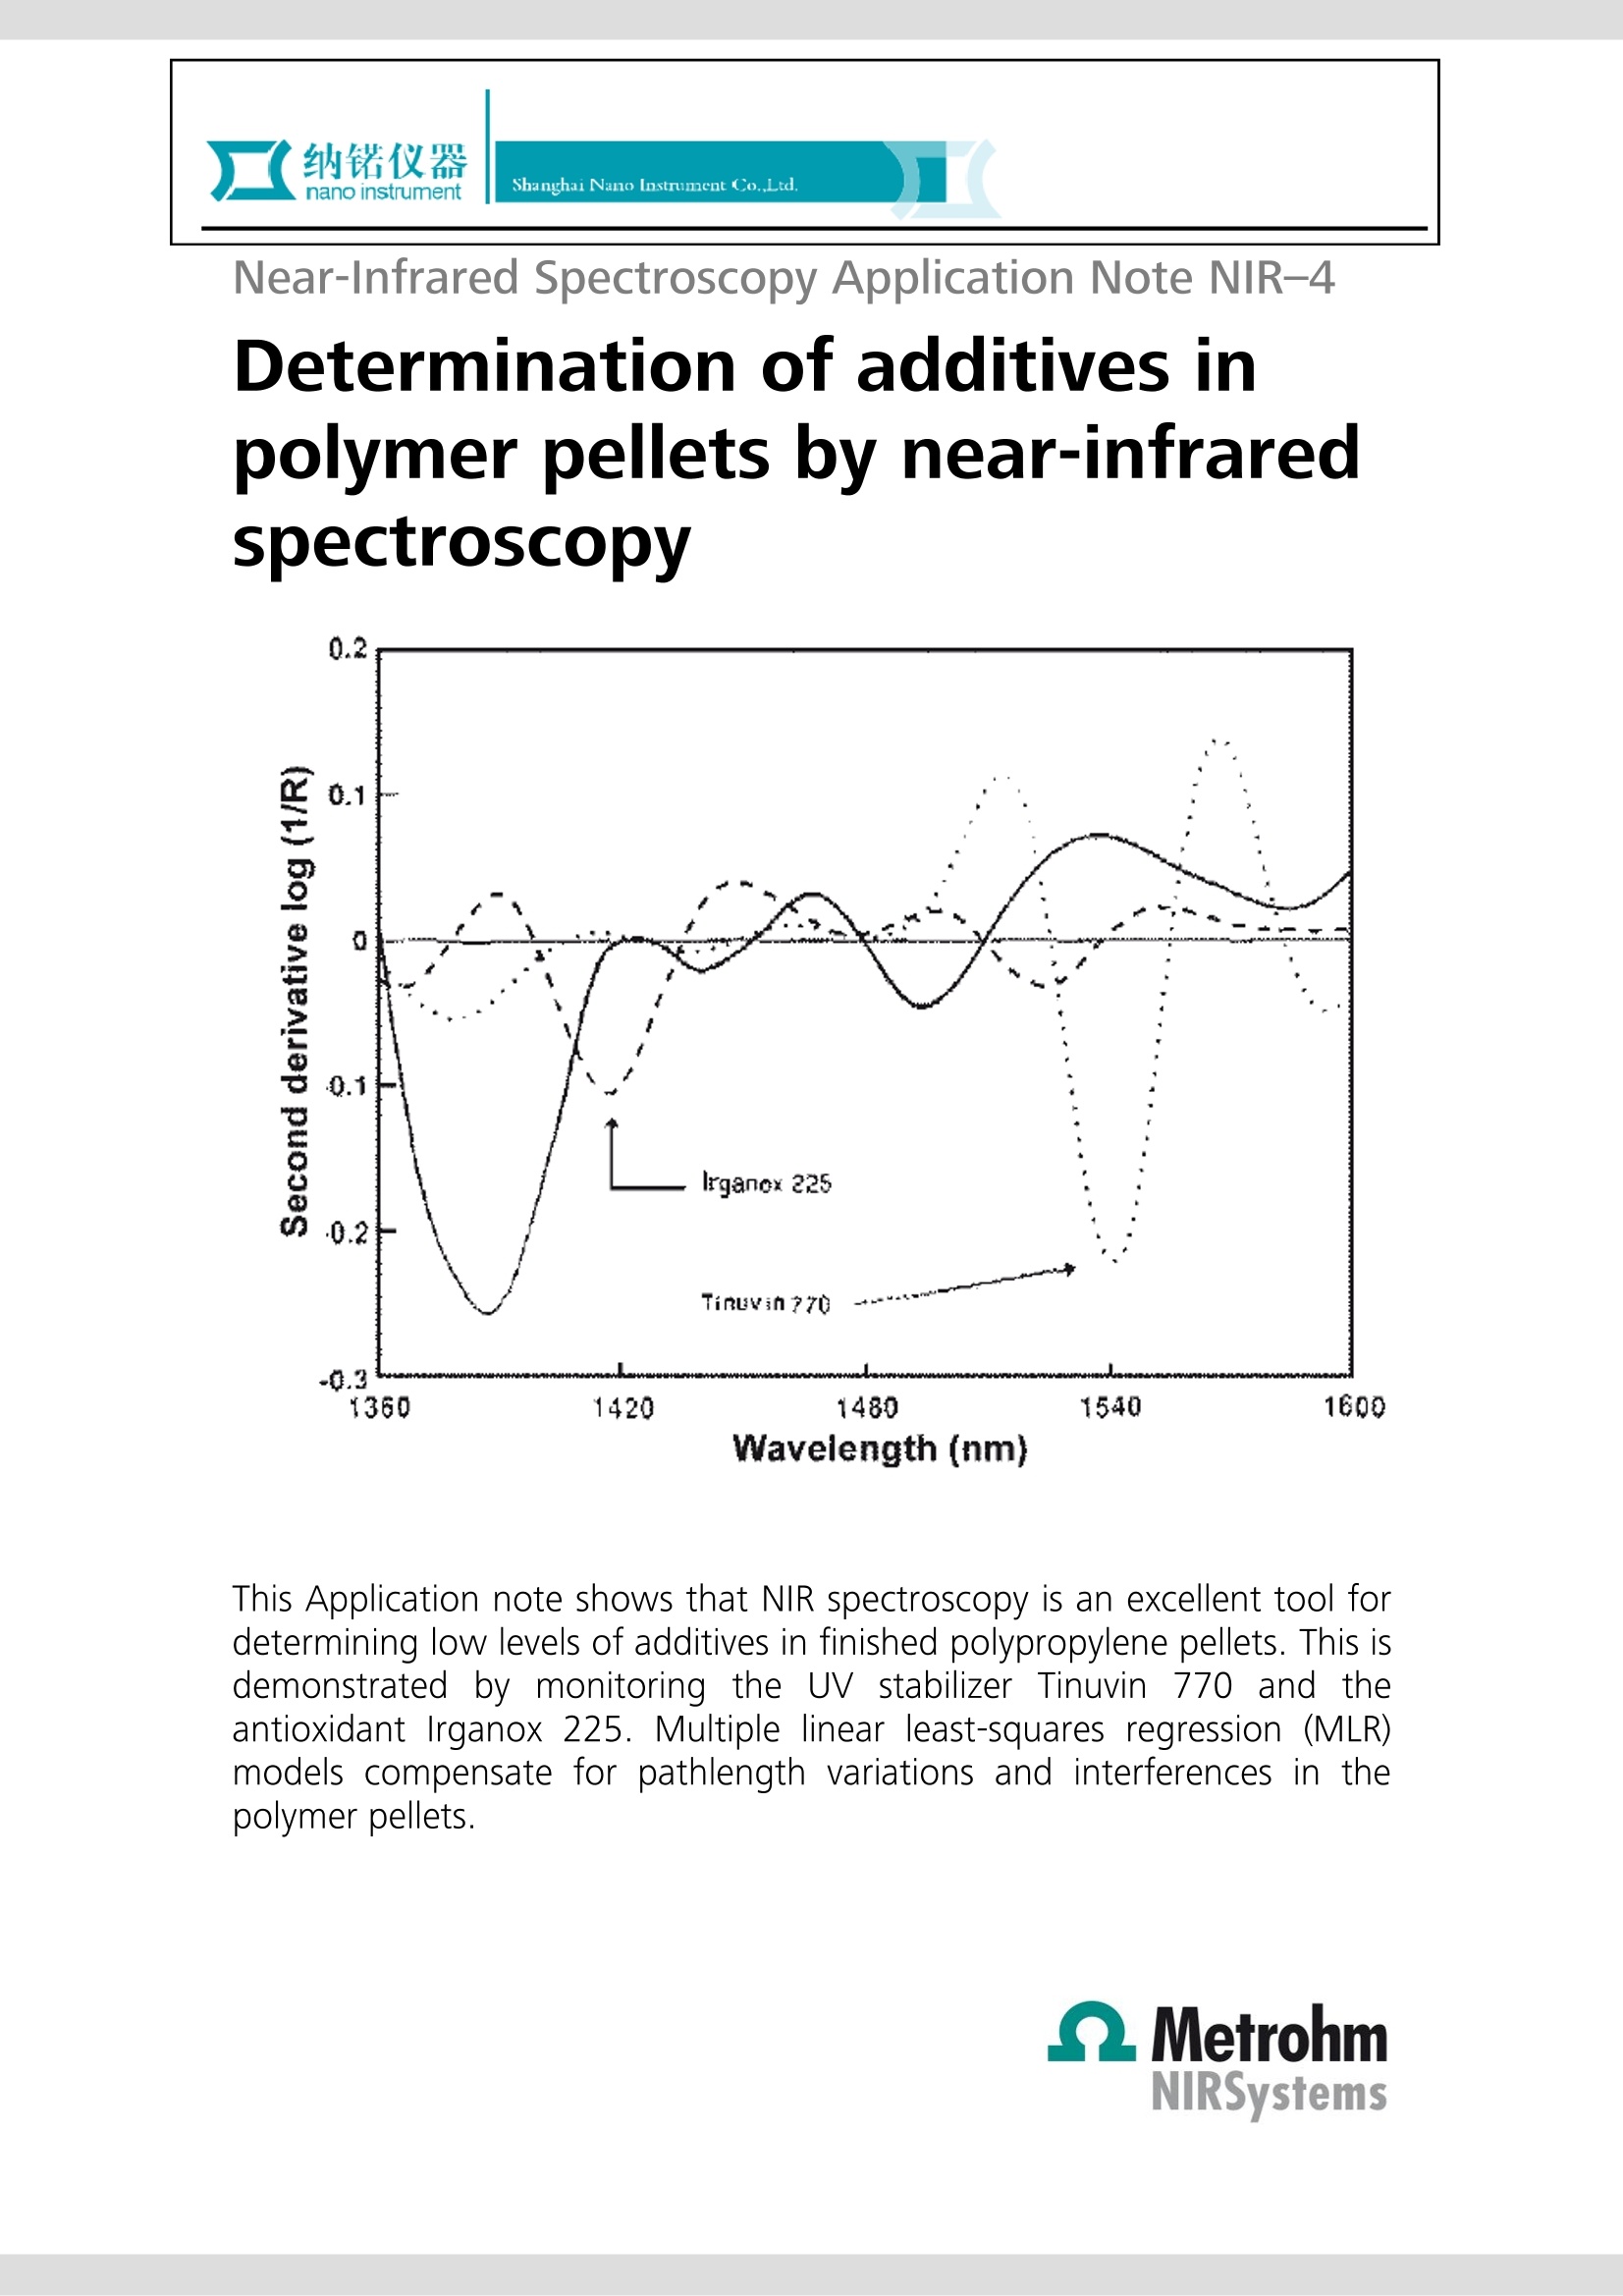
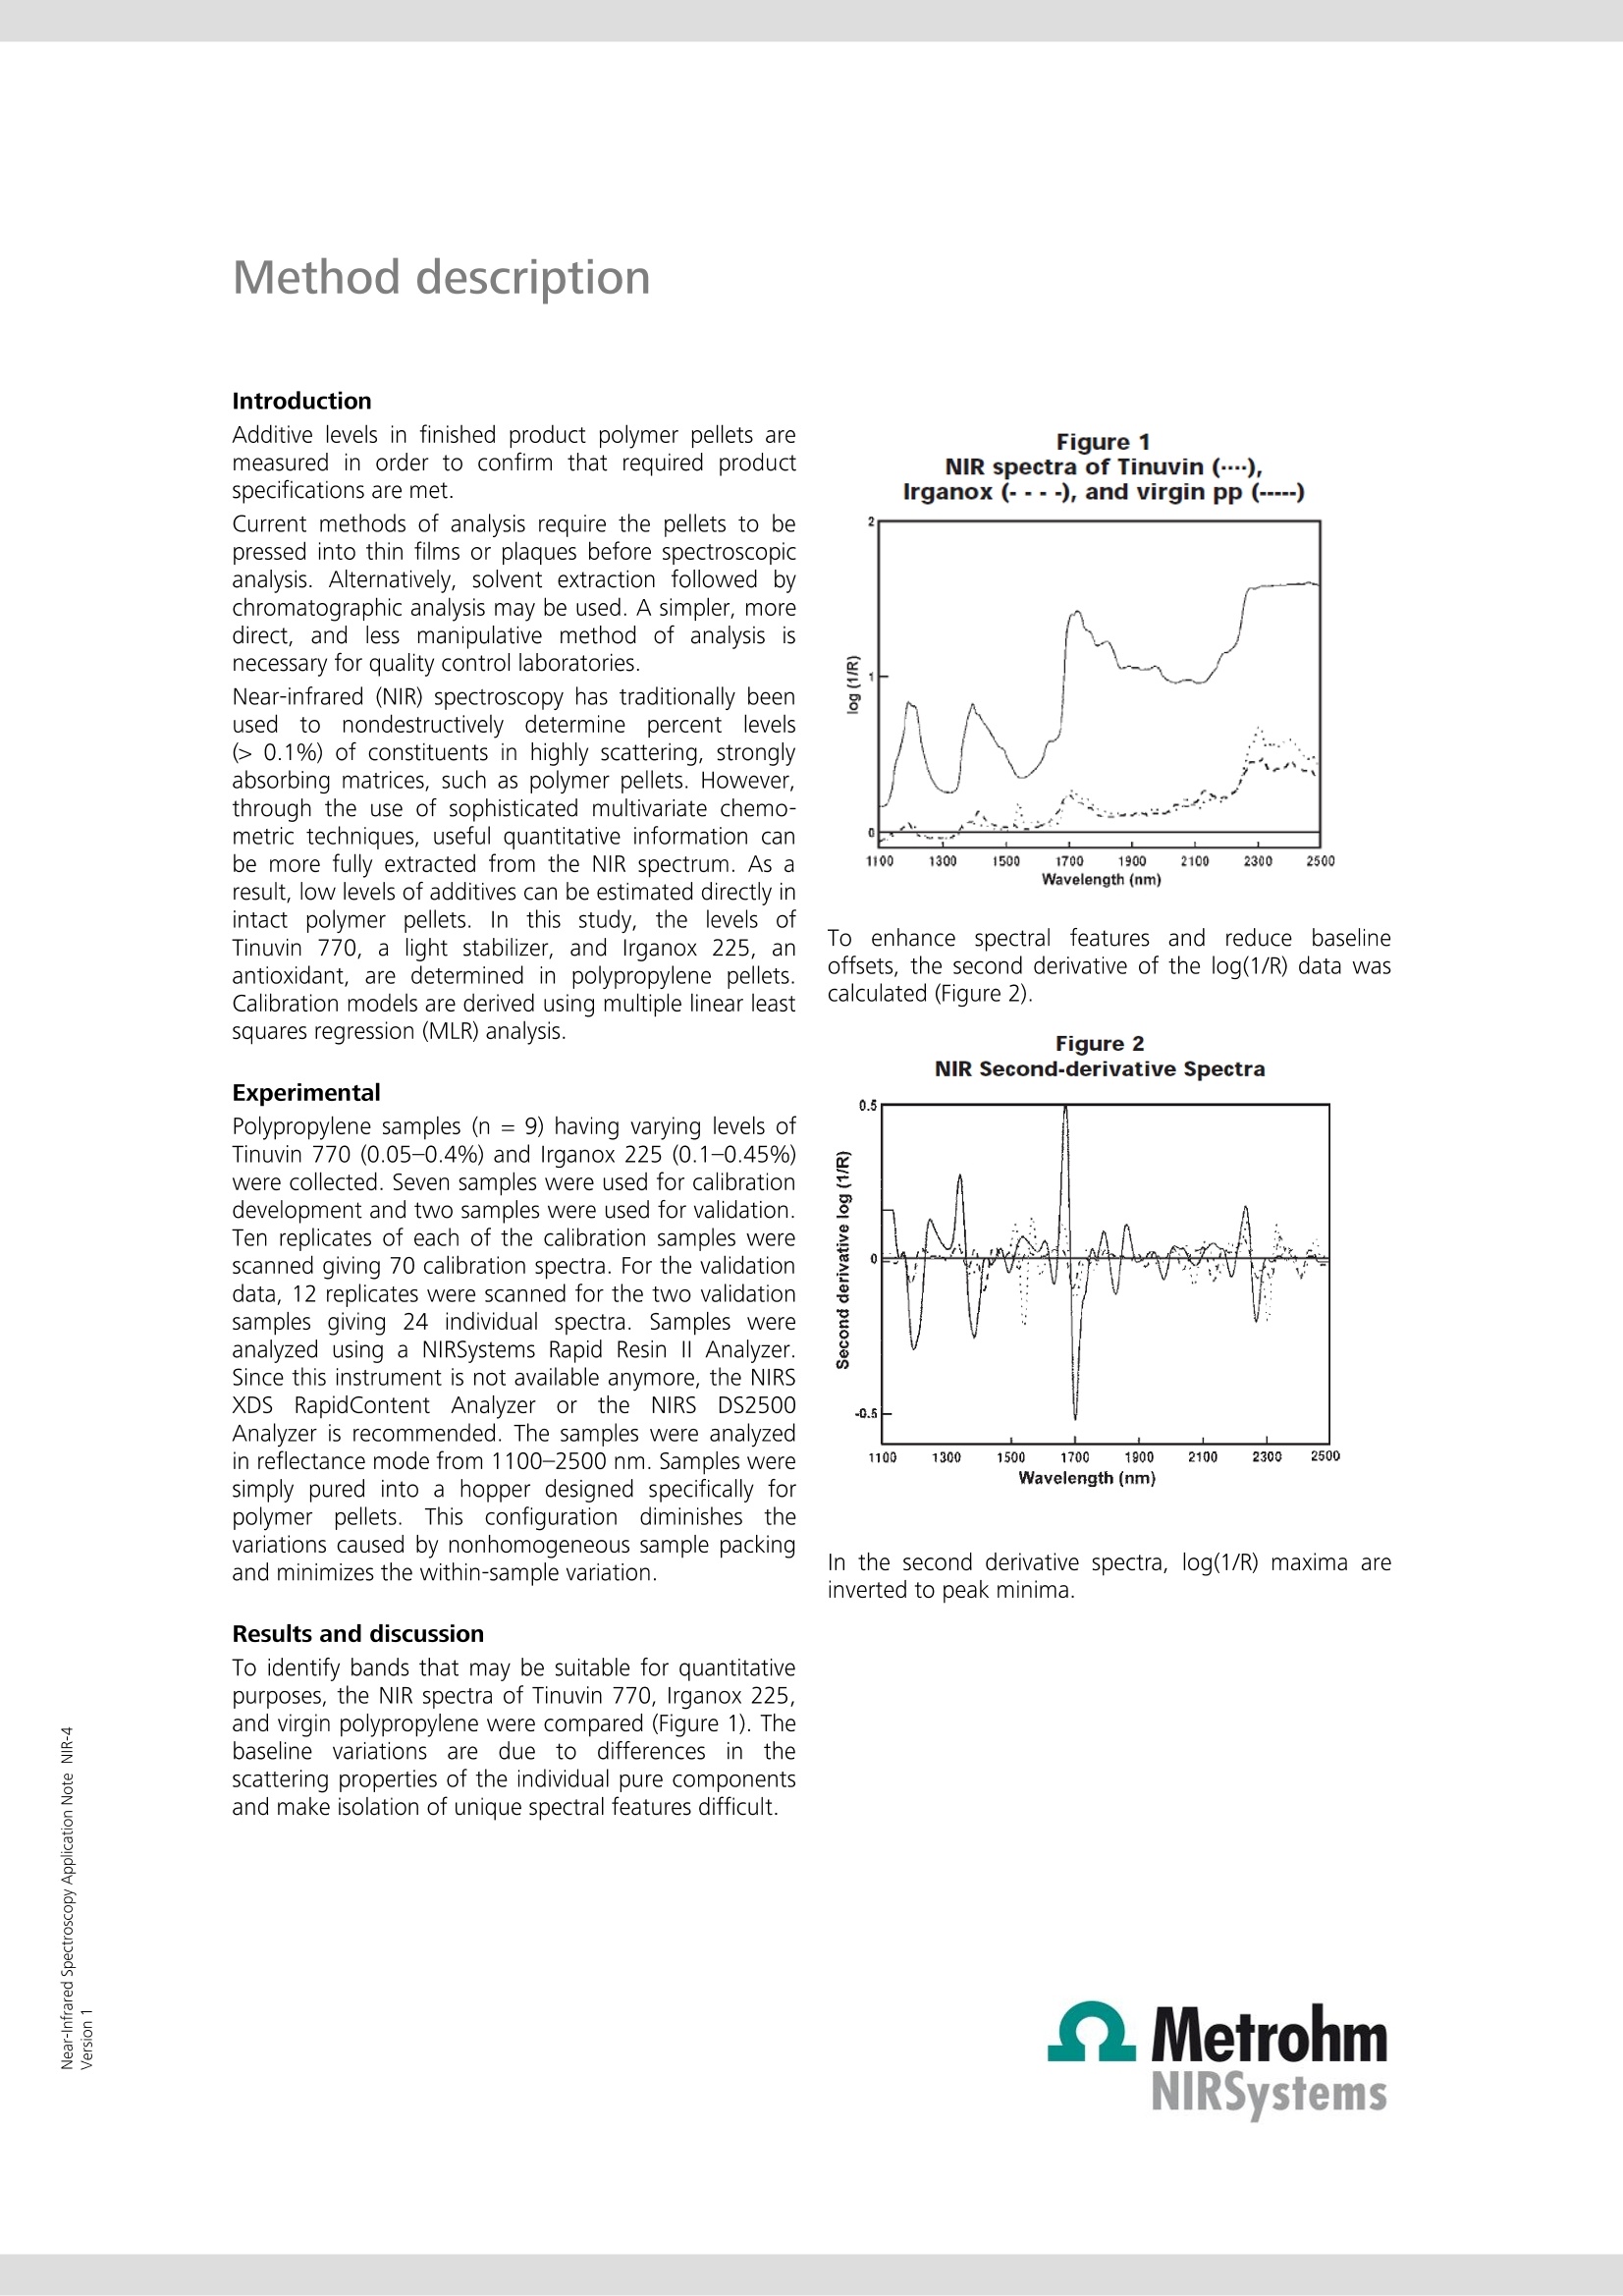
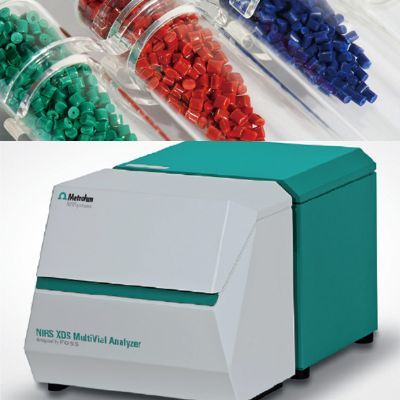
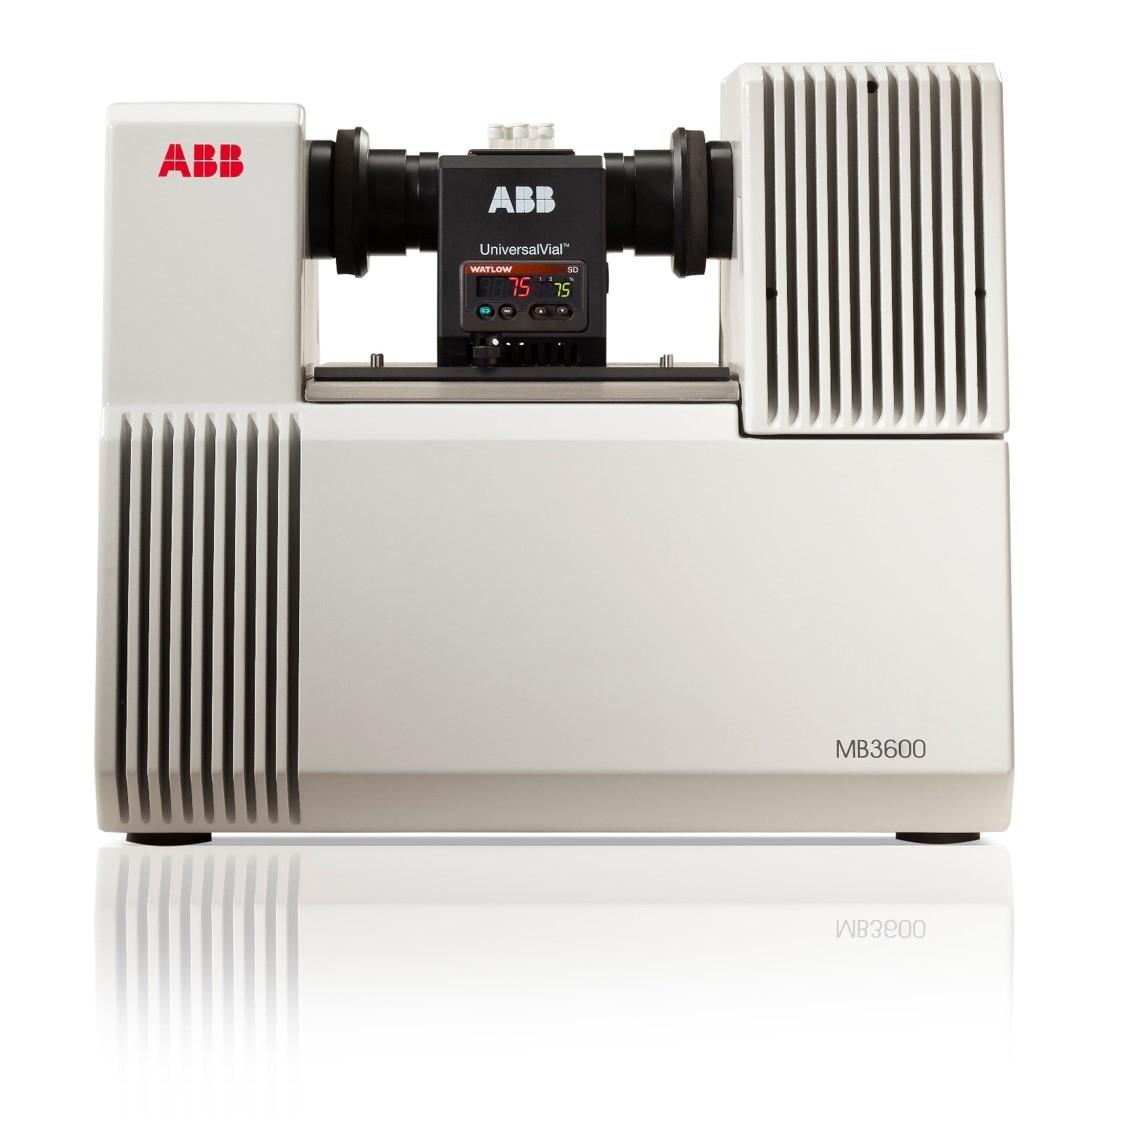
Near-Infrared Spectroscopy Application Note NIR-4 Determination of additives inpolymer pellets by near-infraredspectroscopy This Application note shows that NIR spectroscopy is an excellent tool fordetermining low levels of additives in finished polypropylene pellets. This isdemonstrated by monitoring the UV stabilizer Tinuvin 770 and theantioxidant Irganox 225. Multiple linear least-squares regression (MLR)models compensate for pathlength variations and interferences in thepolymer pellets. Introduction Additive levels in finished product polymer pellets aremeasured in order to confirm that required productspecifications are met. Current methods of analysis require the pellets to bepressed into thin films or plaques before spectroscopicanalysis. Alternatively, solvent extraction followed bychromatographic analysis may be used. A simpler, moredirect, and less manipulative method of analysis isnecessary for quality control laboratories. Near-infrared (NIR) spectroscopy has traditionally beenused to nondestructively determine percent levels(> 0.1%) of constituents in highly scattering, stronglyabsorbing matrices, such as polymer pellets. However,through the use of sophisticated multivariate chemo-metric techniques, useful quantitative information canbe more fully extracted from the NIR spectrum. As aresult, low levels of additives can be estimated directly inintact polymer pellets. In this study, the levels ofTinuvin 770, a light stabilizer, and Irganox 225, anantioxidant, are determined in polypropylene pellets.Calibration models are derived using multiple linear leastsquares regression (MLR) analysis. Experimental Polypropylene samples (n =9) having varying levels ofTinuvin 770 (0.05-0.4%) and Irganox 225 (0.1-0.45%)were collected. Seven samples were used for calibrationdevelopment and two samples were used for validation.Ten replicates of each of the calibration samples werescanned giving 70 calibration spectra. For the validationdata, 12 replicates were scanned for the two validationsamples giving 24 individual spectra. Samples wereanalyzed using a NIRSystems Rapid Resin Il Analyzer.Since this instrument is not available anymore, the NIRSXDS RapidContent AnalyzerortheNIRSDS2500Analyzer is recommended. The samples were analyzedin reflectance mode from 1100-2500 nm. Samples weresimply pured into a hopper designed specifically forpolymer pellets. This configuration diminishes thevariations caused by nonhomogeneous sample packingand minimizes the within-sample variation. Results and discussion To identify bands that may be suitable for quantitativepurposes, the NIR spectra of Tinuvin 770, Irganox 225,and virgin polypropylene were compared (Figure 1). Thebaseline variations are due to differences in thescattering properties of the individual pure componentsand make isolation of unique spectral features difficult. To enhance spectral features and reduce baselineoffsets, the second derivative of the log(1/R) data wascalculated (Figure 2). Figure 2NIR Second-derivative Spectra In the second derivative spectra, log(1/R) maxima areinverted to peak minima. Bands that may be used for quantitative analysis ofTinuvin 770 (1560 nm) and Irganox 225 (1390 nm) areidentified in Figure 3. Figure 3 Expanded NIR Second-derivative Spectra Figure 4 shows representative spectra of polypropylenepellets containing various levels of Tinuvin 770 andIrganox 225. The corresponding second derivativespectra are shown in Figure 5. Figure 6 is an expandedview of the 1360 nm to 1600 nm region. Spectraldifferences can be seen at about 1540 nm deriving fromvariations in the Tinuvin 770 content. Figure 4NIR Spectra of The weakness of the Irganox 225 band, coupled with itslocationon the shoulderof thevery strongpolypropylene band centered at 1400 nm (Figure 3)obscures spectral differences associated with variationsin the Irganox 225 level. The variation is more easilyseen upon greater expansion. Amultiplelinear least-squares (MLR)Ccalibrationapproach is generally employed when unique spectralfeatures are readily identifiable for major constituents.Although the additive levels are rather low, uniquespectral features are readily identifiable. For Tinuvin 770,a two-term quotient model (1512 nm/1354 nm) yields amultiple correlation coefficient (R) of 0.998andstandard error of calibration (SEC) of 75 ppm. Figure 5NIR Second-derivative Spectra ofPolypropylene Pellet Samples Figure 6Expanded NIR Second-derivative Spectra ofPolypropylene Pellet Samples The Tinuvin (analyte) wavelength (1512 nm)corresponds to a zero-crossover for Irganox 225 andpolypropylene(((Figure 33).The denominator term,1354 nm, corrects for subtle differences in pathlengthdueto pellet shape and size. This wavelengthcorresponds to the positive side-lobe of polypropylene(Figure 3). Since the polypropylene content can beassumed to beconstant, the selection of thiswavelength for normalization of pathlength differencesis justified. The scatter plot of NIR calculated results vs.laboratory reported results is shown in Figure 7. Figure 7Scatter Plot of NIR vs laboratoryTinuvin 770 Levels For Irganox 225, the predominant source of error in theNIR assay is not due to effective pathlength differencesbut isduetothespectralinterferencefrompolypropylene (Figure 3). Therefore a two-term linearsummation equation (1412 nm + 1352 nm) was derivedthat provides an R of 0.998 and SEC of 150 ppm. 1412nm corresponds to the previously identified Irganox 225band (Figure 3) and 1352 nm is the same side-lobe ofthe strong polypropylene band previously discussed. Thescatter plot of NIR calculated results vs. laboratoryreported results is shown in Figure 8. Figure 8Scatter Plot of NIR vs laboratoryIrganox 225 Levels Conclusions This study demonstrates that NIR spectroscopy can beused to monitor low levels of additives in intactpolypropylene pellets. Multilinear regression modelswere developed to account for pathlength variationsand interferences in the polymerpellets.
关闭-
1/4
-
2/4
还剩2页未读,是否继续阅读?
继续免费阅读全文产品配置单
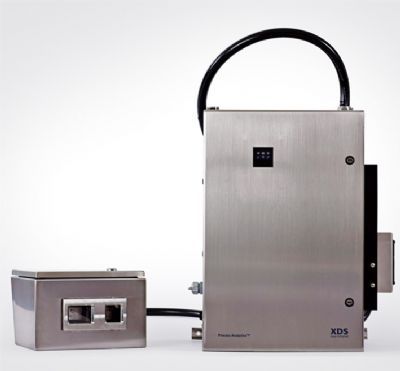
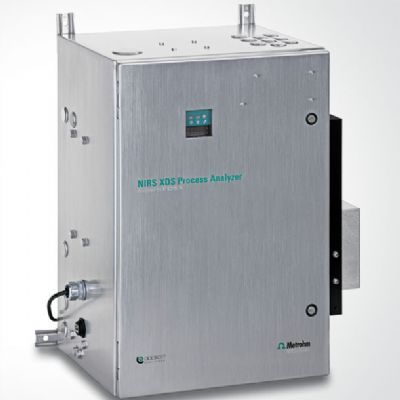
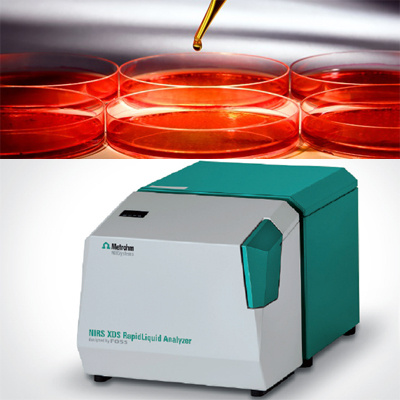
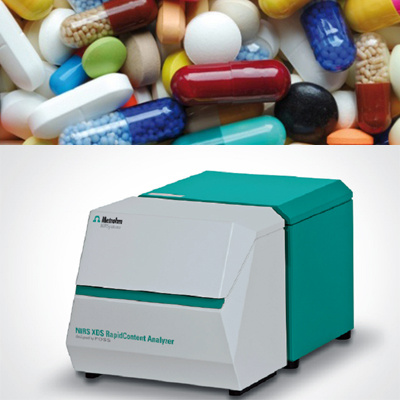
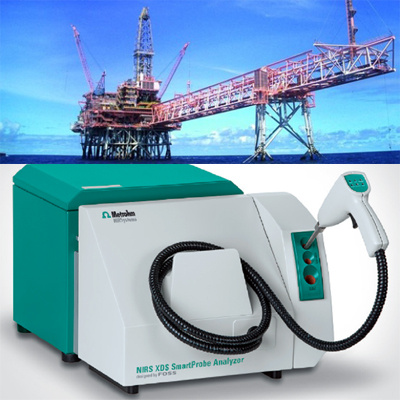
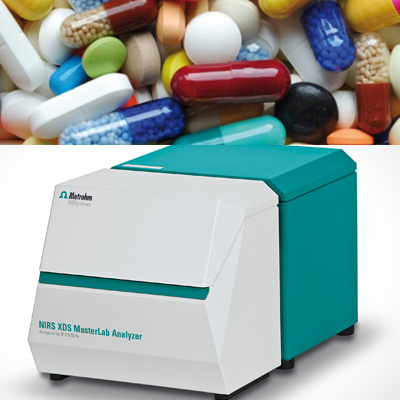
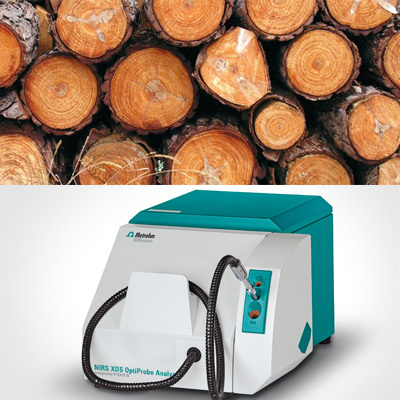
上海纳锘实业有限公司为您提供《采用近红外技术测定聚合物颗粒中添加剂含量》,该方案主要用于其他中null检测,参考标准《暂无》,《采用近红外技术测定聚合物颗粒中添加剂含量》用到的仪器有瑞士万通 XDS近红外在线分析仪 –微光纤束型、瑞士万通 XDS MultiVial 近红外光谱分析仪、瑞士万通 NIRS XDS TOPA 近红外光谱分析仪、瑞士万通 PRO 近红外在线分析仪、瑞士万通 DS 2500 近红外光谱分析仪、瑞士万通 XDS 近红外在线分析仪 ——直射光/非接触型、瑞士万通 XDS 近红外在线分析仪 -单光纤型、瑞士万通 XDS RLA 近红外光谱分析仪、XDS RCA 近红外光谱分析仪、瑞士万通 XDS SmartProbe 近红外光谱分析仪、瑞士万通 瑞士万通 XDS MasterLab 近红外光谱分析仪、瑞士万通 XDS IOPA 近红外光谱分析仪。
我要纠错
推荐专场
近红外光谱(NIR)
更多
相关方案
 咨询
咨询