方案详情文
智能文字提取功能测试中
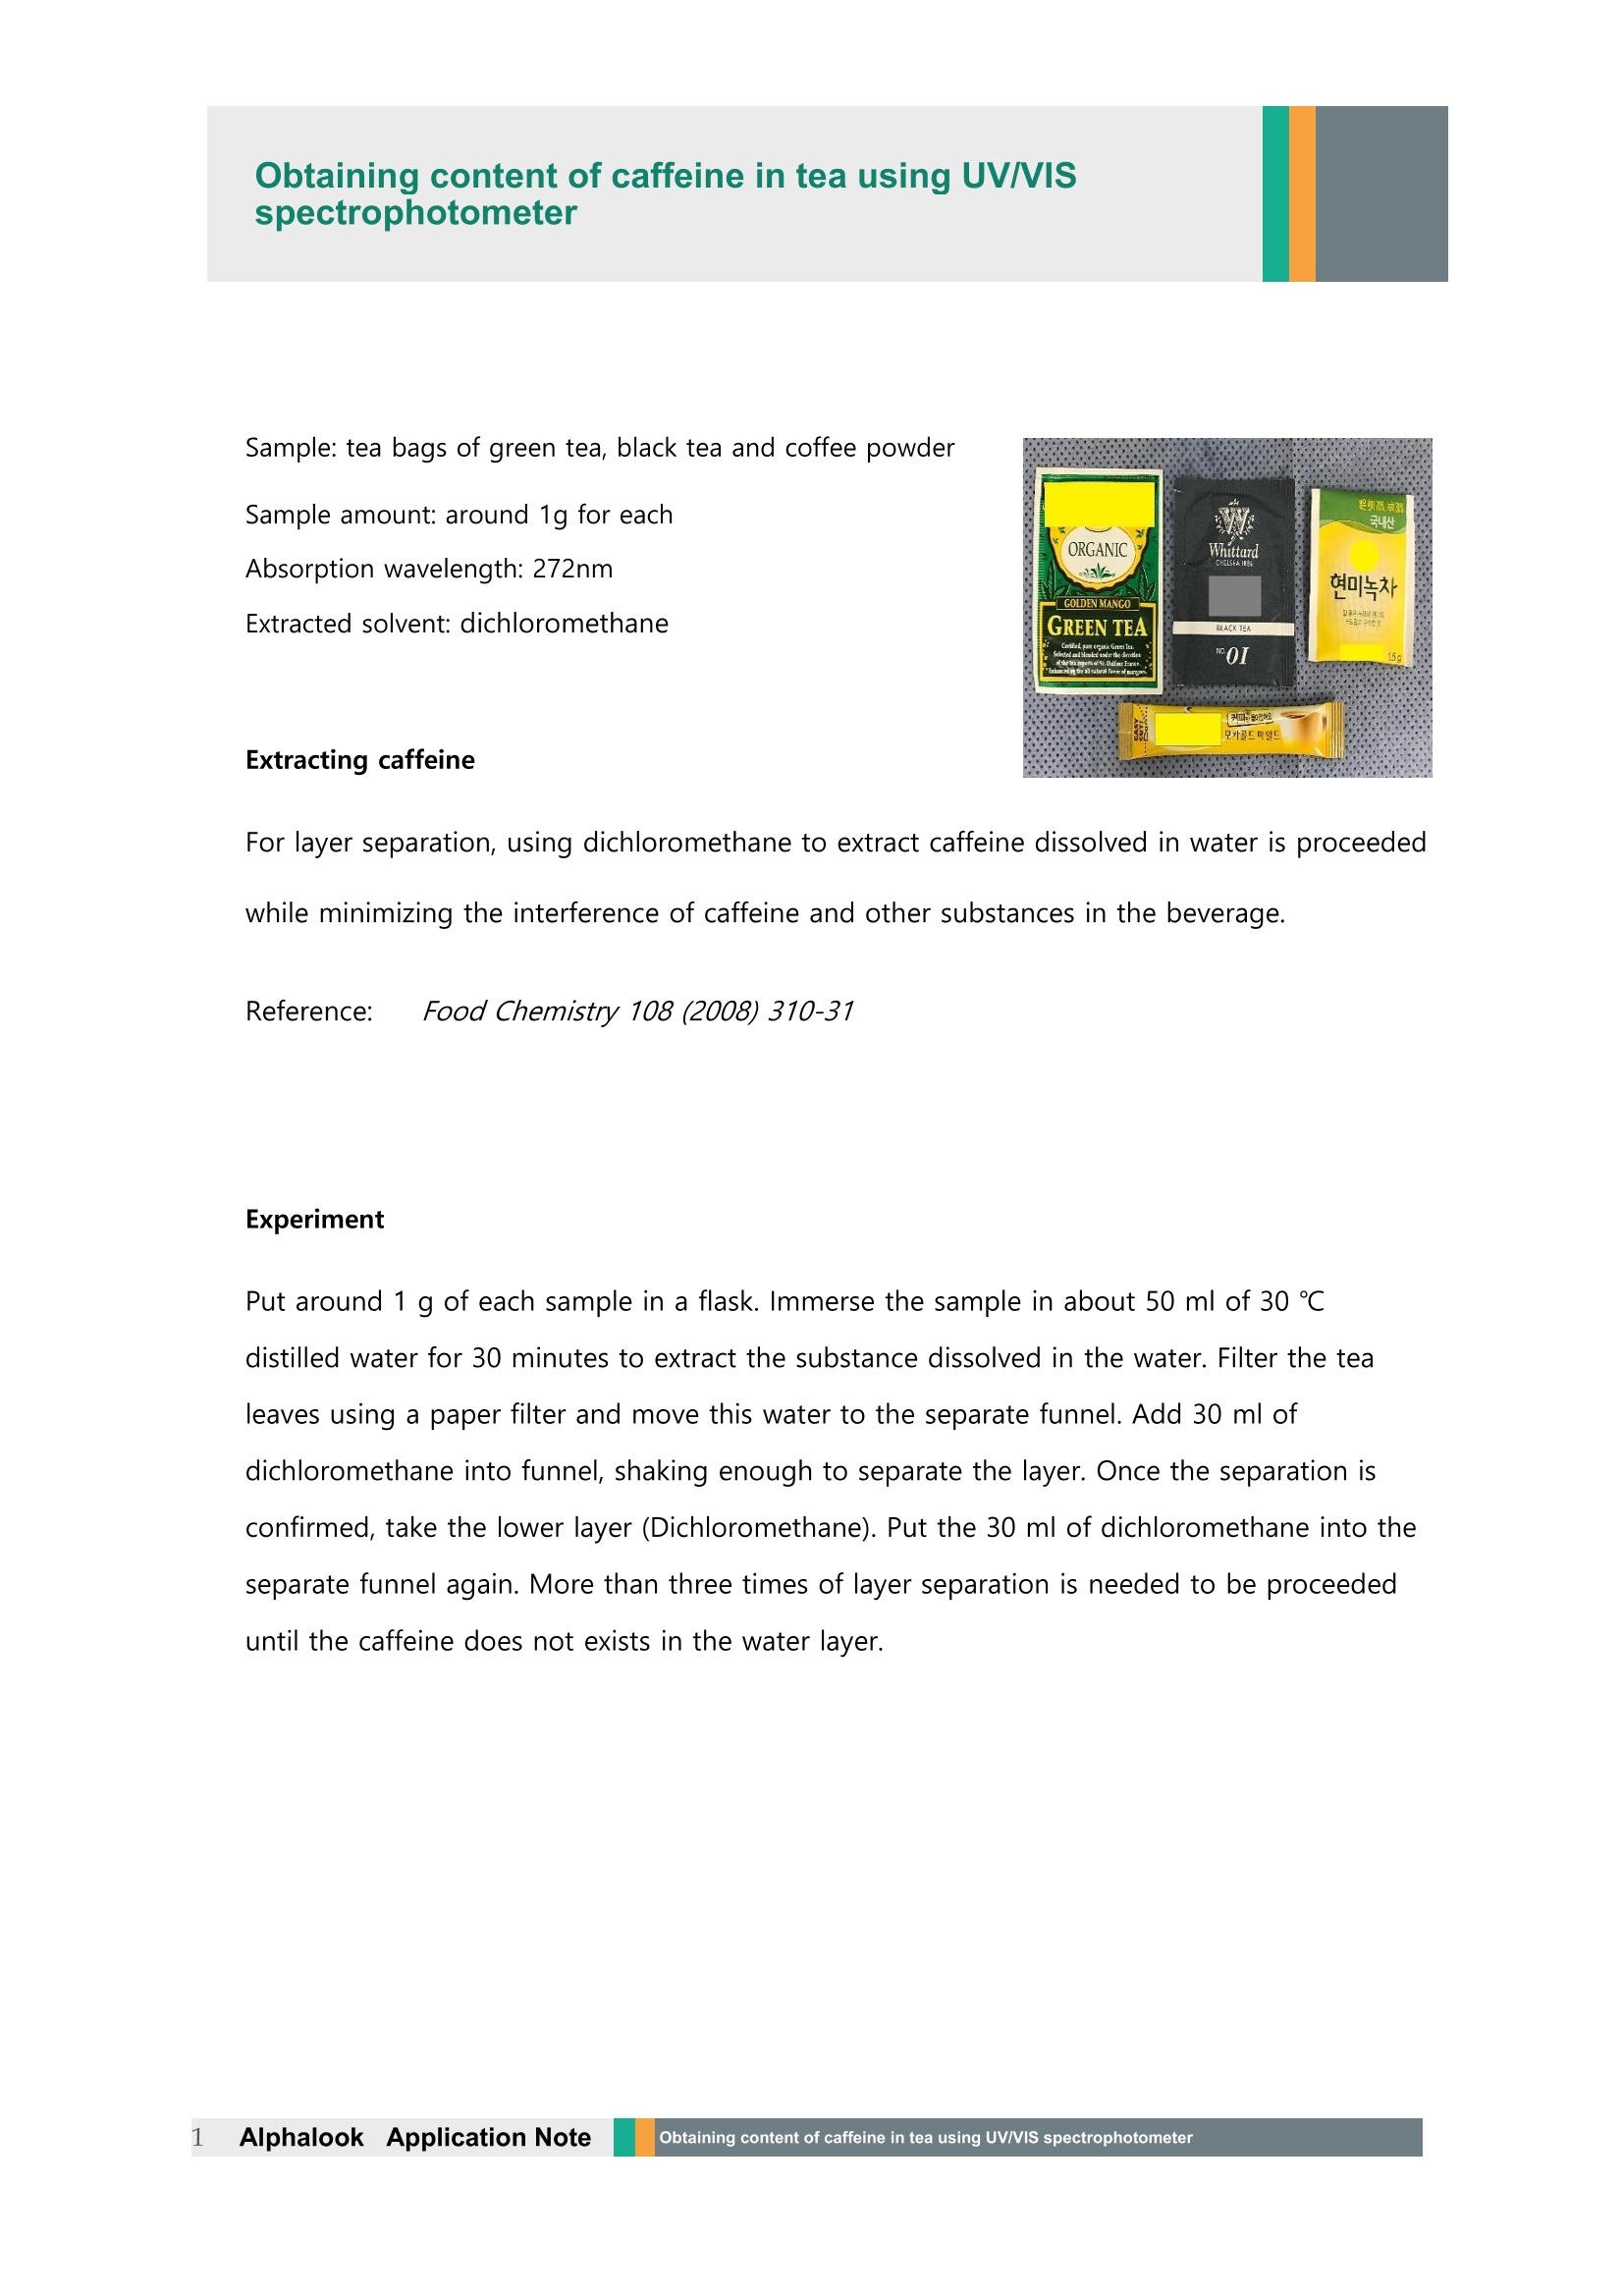
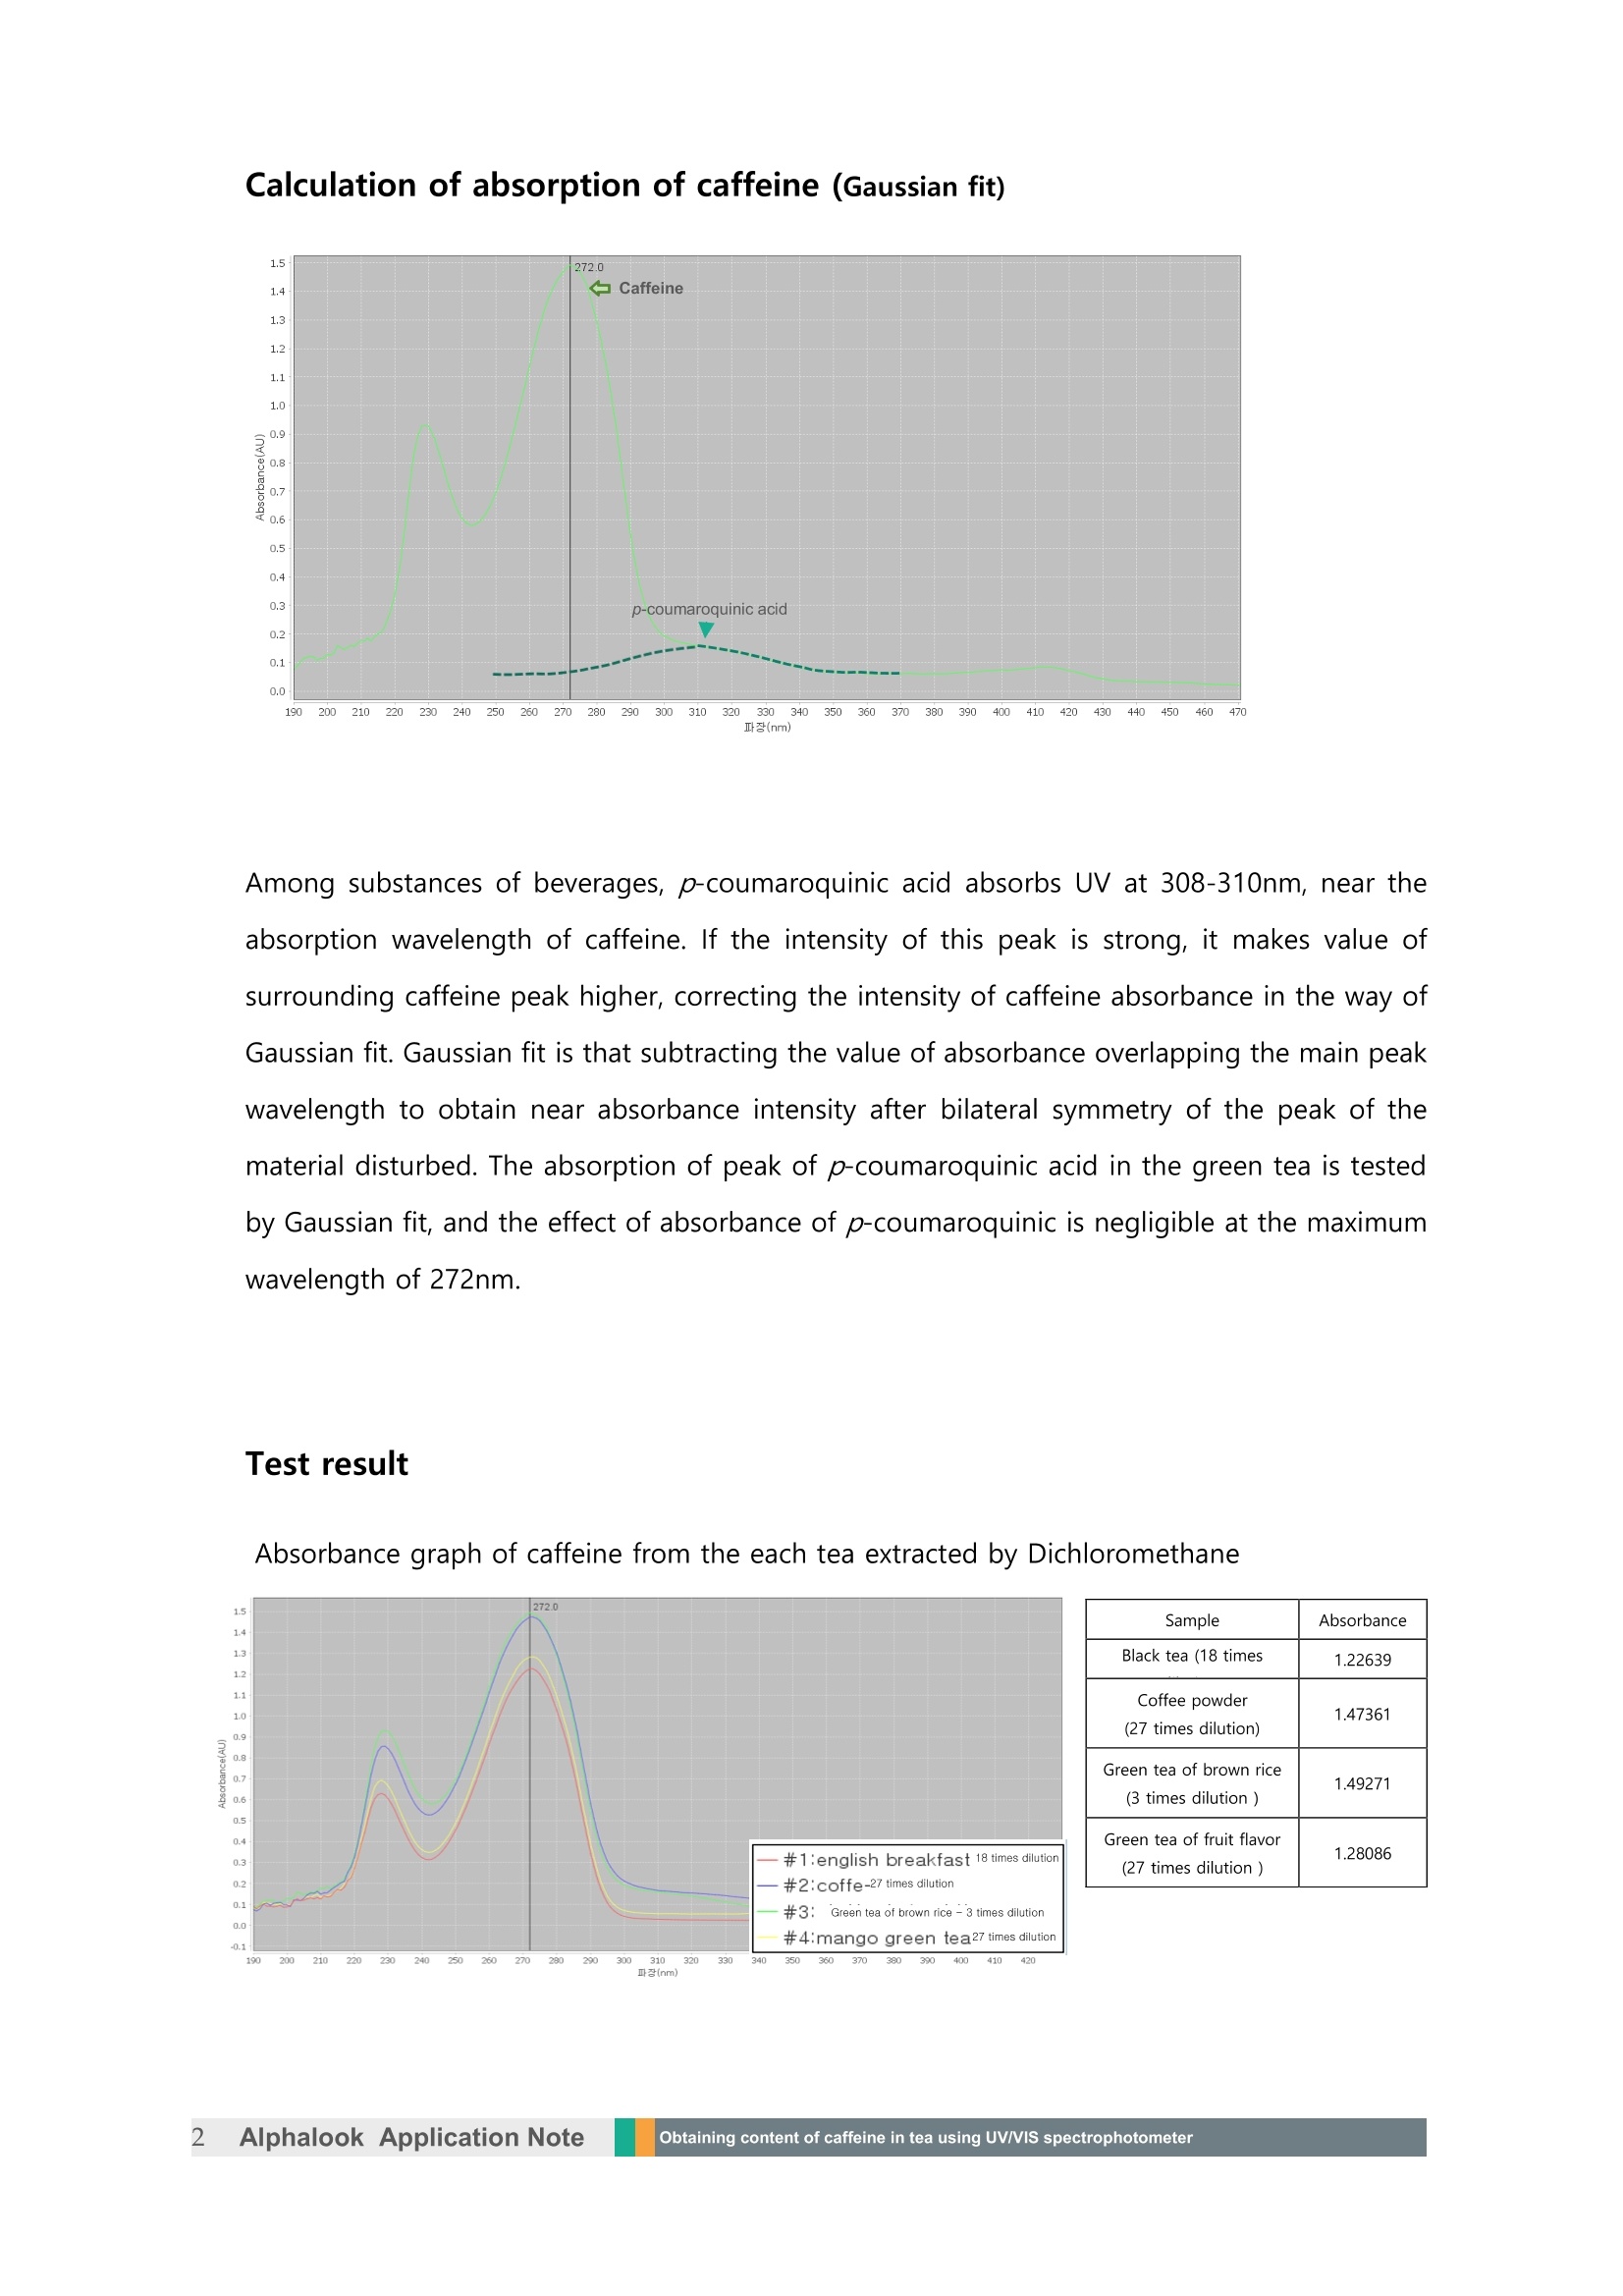
Obtaining content of caffeine in tea using UV/VISspectrophotometer Sample: tea bags of green tea, black tea and coffee powder Sample amount: around 1g for eachAbsorption wavelength: 272nm Extracted solvent: dichloromethane Extracting caffeine For layer separation, using dichloromethane to extract caffeine dissolved in water is proceededwhile minimizing the interference of caffeine and other substances in the beverage. Reference: Food Chemistry 108 (2008) 310-31 Experiment Put around 1 g of each sample in a flask. Immerse the sample in about 50 ml of 30 ℃distilled water for 30 minutes to extract the substance dissolved in the water. Filter the tealeaves using a paper filter and move this water to the separate funnel. Add 30 ml ofdichloromethane into funnel, shaking enough to separate the layer. Once the separation isconfirmed, take the lower layer (Dichloromethane). Put the 30 ml of dichloromethane into theseparate funnel again. More than three times of layer separation is needed to be proceededuntil the caffeine does not exists in the water layer. Calculation of absorption of caffeine (Gaussian fit) Among substances of beverages, p-coumaroquinic acid absorbs UV at 308-310nm, near theabsorption wavelength of caffeine. If the intensity of this peak is strong, it makes value ofsurrounding caffeine peak higher, correcting the intensity of caffeine absorbance in the way ofGaussian fit. Gaussian fit is that subtracting the value of absorbance overlapping the main peakwavelength to obtain near absorbance intensity after bilateral symmetry of the peak of thematerial disturbed. The absorption of peak of p-coumaroquinic acid in the green tea is testedby Gaussian fit, and the effect of absorbance of p-coumaroquinic is negligible at the maximumwavelength of 272nm. Test result Absorbance graph of caffeine from the each tea extracted by Dichloromethane )300310 (nm) Standard curve graph obtained by dissolving caffeine in dichloromethan The standard curve of absorbance for each concentration is as below. From the functional formula (absorbance (y)=11.792 * concentration(x) + 0.0086) showinglinearity of the above standard curve, the concentration of sample in the standard curve isobtained, and the original concentration is as well, based on the dilution content. Sample Absorbance(max=272nm) Concentration on standard curve(mol/L) Total content of caffeine in 100mL(mg) Black tea 1.22639 4.29x 10⁻⁵ about 62 Coffeepowder 1.47361 8.58x10⁻⁵ about 112 Green tea ofbrown rice 1.49271 1.287 x 10⁻⁴ about 12 Green tea ofmango 1.28086 2.146 x 10⁻⁴ about 97 *Calculation for total caffeine content refers to the original concentration based on the dilution content. Alphalookk Application NoteObtaining content of caffeine in tea using UV/VIS spectrophotometer Sample: tea bags of green tea, black tea and coffee powderSample amount: around 1g for eachAbsorption wavelength: 272nmExtracted solvent: dichloromethaneExtracting caffeineFor layer separation, using dichloromethane to extract caffeine dissolved in water is proceededwhile minimizing the interference of caffeine and other substances in the beverage.Reference: Food Chemistry 108 (2008) 310-31ExperimentPut around 1 g of each sample in a flask. Immerse the sample in about 50 ml of 30 ℃ distilled water for 30 minutes to extract the substance dissolved in the water. Filter the tealeaves using a paper filter and move this water to the separate funnel. Add 30 ml ofdichloromethane into funnel, shaking enough to separate the layer. Once the separation isconfirmed, take the lower layer (Dichloromethane). Put the 30 ml of dichloromethane into theseparate funnel again. More than three times of layer separation is needed to be proceededuntil the caffeine does not exists in the water layer.Calculation of absorption of caffeine (Gaussian fit)Among substances of beverages, p-coumaroquinic acid absorbs UV at 308-310nm, near theabsorption wavelength of caffeine. If the intensity of this peak is strong, it makes value ofsurrounding caffeine peak higher, correcting the intensity of caffeine absorbance in the way ofGaussian fit. Gaussian fit is that subtracting the value of absorbance overlapping the main peakwavelength to obtain near absorbance intensity after bilateral symmetry of the peak of thematerial disturbed. The absorption of peak of p-coumaroquinic acid in the green tea is testedby Gaussian fit, and the effect of absorbance of p-coumaroquinic is negligible at the maximumwavelength of 272nm.Test resultAbsorbance graph of caffeine from the each tea extracted by DichloromethaneStandard curve graph obtained by dissolving caffeine in dichloromethanThe standard curve of absorbance for each concentration is as below.From the functional formula (absorbance (y)=11.792 * concentration(x) + 0.0086) showinglinearity of the above standard curve, the concentration of sample in the standard curve isobtained, and the original concentration is as well, based on the dilution content.
关闭-
1/3

-
2/3

还剩1页未读,是否继续阅读?
继续免费阅读全文产品配置单
广州贝拓科学技术有限公司为您提供《茶中提取的咖啡因含量检测方案(紫外分光光度)》,该方案主要用于茶叶中食品添加剂检测,参考标准《暂无》,《茶中提取的咖啡因含量检测方案(紫外分光光度)》用到的仪器有null。
我要纠错
相关方案


 咨询
咨询


