

方案详情文
智能文字提取功能测试中
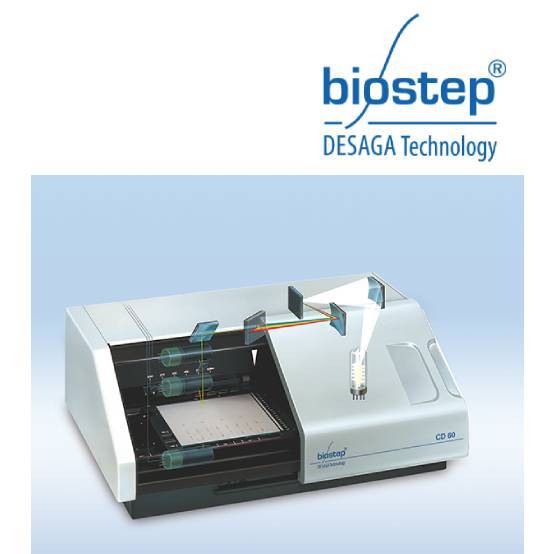
HPTLC-UV/FTIR of 11 Nor-A-tetrahydrocannabinol-9-carboxylic acid Determination of 11-Nor-A-Tetrahydrocannabinol-9-Carboxylic Acid in Urine by use of HPTLC-UV/FTIR On-Line Coupling Corinna Brandt and Karl-Artur Kovar* Key Words: HPTLCHPTLC-FTIR on-line couplingHPTLC-UV on-line couplingCannabinoidsUrineSPE11-Nor-4-tetrahydrocannabinol-9-carboxylic acid Summary A simple, rapid and reliable thin-iayer chromatographic methodhas been developed for the identification and quantitation of 11-nor-4’-tetrahydrocannabinol-9-carboxylic acid (THC-COOH) inurine. After alkaline hydrolysis of the ester glucuronide, samplepreparation was performed by an improved solid-phase extractiontechnique on an Isolute C8-(EC) column. The best results wereobtained by development on HPTLC silica gel 60 WRFzss layers(0.1 mm layer thickness) with dichloromethane-n-hexane-metha-nol, 7+2+ 1. Because the chromatograms were evaluated direct-ly by HPTLC-UV and HPTLC-FTIR on-line coupling, it was notnecessary to derivatize with fast blue salts or other health-endan-gering azo dyestuffs. The validated detection limits for THC-COOH (UV: 4 ng mL-, IR: 14 ng mL) enabled qualitative andquantitative evaluation in the region of the 20 ng mL"’cutoff. 1IIIntroduction Marihuana and hashish are frequently used drugs in Europe;their psychotropic effects are primarily caused by thecannabinoid A-tetrahydrocannabinol (THC) (Figure 1; 1). Forensic detection of cannabis consumption is performedby identification of the major metabolite of THC, 11-nor-A-tetrahydrocannabinol-9-carboxylic acid (THC-COOH)(Figure 1;2), in urine [1,2]. Screening is usually performedfirst by immunoassay [3-5]. To minimize the number of falsepositive results evaluation is performed using cutoff con-centrations. An analytical result is then only interpreted as ( C. B randt a nd K . -A. Kovar, Pharmazeutisches Institut d er Un i versitatTubingen, Auf der Morgenstelle 8, 72076 Tubingen, FRG. ) being positive when the THC concentration measured isgreater than an arbitrarily chosen cutoff (20, 50 or 100 ngmL-THC-COOH). A positive result must then be con-firmed by a second, selective method of analysis. At presentthe method of choice is GC-MS coupling [6-8], but thisinvolves the use of expensive apparatus. HPLC [9-12] andthin-layer chromatography [13-16] are also used as chro- 2 The structures of A-tetrahydrocannabinol (THC; 1) and 11-nor-d"-tetrahydro-cannabinol-9-carboxylic acid (THC-COOH; 2). matographic confirmation methods; the latter is a rapid,simple and economical alternative to GC-MS. The thin-layer chromatographic methods described in the literaturefor the detection of THC-COOH involve, without excep-tion, derivatization with various colour reagents to obtainadequate selectivity and low detection limits. The most fre-quently used reagents are still fast blue salt derivatives (e.g.fast blue salt BB) [13-16];the use of these potentially car-cinogenic azo dyestuffs constitutes a health risk. The con-version of cannabinoids to fluorescent dansyl derivatives isless widespread [17]. The aim of this investigation was to develop a thin-layerchromatographic method that avoided time-consuming orhealth-endangering derivatization and enabled direct den-sitometric evaluation in the UV region. For this purpose itwas essential to optimize sample preparation, because theliquid-liquid [1,14,18-19] and solid-phase [6,9-10,12-13,20]extraction methods so far described for THC-COOH yield-ed highly impure extracts that did not enable direct evalua-tion of the chromatogram. A combination of HPTLC-UV coupling and HPTLC-FTIR on-line coupling was selected to provide adequatelyreliable substance identification. In addition to Re value andUV spectrum the IR spectrum of the metabolite providesimportant, additional information making possible finalunequivocal identification of the substance. 2 Experimental 2.1 Reagents and Materials With the exception of methanol and n-hexane all solventsand mobile phases used were p.A. quality and wereobtained from Merck (Darmstadt, Germany). LiChrosolvmethanol and Uvasol n-hexane (Merck) had to be used forreasons of quality. THC-COOH was obtained as a standardmethanolic solution (c=50 pg mL-) from Sigma (Deisen-hofen, Germany). Thick-walled test tubes with Teflonscrew-caps from Schott (Wertheim, Germany) were usedfor the hydrolysis. The glass apparatus was generally notsilanized. Solid-phase extraction was performed on a VAC-Elut vacuum work-station with Isolute C8-(EC) columns(500 mg) 10 mL from ICT (Bad Homburg, Germany). Allthin-layer chromatography was performed on Merck silicagel 60 Fzsa HPTLC plates (0.2 mm layer thickness) or silicagel 60 WRF254s HPTLC plates with 0.2 mm or 0.1 mm layers(extra thin layers). 2.2 Sample Preparation Because most of the THC-COOH is excreted as ester-linked glucuronide, a basic hydrolysis step must be per-formed to obtain the total amount of the free acid [1,3,12].Spiked urine (10mL) was hydrolyzed by addition of potas-sium hydroxide solution (10 M; 300 p.L) and heating to 60℃ in a water bath for 15 min. After cooling to room tempera-ture glacial acetic acid (1400 pL) was added to adjust thepH to 3-4. The pH of the THC-COOH sample solution canvary over a wide range (pH 1-6) during solid-phase extrac-tion on reversed phases without having a negative influenceon the extraction [10,15,20]. 2.3 Solid-Phase Extraction The Isolute C8-EC columns were conditioned successivelywith 5 mL water and 5 mL 1 M acetic acid. The sample wasthen applied to the column under slight vacuum. The col-umn was washed with 15 mL acetonitrile-water, 4:6, andthen dried under full vacuum for 10 min. A second washingstep was then performed with 5 mL dichloromethane-n-hexane, 6:4, again followed by 5 min drying at full vacuum.The sample was then eluted under low vacuum with 3 mLdiethyl ether-n-hexane,2:8. The eluate was concentrated todryness at 35℃ in a flow of nitrogen and the residue dissolved 45 pL dichloromethane-methanol, 3:1. This solventis particularly suitable for elution of cannabinoids fromglass surfaces [14]. 2.4 Chromatography 2.4.1 Precleaning Before chromatography the HPTLC plates were precleanedby developing with LiChrosolv methanoi. 2.4.2 Sample Application Sample application was performed with a Linomat IV fromCamag (Muttenz, Switzerland). The complete worked-upsample solutions were applied to the HPTLC plate as bands2 mm wide. 2.4.3 Development of HPTLC silica gel 60 F254 layers Development, in a normal chamber with chamber satura-tion, was performed to a separation distance of 5 cm usingdichloromethane-n-hexane-methanol, 7+ 1 +2. The Rp ofTHC-COOH under these conditions was 0.62-0.74. 2.4.4 Development of HPTLC silica gel 60 WRF254S layers Development, also in a normal chamber with chamber sat-uration and to a separation distance of 5 cm, was performedusing dichioromethane-r-hexane-methanol, 7 +2 +1. TheRe value of THC-COOH under these conditions was0.50-0.58 for both layer thicknesses. 2.5 HPTLC-UV On-Line Coupling Measurements were performed at 入= 210 nm with a CD 60densitometer (Desaga, Heidelberg, Germany). Spectrawere recorded over the range 入= 200-339 nm and identi-fied using a spectral library compiled by us (software:Spectra Calc from Galactic Industries, Salem, USA). 2.6 HPTLC-FTIR On-Line Coupling A Bruker (Karlsruhe, Germany) IFS 48 spectrometer with anitrogen-cooled MCT (mercury-cadmium telluride), nar-row-band detector was used in combination with a DRIFT(diffuse reflectance infrared Fourier transform) unit and aGlobar as radiation source. The measurement table wascontrolled by an external AT 286 computer with MCL step-control software.Data analysis was performed on an AT 486computer with OPUS software from Bruker. To record the chromatograms a Gram-Schmidt trace and aparallel window chromatogram at 2940-2930 cm weremeasured. Because of the more intense signals the latter isindispensable for measurement of trace substances. A post-chromatographic IR spectrum was then extracted at peakmaximum and identified from our own spectral library.More detailed information about measurement parametershas been published elsewhere [21,22]. 2.7 Validation To enable comparison of the methods each thin-layer chro-matographic method was validated separately. A workingrange of 14.4-43.2 ng mL"THC-COOH was defined andthe calibration was performed with seven completelyworked-up blank urine samples (10 mL) previously spikedwith 3-9 pL of the standard THC-COOH solution (48.0 pgmL"’in methano!). Quantitation was based on peak heightsmeasured densitometrically at 入=210 nm after automaticzone optimization. The calibration curves were tested forlinearity and variance homogeneity by the method of Funket al. [23]. Variance homogeneity was determined by mea-surement of ten worked-up urine samples at both the topand bottom of the working range. The ratio of the varianceswas then subjected to an F-test. The coefficient of variationof the ten measured values at the concentration 14.4 ngmLis also a measure of the precision of the calibration.The accuracy was determined by including five additionalmeasurements from each of the working range limits (14.4and 43.2 ng mL) and from the middle of the working range(28.8 ng mL). A calibration function was then used to cal-culate analysis values and their deviation from the knownamounts added. The precision and accuracy were given forthe lower working range (14.4 ng mLTHC-COOH)[23,24] for which, according to Shah et al. [24], acceptablevalues for determinations from biological matrices shouldbe <20%. The accuracy was also determined over the wholeworking range; here the values should not exceed 15% [24].The validated detection limits were determined accordingto Ebel [25]. 3 Results and Discussion Solid-phase extraction was optimized by use of a C8-(EC)column, introduction of an additional washing step withdichloromethane-r-hexane to remove interfering lipophiliccompounds, and elution with a seiective solvent mixture,ether-n-hexane,2:8. The recovery rate was 85.1%. The elu- ates obtained were almost free from interfering urine com-ponents and could be analysed densitometrically on con-ventional HPTLC plates without problems (Figure 2).There were, however, difficulties jinn evaluating theGram-Schmidt and window chromatograms. Separation Figure 2 HPTLC-UV chromatogram of 28.8 ng mLTHC-COOH (-) and blank urine (…)on silica gel 60 Fzs4. from other IR-active urine components was incomplete(Figure 3). The THC-COOH signal was of low intensity,which made spectral extraction more difficult. To ease chro-matogram analysis by FTIR, HPTLC silica gel 60 WRFF256S layers were employed. These layers, originally devel-oped for chromatography with aqueous mobile phases, arewater-wettable and water resistant and contain an acid-sta-ble fluorescence indicator. Apart from slight overlap of theTHC-COOH peak with urine components, the UV chro-matograms on these plates were almost identical with thoseon conventional silica gel layers. In contrast, appreciabledifferences were found between the FTIR chromatograms: Figure 3 Gram-Schmldt chromatogram of 62.4 ng mL-THC-COOH (-) and biank urine() on silica gel 60 Fzs. a.. Validated detection limits for THC-COOH in spiked urine samples (10 mL). Layer material HPTLC--UV Absolute [ng] Concentration HPTLC-FTIR Absolute [ng] Concentration in urine [ng mL-] in urine [ng mL-] Silica gel 60 F2s: 144 14.4 624 62.4 Silica gel 60 WRFs 48 4.8 336 33.6 Silica gel 60 WRFsas, 0.1 mm 36 3.6 144 14.4 the THC-COOH peaks were well separated from the urinecomponents and the signal intensity was greater (Figure 4).The improved identification of the UV spectra and, in par-ticular, of the FTIR spectra is an advantage when using sil.ica gel 60 WRFzsas layers-on the normal HPTLC silica gel Flgure 4 Gram-Schmld! chromatogram of 24.0 ng mL**THC-COOH (-) and blank urine(…)on sllica gel 60 WRF2548(0.1mm). plates the extracted FTIR spectra are characterized by aweak carbonyl band at 1702 cm- (Figure 5). Because thespectra are difficult to identify, the validated detection limitof 62.4 ng mL"is relatively high (Table 1). The FTIR spec- Figure 5HPTLC-FTIR spectrum of THC-COOH (-) on silica gel 60 F. tra from the silica gel 60 WRFzsas layers, in contrast, have anintense characteristic signal at 1697 cm for the C=0stretching vibration and they show more clearly the charac-teristic signals of the acid and phenolic structure of THC.COOH (Figure 6). This type of plate contains a polyacrylicacid instead of a polyacrylate salt as binder; evidentlydeprotonation of the carboxylate group is inhibited on theTLC plate. The 0.1 mm layers yielded the best overallresults, because the low layer thickness enabled increasedreflectance of the UV and, above all, of the IR radiationand appreciably increased signal intensity. In this manner it Figure 6 HPTLC-FTIR spectrum of THC-COOH (-) on silica gel60 WRF5. was possible to reduce the validated detection limits forboth HPTLC-FTIR (14.4 ng mL)and HPTLC-UV evalu-ation (3.6 ng mL-) by 75% (Table 1). The use of extra-thin HPTLC silica gel 60 WRFzsas layersthus enables reliable identification of THC-COOH in therange of the 20 ng mL-cutoff. All the thin-layer chromatographic methods presented can,in principle, be used for quantitation of THC-COOH inurine samples. It is necessary to choose a very narrow work-ing range (14.4-43.2 ng mL) to obtain a reproducible lin-ear slope for the calibration curve. The residual standarddeviation, s,, the correlation coefficient,r, and the methodstandard deviation Vxo have been determined (Table 2). Thevariations were homogeneous in each case. Determinationson water- resistant plates are somewhat more precise thanthose performed on silica gel 60 WRFzsas layers but the dif-ferences between the standard deviations are not significant Calibration data and validation of the methods for HPTLC determination of THC-COOH (working range 14.4-43.2 ng mL"’in each case). Parameter Silica gel 60 F254 Silica ge! 60 WRF2s4s Silica gel 60 WRFss 0.2 mm 0.2 mm 0.1 mm Calibration function y=0.9913x + 238.74 y=1.0217x+160.64 y=1.4136x +101.50 Sy 23.997 17.695 22.481 0.9780 0.9886 0.9903 Vxo [%] 8.4 6.0 5.5 Precision [%] 11.63 8.47 9.17 Accuracy at 14.4 ng mL[%] +12.25 -11.13 -11.52 over whole range [%] +4.36 -0.60 -1.91 (Table 2). When account is also taken of the lower detectionlimits the extra thin HPTLC silica gel 60 WRFz5as layer (0.1mm) is the plate material of choice. All the necessary crite-ria of method validation are fulfilled so that the lower work-ing limit of 14.4 ng mL-THC-COOH is also the determi-nation limit [23-25]. 4 Conclusion Optimization of the solid-phase extraction and the use ofHPTLC silica gel 60 WRF254s layers with a layer thickness of0.1 mm have made it possible for the first time to develop asimple, rapid and reliable method for the identification andquantitation of THC-COOH in urine, that does not requirea derivatization reaction. In particular, the use of health-damaging azo dyestuffs is avoided. The necessary reliabilityin substance identification is obtained by comparison of Revalues, HPTLC-UV and, in particular, of HPTLC-FTIRspectra. Sufficiently low, validated detection limits enablequalitative and quantitative analysis in the range of the 20ng mL-cutoff. ( References ) ( [1] PL. Williams and A.C. Moffat, J.Pharm. Pharmacol. 32(1980)445-448. ) ( [2] D.J. Harvey and W.D. P aton, Rev. Biochem. Toxicol. 6 (1984) 221-264. ) ( [3] M.A. ElSohly and H.N. ElSohly, in: K.K . Redda, C.A. W alker,and G . Barnelt ( Eds), Cocaine, M arijuana, D esigner D r ugs:Chemistry, Pharmacology and Behavior, CRC P ress, BocaRaton, Florida, 1989, 145-161. ) ( [4] M.J. DeLaurentis, K . M cNeil,A.J. Mann, and S. Cl a rk, in : R.L.Hawks ( E d.), The A n alysis o f C a nnabinoids in Bi o logicalFluids, Research Monograph N o . 4 2 , N a tional I n stitute o nDrug Abuse, 1982,69-83. ) ( [5] C.E. C ook, H.H. S e ltzman, VH. Sc h indler, C.R. Ta l lent, K.M.Chin , a nd C . G. P i tt, i n: R .L. H awks (Ed.), The Analysis of Cannabinoids in Biologica! Fluids, Research Monograph No. 42, National I nstitute on D rug Abuse, 1982, 19 - 32. ) ( [6] V . Dixit and LM. Dixit, J. Chromatogr. 567 (1991) 8 1-91. ) ( [7] R.L. F o ltz and I. Sunshine,J. Anal. Toxicol. 14 (1990) 375-378. ) ( .[8] W.E. Bronner and A.S. Xu, J. Chromatogr. Biomed. Appl(1992)63-75. ) ( [9] M.A. ElSohly, H .N. ElSohly,A . B. Jones, PA. D i mson, andWells, J . Anal. Toxicol. 7 (1983) 262-264. ) ( [10]Di. B ourquin and R . Brenneisen, Anal. Chim. A c ta. 1 9 8 (1183-189. ) ( [ 1 1] D .S. I senschmid a n d Y. H . Caplan, J. Anal. To x icol. 10 () 170-174. ) ( [12] S .D. F errara, L. Tedeschi, G. Frison, and F C ustagna, J.Toxicol. 16 (1992) 217-222. ) ( [13] W. Hansel and R. Strommer, GIT Fachz. L ab. 1988, 156-166. ) ( [14] R.C. Meatherall a n d J.C. G a rriott, J. A nal. T oxicol. 1 2 ( 136-140. ) ( [15] M.J. Kogan, E. Newman, a nd N .J. Willson, J . ChromBiomed. Appl.306 (1984) 4 4 1-443. ) ( [16] C .A. Sutheimer R . Y a rborough, B.R. Hepler, and I. SunshAnal. Toxicol. 9 (1985) 156-160. ) ( [17] G.Alemany, A. Gamundi, M.C. Nicolau, and D. Saro, BiChromatogr. 7 (1993) 273-274. ) ( [18] P. Lillsunde and T. Korte, J. Anal. Toxicol. 1 5 (1991) 71 - ) ( [19] M.A. ElSohly, E.S. Arafat, and A.B. Jones, J. A nal. Tox(1984) 7-9. ) ( {20] G.R. N akamura, R.D. Meeks,and W.J. Stall, J. Forensic (1990) 792-796. ) ( [21] A.M. P f eifer and K.-A. K o var, J. P l anar. Chromatogr. 8388-392. ) ( [22] S.C. Wolff and K .-A. Kovar, J. Planar. Chromatogr. 7344-348. ) ( [23] W. Funk, V. Damann, C . V onderheid, and G .O e hlmu StatistischeMethodenin d er W a sseranalytik,Weinheim, 1 985. ) ( [24] K P. Shah, K.K. M idha, S. Dighe et al., J. AOAC. Int. 7 5 19A-26A. ) ( [25] S. Ebel, i n: Wiirzburger S k ripten zu r Analytik, Ins t iPharmazie und Lebensmittelchemie Bayerische Julius m ilians Universitat ( E ds), 4th e d ition, W u rzburg, 199 . ) ( MS received : May Accepted by SN: June ) Flgure ournal of Planar ChromatographyVOL. SEPTEMER/OCTOBER ournal of Planar ChromatographyVOL. SEPTEMBER/OCTOBER 简介本文描述了一种简单、快速、可靠的薄层色谱技术,用以检测尿液中羧酸四氢大麻酚(THC-COOH)。酰基葡萄糖酸酐经碱裂解后,用一项已证实的固相萃取技术,通过Isolute C8-(EC)柱进行样品预处理。用二氯甲烷-正己烷-甲醇(7+2+1)对60层WRF254s(0.1mm层厚)HPTLC硅胶板展开能获得最佳结果。该色谱的评估是通过HPTLC-UV和HPTLC-FTIR直接在线耦合,因此无需固蓝盐衍生或其他危害健康的偶氮染料。经证实羧酸四氢大麻酚的定性和定量检测限(UV:4 ng mL-1,IR:14 ng mL-1)可达20ng mL-1。
关闭-
1/5
-
2/5
还剩3页未读,是否继续阅读?
继续免费阅读全文产品配置单
大昌华嘉科学仪器为您提供《尿液中羧酸四氢大麻酚检测方案(薄层色谱仪)》,该方案主要用于尿液中生化检验检测,参考标准《暂无》,《尿液中羧酸四氢大麻酚检测方案(薄层色谱仪)》用到的仪器有薄层色谱仪(自动点样仪)、薄层色谱扫描仪(薄层色谱成像)。
我要纠错
推荐专场
相关方案
 咨询
咨询