
方案详情文
智能文字提取功能测试中
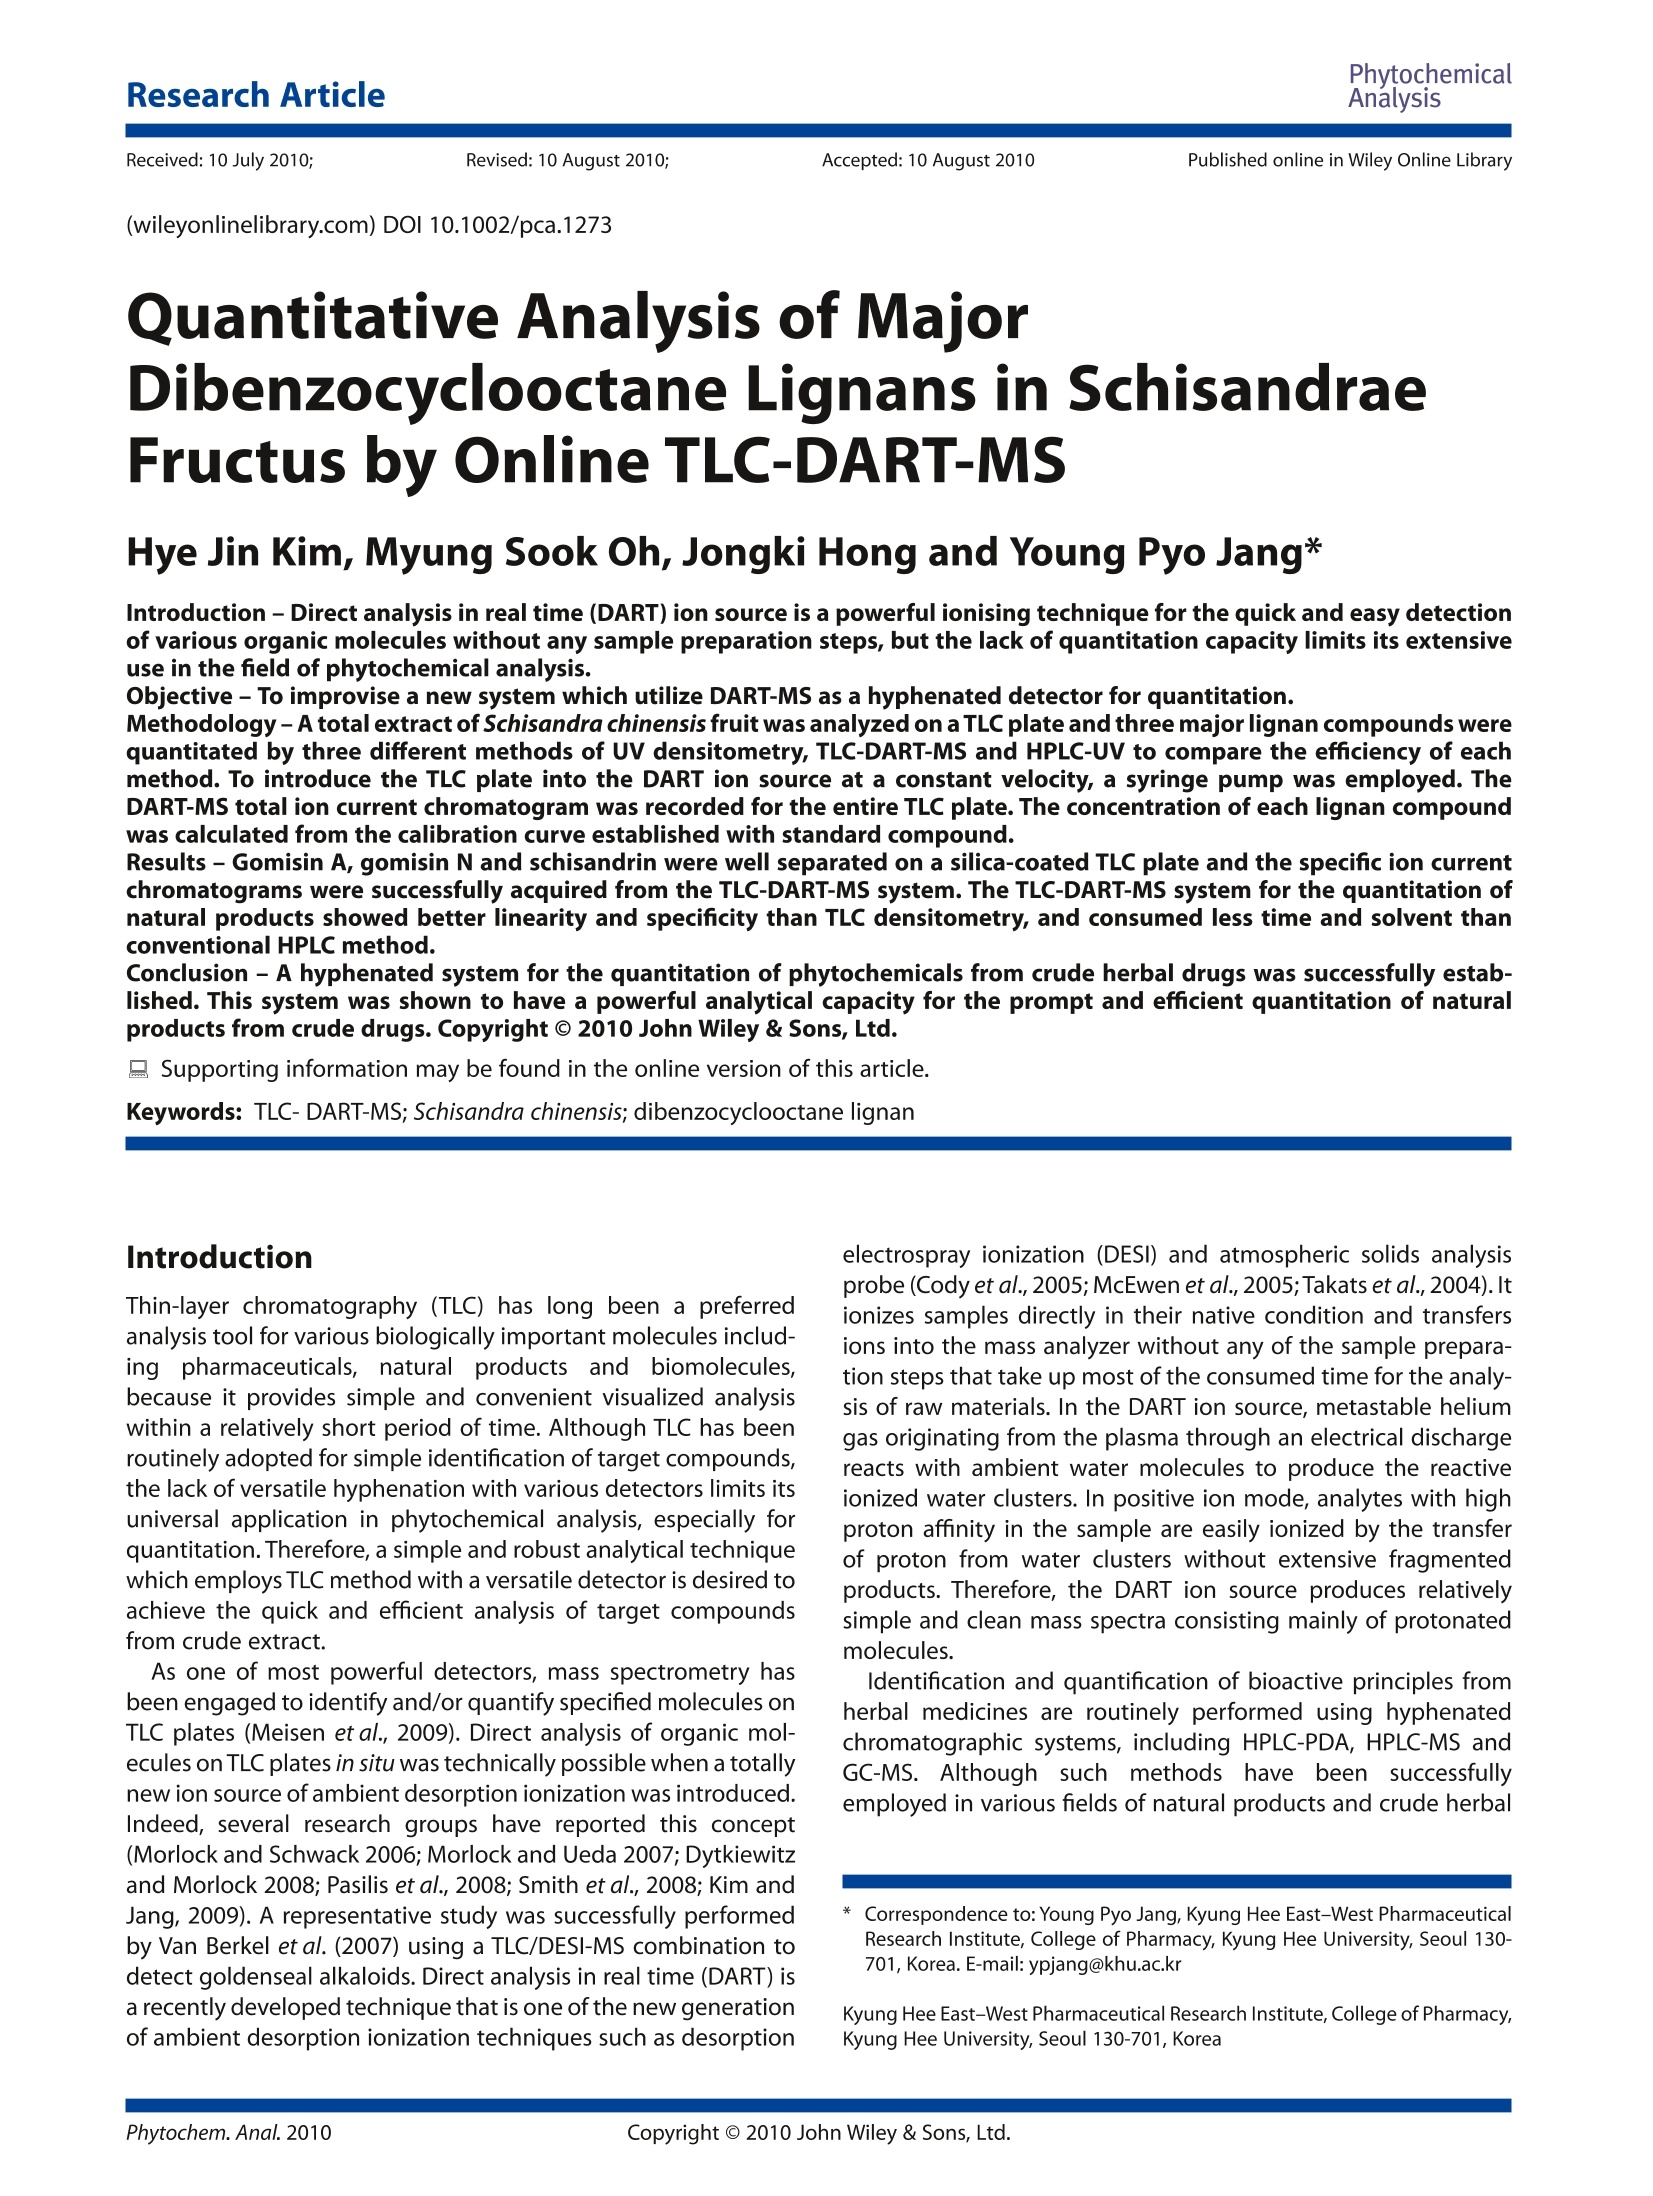
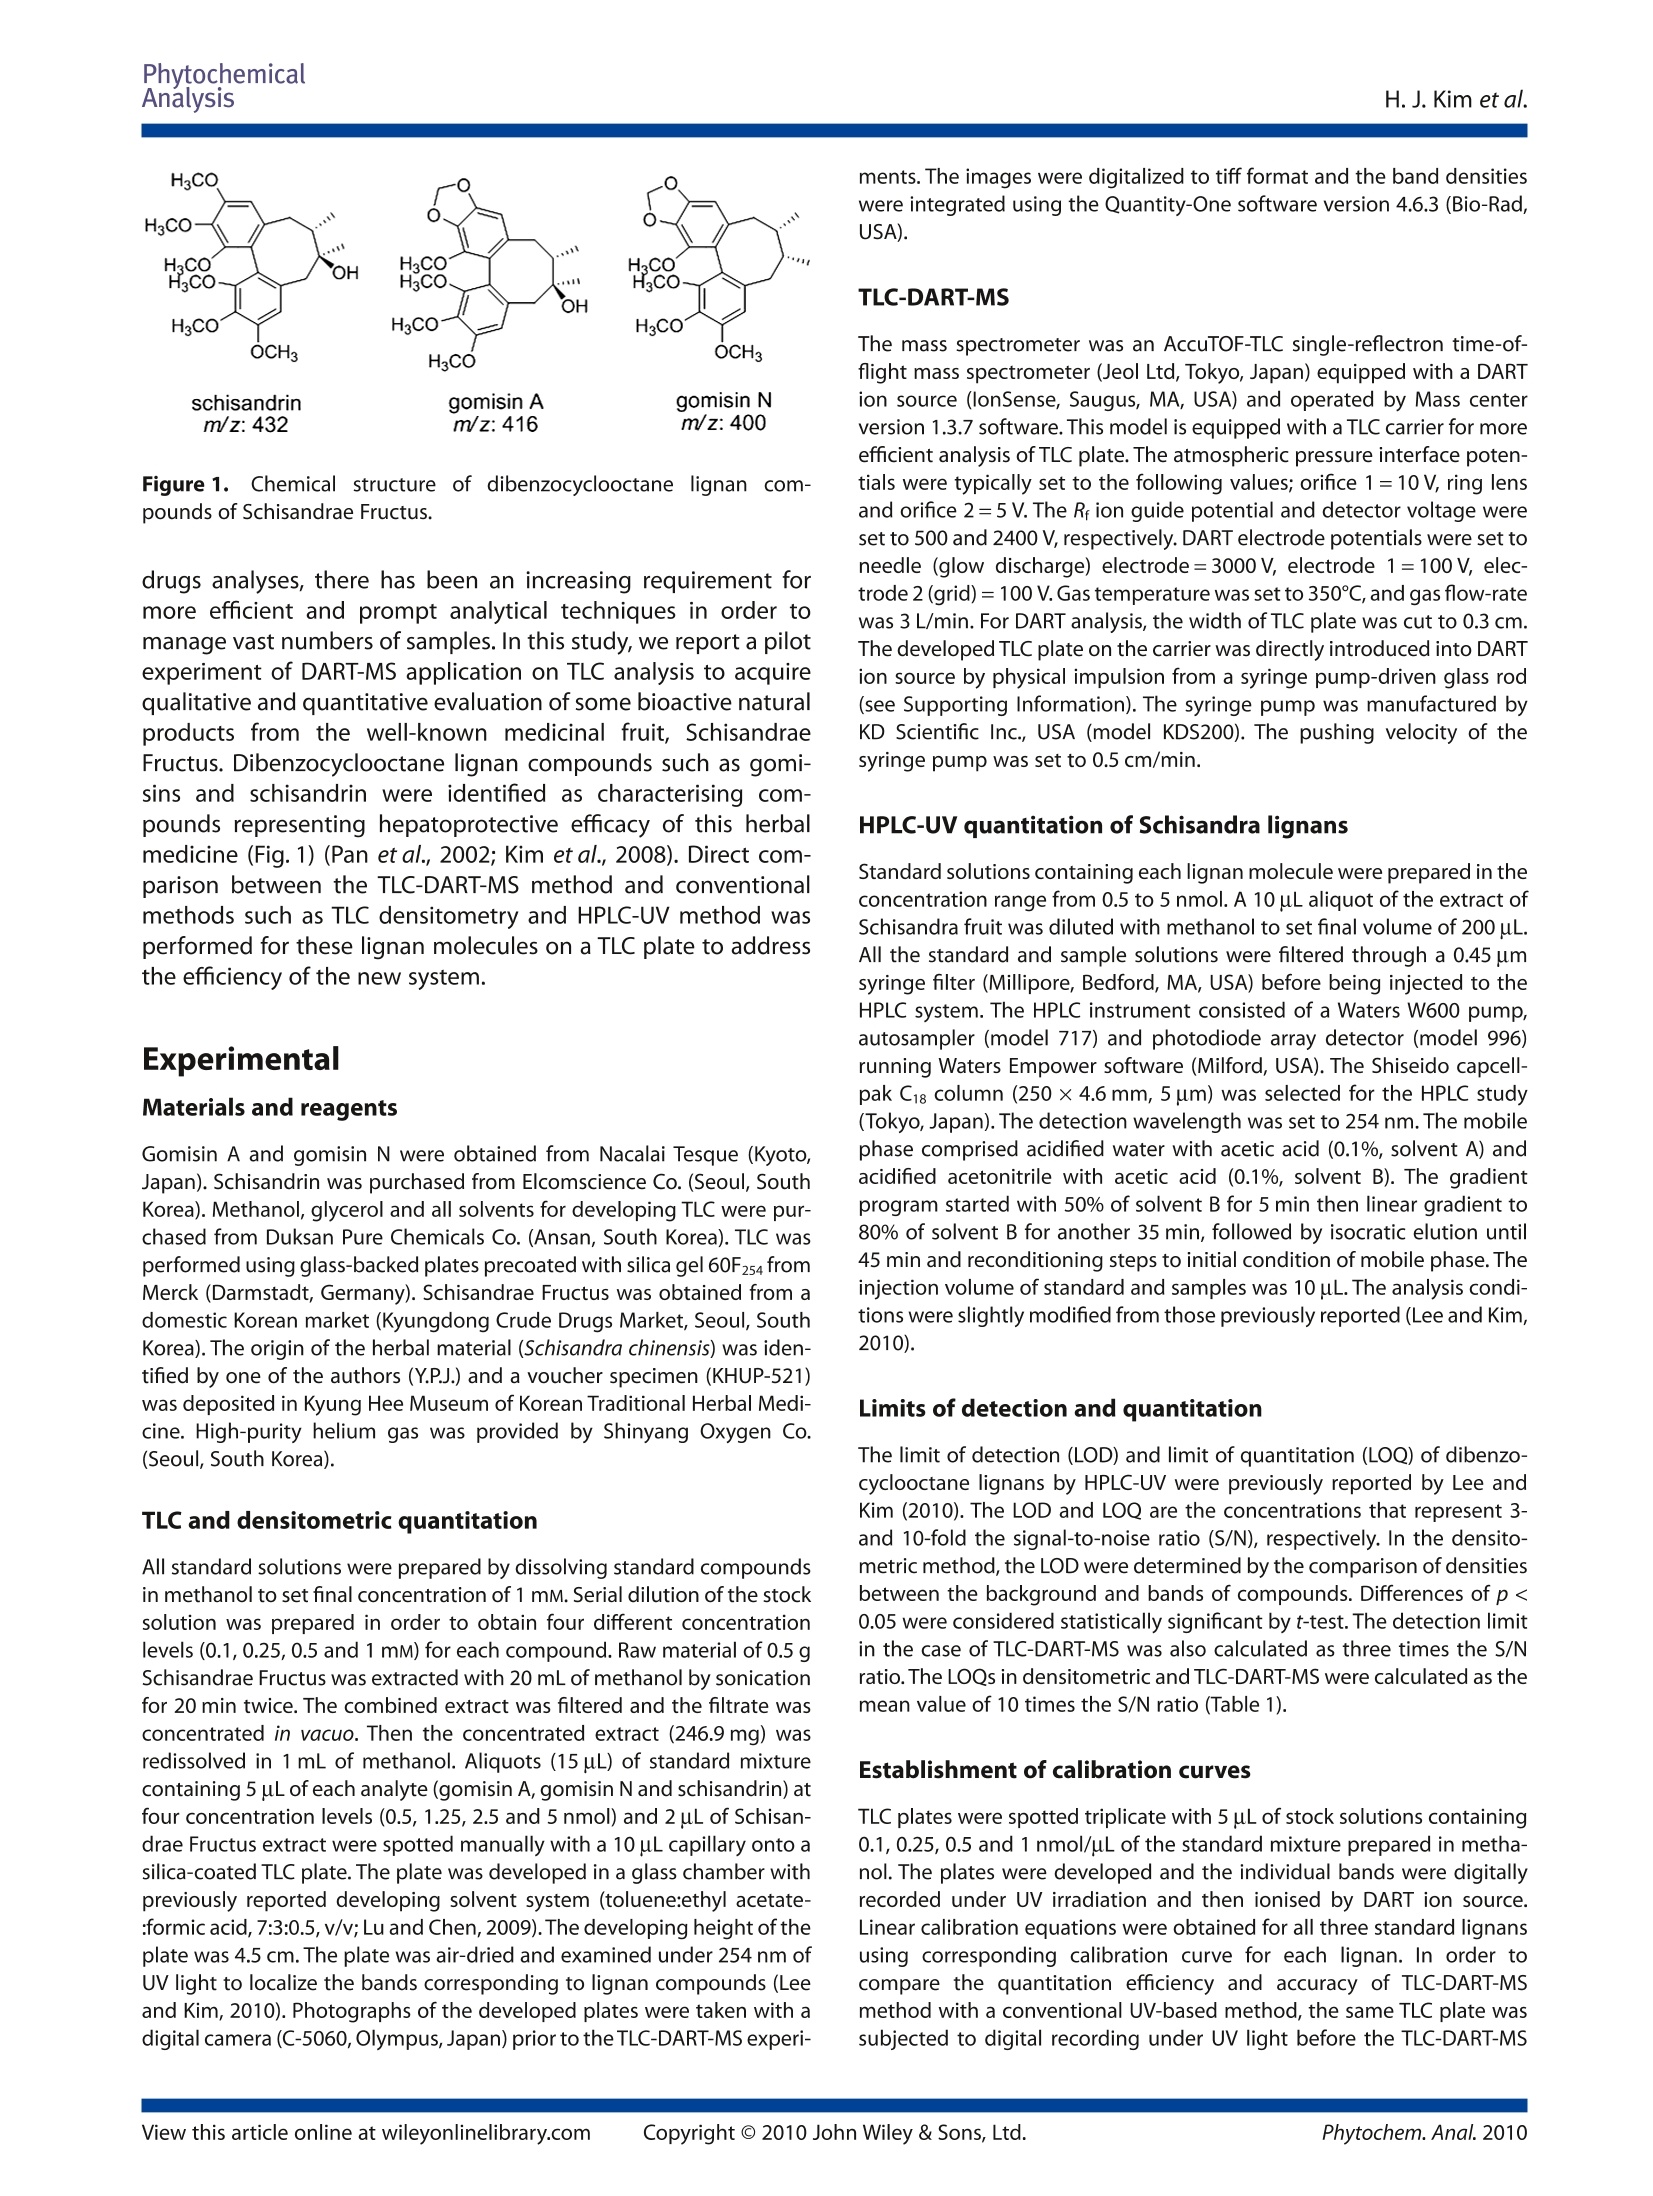
PhytochemicalAnalysisResearch ArticleReceived: 10 July 2010;Revised: 10 August 2010; Accepted: 10 August 2010Published online in Wiley Online Library PhytochemicalAnalysisH. J. Kim et al. (wileyonlinelibrary.com) DOI 10.1002/pca.1273 Quantitative Analysis of MajorDibenzocyclooctane Lignans in SchisandraeFructus by Online TLC-DART-MS Hye Jin Kim, Myung Sook Oh, Jongki Hong and Young Pyo Jang* Introduction - Direct analysis in real time (DART) ion source is a powerful ionising technique for the quick and easy detectionof various organic molecules without any sample preparation steps, but the lack of quantitation capacity limits its extensiveuse in the field of phytochemical analysis. Objective- To improvise a new system which utilize DART-MS as a hyphenated detector for quantitation. Methodology-Atotal extract of Schisandra chinensis fruit was analyzed on a TLC plate and three major lignan compounds werequantitated by three different methods of UV densitometry, TLC-DART-MS and HPLC-UV to compare the efficiency of eachmethod.To introduce the TLC plate into the DART ion source at a constant velocity, a syringe pump was employed. TheDART-MS total ion current chromatogram was recorded for the entire TLC plate. The concentration of each lignan compoundwas calculated from the calibration curve established with standard compound. Results - Gomisin A, gomisin N and schisandrin were well separated on a silica-coated TLC plate and the specific ion currentchromatograms were successfully acquired from the TLC-DART-MS system. The TLC-DART-MS system for the quantitation ofnatural products showed better linearity and specificity than TLC densitometry, and consumed less time and solvent thanconventional HPLC method. Conclusion - A hyphenated system for the quantitation of phytochemicals from crude herbal drugs was successfully estab-lished. This system was shown to have a powerful analytical capacity for the prompt and efficient quantitation of naturalproducts from crude drugs. Copyright 2010 John Wiley & Sons, Ltd. Supporting information may be found in the online version of this article. Keywords:TLC-DART-MS; Schisandra chinensis; dibenzocyclooctane lignan Introduction Thin-layer chromatography (TLC) has long been a preferredanalysis tool for various biologically important molecules includ-ing pharmaceuticals, natural products and biomolecules,because it provides simple and convenient visualized analysiswithin a relatively short period of time. Although TLC has beenroutinely adopted for simple identification of target compounds,the lack of versatile hyphenation with various detectors limits itsuniversal application in phytochemical analysis, especially forquantitation. Therefore, a simple and robust analytical techniquewhich employs TLC method with a versatile detector is desired toachieve the quick and efficient analysis of target compoundsfrom crude extract. As one of most powerful detectors, mass spectrometry hasbeen engaged to identify and/or quantify specified molecules onTLC plates (Meisen etal., 2009). Direct analysis of organic mol-ecules on TLC plates in situ was technically possible when a totallynew ion source of ambient desorption ionization was introduced.Indeed, several research groups have reported this concept(Morlock and Schwack 2006; Morlock and Ueda 2007; Dytkiewitzand Morlock 2008; Pasilis et al., 2008;Smith et al., 2008; Kim andJang, 2009). A representative study was successfully performedby Van Berkel et al.(2007) using a TLC/DESI-MS combination todetect goldenseal alkaloids. Direct analysis in real time (DART) isa recently developed technique that is one of the new generationof ambient desorption ionization techniques such as desorption electrospray ionization (DESI) and atmospheric solids analysisprobe (Cody et al., 2005; McEwen et al.,2005;Takats et al., 2004). Itionizes samples directly in their native condition and transfersions into the mass analyzer without any of the sample prepara-tion steps that take up most of the consumed time for the analy-sis of raw materials. In the DART ion source, metastable heliumgas originating from the plasma through an electrical dischargereacts with ambient water molecules to produce the reactiveionized water clusters. In positive ion mode,analytes with highproton affinity in the sample are easily ionized by the transferof proton from water clusters without extensive fragmentedproducts. Therefore, the DART ion source produces relativelysimple and clean mass spectra consisting mainly of protonatedmolecules. Identification and quantification of bioactive principles fromherbal medicines are routinely performed using hyphenatedchromatographic systems, including HPLC-PDA, HPLC-MS andGC-MS. Although suchhnmethods have been successfullyemployed in various fields of natural products and crude herbal ( *Correspondence to: Young Pyo Jang, Ky u ng Hee Eas t -West Pharmaceutical R esearch Institute, College of Pharmacy, Kyung Hee Un i versity, S e oul 130- 7 01, K orea.E-mail: ypjang@khu.ac.kr ) ( Kyung Hee East-West Pharmaceutical Research Institute,College of Pharmacy,Kyung H e e University, Seoul 130-701, Korea ) Figure 1. Chemical structure of dibenzocyclooctane lignan com-pounds of Schisandrae Fructus. drugs analyses, there has been an increasing requirement formore efficient and prompt analytical techniques in order tomanage vast numbers of samples. In this study, we report a pilotexperiment of DART-MS application on TLC analysis to acquirequalitative and quantitative evaluation of some bioactive naturalproducts from the well-known medicinal fruit, SchisandraeFructus. Dibenzocyclooctane lignan compounds such as gomi-sins and schisandrin were identified as characterising com-pounds representing hepatoprotective efficacy of this herbalmedicine (Fig. 1) (Pan et al., 2002; Kim et al., 2008). Direct com-parison between the TLC-DART-MS method and conventionalmethods such as TLC densitometry and HPLC-UV method wasperformed for these lignan molecules on a TLC plate to addressthe efficiency of the new system. Experimental Materials and reagents Gomisin A and gomisin N were obtained from Nacalai Tesque (Kyoto,Japan). Schisandrin was purchased from Elcomscience Co.(Seoul, SouthKorea). Methanol, glycerol and all solvents for developing TLC were pur-chased from Duksan Pure Chemicals Co. (Ansan, South Korea). TLC wasperformed using glass-backed plates precoated with silica gel 60F254 fromMerck (Darmstadt, Germany). Schisandrae Fructus was obtained from adomestic Korean market (Kyungdong Crude Drugs Market, Seoul, SouthKorea). The origin of the herbal material (Schisandra chinensis) was iden-tified by one of the authors (Y.P.J.) and a voucher specimen (KHUP-521)was deposited in Kyung Hee Museum of Korean Traditional Herbal Medi-cine. High-purity helium gas was provided by Shinyang Oxygen Co.(Seoul, South Korea). TLC and densitometric quantitation All standard solutions were prepared by dissolving standard compoundsin methanol to set final concentration of 1 mM. Serial dilution of the stocksolution was prepared in order to obtain four different concentrationlevels (0.1,0.25,0.5 and 1 mM) for each compound. Raw material of 0.5 gSchisandrae Fructus was extracted with 20 mL of methanol by sonicationfor 20 min twice. The combined extract was filtered and the filtrate wasconcentrated in vacuo. Then the concentrated extract (246.9 mg) wasredissolved in 1 mL of methanol. Aliquots (15 uL) of standard mixturecontaining 5 uL of each analyte (gomisin A, gomisin N and schisandrin) atfour concentration levels (0.5, 1.25, 2.5 and 5 nmol) and 2 uL of Schisan-drae Fructus extract were spotted manually with a 10 uL capillary onto asilica-coated TLC plate. The plate was developed in a glass chamber withpreviously reported developing solvent system (toluene:ethyl acetate-:formic acid, 7:3:0.5, v/v;Lu and Chen, 2009). The developing height of theplate was 4.5 cm. The plate was air-dried and examined under 254 nm ofUV light to localize the bands corresponding to lignan compounds (Leeand Kim, 2010). Photographs of the developed plates were taken with adigital camera (C-5060,Olympus,Japan) prior to the TLC-DART-MS experi- ments. The images were digitalized to tiff format and the band densitieswere integrated using the Quantity-One software version 4.6.3 (Bio-Rad,USA). TLC-DART-MS The mass spectrometer was an AccuTOF-TLC single-reflectron time-of-flight mass spectrometer (Jeol Ltd, Tokyo, Japan) equipped with a DARTion source (lonSense, Saugus, MA, USA) and operated by Mass centerversion 1.3.7 software. This model is equipped with a TLC carrier for moreefficient analysis of TLC plate. The atmospheric pressure interface poten-tials were typically set to the following values; orifice 1 =10 V, ring lensand orifice 2=5 V. The Rion guide potential and detector voltage wereset to 500 and 2400V, respectively. DART electrode potentials were set toneedle (glow discharge) electrode=3000 V, electrode 1=100V, elec-trode 2 (grid)=100 V. Gas temperature was set to 350℃, and gas flow-ratewas 3 L/min. For DART analysis, the width of TLC plate was cut to 0.3 cm.The developed TLC plate on the carrier was directly introduced into DARTion source by physical impulsion from a syringe pump-driven glass rod(see Supporting Information). The syringe pump was manufactured byKD Scientific Inc., USA (model KDS200). The pushing velocity of thesyringe pump was set to 0.5 cm/min. HPLC-UV quantitation of Schisandra lignans Standard solutions containing each lignan molecule were prepared in theconcentration range from 0.5 to 5 nmol. A 10 uL aliquot of the extract ofSchisandra fruit was diluted with methanol to set final volume of 200 uL.All the standard and sample solutions were filtered through a 0.45 umsyringe filter (Millipore, Bedford, MA, USA) before being injected to theHPLC system. The HPLC instrument consisted of a Waters W600 pump,autosampler (model 717) and photodiode array detector (model 996)running Waters Empower software (Milford, USA). The Shiseido capcell-pak C18 Column (250×4.6 mm, 5 um) was selected for the HPLC study(Tokyo,Japan). The detection wavelength was set to 254 nm. The mobilephase comprised acidified water with acetic acid (0.1%, solvent A) andacidified acetonitrile with acetic acid (0.1%, solvent B). The gradientprogram started with 50% of solvent B for 5 min then linear gradient to80% of solvent B for another 35 min, followed by isocratic elution until45 min and reconditioning steps to initial condition of mobile phase. Theinjection volume of standard and samples was 10 uL. The analysis condi-tions were slightly modified from those previously reported (Lee and Kim,2010). Limits of detection and quantitation The limit of detection (LOD) and limit of quantitation (LOQ) of dibenzo-cyclooctane lignans by HPLC-UV were previously reported by Lee andKim (2010). The LOD and LOQ are the concentrations that represent 3-and 10-fold the signal-to-noise ratio (S/N), respectively. In the densito-metric method, the LOD were determined by the comparison of densitiesbetween the background and bands of compounds. Differences of p <0.05 were considered statistically significant by t-test. The detection limitin the case of TLC-DART-MS was also calculated as three times the S/Nratio. The LOQs in densitometric and TLC-DART-MS were calculated as themean value of 10 times the S/N ratio (Table 1). Establishment of calibration curves TLC plates were spotted triplicate with 5 uL of stock solutions containing0.1, 0.25, 0.5 and 1 nmol/uL of the standard mixture prepared in metha-nol. The plates were developed and the individual bands were digitallyrecorded under UV irradiation and then ionised by DART ion source.Linear calibration equations were obtained for all three standard lignansusing corresponding calibration curve for each lignan. In order tocompare the quantitation efficiency and accuracy of TLC-DART-MSmethod with a conventional UV-based method, the same TLC plate wassubjected to digital recording under UV light before the TLC-DART-MS HPLC-UV Method Compound Regression equation r² Linear range (nmole) LOD (pmole) LOQ (pmole) TLC-DART-MS Schisandrin y=6560.5x+15570 0.9705 0.5-5 57.5 191.7 Gomisin A y=12811x+7778.5 0.9762 0.5-5 60 200 Gomisin N y=113279x-79605 0.9431 0.5-5 57.5 191.7 TLC/UV Schisandrin y=17.599x+5.909 0.9703 0.5-5 460 1,533.3 Gomisin A y=20.265x+34.417 0.9041 0.5-5 480 1,440 Gomisin N y=24.878x+25.133 0.9562 0.5-5 500 1,600 HPLC/UV Schisandrin y=987402x-293271 0.9819 0.5-5 3.08 10.3 Gomisin A y=514904x-51730 0.9948 0.5-5 1.68 Gomisin N y=782817x-46570 0.9991 0.5-5 0.70 study. The comparison of the linear regression equation and co-efficienct(r) for each lignan compound by three different methods is summarizedin Table 1 with their LOD and LOQ. Recovery test The accuracy of new TLC-DART-MS method was determined by a recoverytest. The extract was spiked with 2.5 nmol of each reference compound,and then analysed as described below in triplicate. The total amount ofeach analyte was calculated from the corresponding calibration curve,and the recovery of each compound was calculated by the followingequation: recovery (%)=(amountdetermined-amount original)/amount spikedx100. The accuracy results are shown in Table 3. Results and Discussion TLC of Schisandra lignans and TLC-DART-MS spectra There have been some studies on the hyphenation of direct ion-ization of organic molecules on TLC plate and mass spectrom-etry to provide prompt and efficient analytical tools (Morlockand Schwack, 2006; Smith et al.,2008). However, the absence ofreports dealing with direct comparison of TLC-MS with conven-tional TLC densitometric quantitation and HPLC methods,espe-cially on phytochemicals, has raised the need for this study. When the measured amount of Schisandra lignan mixture wasspotted on a silica-coated TLC plate and developed with specifiedcondition of solvent system, three bands of lignan compoundswere well separated according to their polarity order (Fig.2a).Under illumination of UV 254 nm, three lignans of schisandrin,gomisin A and gomisin N appeared as dark brown spots overdifferent areas and the intensity of each spot was slightly differ-ent. These differences were able to be quantitated by digitalimaging and scanning software, which was basically used as in adensitometric quantitation system. In order to acquire ion current chromatogram directly from thedeveloped TLC with no further sample preparation, the plateneeded a appropriate motorised device which was able to deliverthe plate into the DART ion source with constant speed, and asyringe pump was selected for this purpose. The accurate andslow movement provided by the piston of the syringe pump wasadequate for the separated compounds on the TLC plate tobe ionized efficiently enough to draw bell-shaped peaks of ioncurrents. As shown in Fig. 2, each lignan band on the TLC platewas efficiently ionised to produce the corresponding selected ioncurrent chromatogram. The retention time of specific DART-MSpeak was beautifully matched to its corresponding location, theRr value of each lignan, on the TLC plate. The peak shape of TLC- Figure 2.TLC-DART-MS chromatogram of standard lignan compounds.(a) bands of schisandrin, gomisin A and gomisin N (5 nmol each) on TLCplate under UV light (254 nm). Selected ion current chromatogram for (b)schisandrin ([M+H-H20], m/z 415), (c) gomisin A ([M+H-H20], m/z399) and (d) gomisin N ([M+H],m/z 401). DART-MS chromatogram was similar to a symmetrical bell shape,the area under which could be easily calculated by the built-insoftware. From the structural point of view, gomisin A and schisandrinhave a hydroxy group at C-7 (Fig. 1) and the secondary hydroxylgroup is often eliminated in the form of dehydration during theatmospheric pressure ionization process. Indeed,the ion peaks ofthese compounds strongly appeared at m/z 399 and 415, respec-tively, by the elimination of water molecule rather than protona-tion during the ionisation process (Fig. 3a and b; Deng et al.,2008). In contrast to these compounds, gomisin N was detectedas a protonated form ([M+H]*, m/z 401; Fig.3c). The dehydratedand protonated ion peaks of standard lignans were successfullydetected in real time from their TLC bands directly. Calibration curves for TLC densitometric, TLC-DART-MS andHPLC quantification of lignans in Schisandra fruit To compare the efficacy of the new TLC-DART-MS quantificationmethod with those of conventional TLC densitometric and HPLC methods, calibration curves for each method were establishedusing standard solutions of each lignan compound. For TLCdensitometric method, serially diluted standards of lignan mol-ecules were spotted,developed and pictured to digitally quan-titate each area of lignan on the TLC plate. A representativeHPLC chromatogram used in the establishment of calibrationcurve for HPLC method is shown in Fig. 4. The coefficients values(r²) of densitometric method were between 0.90 and 0.97, whichwere lower than the values from the HPLC method (Table 1). Thevalues from TLC-DART-MS method were not very impressive butslightly better than the TLC densitometric method values. Thebiggest difference between three methods was found in LODand LOQ values. The LOD of the TLC densitometric method wasaround the nanomole scale, and a scale of a few picomole could Figure 33.. DART-MS spectra obtained for (a) schisandrin, (b) gomisin Aand (c) gomisin N, directly from corresponding band on the TLC platespotted with a mixture of lignan standards and developed. be detected in the case of the HPLC method. For the TLC-DART-MS method, the LOD was around one-tenth of the densi-tometric method. The relatively higher LOD of the TLC-DART-MSmethod compared with HPLC might be originated from thehydrogen bonding between silica gel and lignan compounds,which attenuated the volatility of target compounds in theanalysis. Quantitation of lignan compounds in the extract ofSchisandra fruit by TLC densitometric,TLC-DART-MS andHPLC method Using the established calibration curves, the contents ofSchisandra lignans in the extract were quantitated by three dif-ferent methods (Table 2). The calculated contents of schisandrinand gomisin A in the extract by DART-MS method were 2- to3-fold greater than the values calculated from densitometricmethod, and these values are much close to the values from theHPLC method. The deviation between the two methods wasexpected because the principles and specificity under these twodifferent quantitation methods were totally different. In thecase of gomisin A, the content by TLC-DART-MS was smallerthan the value from the UV method. When the band bearinggomisin A on the TLC plate contained other compounds, a falsehigher quantitation by densitometric method was possiblebecause some other compounds with similar Rr values togomisin A may contribute the density of the spot under UVexposure for quantitation. In the DART-MS chromatogram of theTLC plate, since the selected ion chromatogram for the specificlignan molecule was drawn for the quantification, this false con-tribution from other co-existing compounds can be excluded asin the HPLC-MS method. Regarding the time consumption forthe quantitation study of each method, the TLC-DART-MS Retention time Figure 4. Representative HPLC chromatogram of the extract of Schisandra fruit. Peaks identification: 1, schisandrin; 2, gomisin A;3,y-schisandrin;and4, gomisin N. The identities of peaks of schisandrin, gomisin A and gomisin N were confirmed by coinjection with authentic samples and foryschisandrin; comparison of LC-MS data with previously reported literature was performed to assign the identity (Deng et al., 2008). Quantitation method Calculated contents of lignans in crude extract (nmol) Running time (min) Schisandrin Gomisin A Gomisin N Densitometric 5.14±0.03 3.74±0.79 6.45±0.51 9+5 (developing time) TLC-DART-MS 17.07±1.33 3.25±0.28 13.48±2.98 9+5 (developing time) HPLC-UV 33.67±7.39 12.84±3.36 17.75±1.55 60 Table 3. Recovery test of fthree dibenzocyclooctane lignans in Schisandra chinensis by TLC-DART-MS Recovery percentage determined by the spike method of authentic sample (n=3) Compound Spike amount Recovery RSD (%) (nmol) mean (%) Schisandrin 2.5 104.0 33.5 Gomisin A 2.5 120.2 12.0 Gomisin N 2.5 107.6 10.2 method was similar to the simple TLC method and much moreefficient than the HPLC method (Table 2). Therefore, the TLC-DART-MS method provides more prompt and specific quantita-tion capacity compared with the conventional methods.Although there is some margin for progress in the accuracy ofquantitation, as can be seen in the recovery test of the TLC-DART-MS method (Table 3), the results from the TLC-DART-MSexperiments showed significant quantitation capacity for thethree target compounds that could be practically applied tonatural products analysis. Since the DART-MS chromatogramcan be extracted at specified molecular weights, the methodcan be successfully applied to overlapping spots of differentcompounds that cannot be resolved under UV light or othervisualization methods. In this study, we designed a hyphenated analysis system ofTLC-DART-MS for the rapid and selective quantitation of naturalproducts in crude herbal drug. This system successfully providedreal-time information on high-resolution mass number for eachcompound on TLC plates with an LC-MS-like chromatogram andselective quantitation of target compounds. One of the majorlimitations of TLC method, the low resolution between spotswithin a short length of the plate, can be effectively overcome bythe selectivity conferred by the high-resolution mass analyser ofthis system. Since TLC is still used widely in practice for naturalproducts analysis for its simple and easy process, the combina-tion of DART-MS as a detecting tool will maximise the efficacy ofTLC analysis and open a whole new way of the quality control ofnatural products containing pharmaceuticals, cosmetics andfunctional foods. Considering the current trend for the establish-ment of the chemical fingerprint as a tool for quality control ofbotanical drugs and herbal medicinal products, this method canbe effectively utilized in this field of science. Supporting information Supporting information can be found in the online version ofthis article. Acknowledgements This work was supported by a grant from Kyung Hee University(2009). References Cody RB, Laramee JA, Durst HD.2005. Versatile new ion source for theanalysis of materials in open air under ambient conditions. Anal Chem77:2297-2302. Deng X, Chen X, Cheng W, Shen Z, Bi K. 2008. Simultaneous LC-MS quan-tification of 15 lignans in Schisandra chinensis (Turcz.) Baill. fruit. Chro-matographia 67:559-566. ( Dytkiewitz E, M orlock GE. 2008. Analytical strategy for rapid identificationand quantification o f l ubricant additives in mineral o il by high-performance t hin-layer chromatography with UV absorption a ndfluorescence detection combined with mass spectrometry and infra- r ed spectroscopy.J AOAC Int 91:1237. ) Kim HJ, Jang YP. 2009. Direct analysis of curcumin in turmeric by DART-MS. Phytochem Anal 20:372-377. ( Kim SH, Kim YS, Kang SS, Bae KH, Hung TM, Lee SM. 2008. Anti-apoptoticand h epatoprotective effects of gomisin A on f u lminant h e paticfailure induced by D -galactosamine and lipopolysaccharide in m i ce. JPharmacol Sci 106:225-233. ) Lee HJ, Kim CY. 2010. Simultaneous determination of nine lignans usingpressurized liquid extraction and HPLC-DAD in the fruits of Schisandrachinensis. Food Chem 120:1224-1228. Lu Y, Chen DF. 2009. Analysis of Schisandra chinensis and Schisandrasphenanthera.J Chromatogr A 1216:1980-1990. McEwen CN, McKay RG, Larsen BS. 2005. Analysis of solids, liquids, andbiological tissues using solids probe introduction at atmosphericpressure on commercial LC/MS instruments. Anal Chem 77: 7826-7831. Meisen l, Distler U, Muthing J, Berkenkamp S, Dreisewerd K, Mathys W,Karch H, Mormann M. 2009. Direct coupling of high-performancethin-layer chromatography with UV spectroscopy and IR-MALDIorthogonal TOF MS for the analysis of cyanobacterial toxins. AnalChem81:3858-3866. ( Morlock G, S chwack W . 2 0 06. Determination of isopropylthioxanthone(ITX) in milk, yoghurt and fat by HPTLC-FLD, H PTLC-ESI/MS a n d HPTLC-DART/MS.Anal Bioanal Chem 385:586-595. ) Morlock G, Ueda Y. 2007. New coupling of planar chromatography withdirect analysis in real time mass spectrometry.J Chromatogr A 1143:243-251. ( P an S Y, H an YF, C arlier PR, Pang YP, Mak D H, L am B Y , Ko K M . 2002.Schisandrin B p r otects a g ainst t a crine- a n d bis(7)-tacrine-induced h epatotoxicity a nd enhances cognitive function i n mice. Planta Med 68:217-220. ) ( Pasilis SP, Kertesz V, Van Berkel G J, S chulz M, S c horcht S. 2008. Us i ng HPTLC/DESI-MS for peptide identification in 1 D separations of tryptic p rotein digests. Anal Bioanal Chem 391: 317-324. ) ( Smith NJ, D omin MA, Scott LT . 2008. HR M S directly from TLC slides. A p owerful tool for rapid analysis of organic mixtures. Org Lett 10:3493- 3496. ) ( T akats Z, Wiseman J M, Gologan B, Cooks R G. 2004. Mass s pectrometrysamplingunder ambient conditions with desorption electrospray ion- ization. Science 306: 471. ) ( Van Berkel G J, Tomkins BA, Kertesz V. 2007. Thin-layer chromatography/ desorption electrospray ionization mass spectrometry: investigation of goldenseal alkaloids. Anal Chem 79:2778-2789. ) Copyright ◎ John Wiley & Sons, Ltd.Phytochem.Anal. View this article online at wileyonlinelibrary.comCopyright ◎ John Wiley & Sons, Ltd.Phytochem. Anal.
关闭-
1/5
-
2/5
还剩3页未读,是否继续阅读?
继续免费阅读全文产品配置单
华质泰科生物技术(北京)有限公司为您提供《五味子中主要成份木脂素检测方案(液质联用仪)》,该方案主要用于中药材和饮片中含量测定检测,参考标准《暂无》,《五味子中主要成份木脂素检测方案(液质联用仪)》用到的仪器有null。
我要纠错
相关方案
 咨询
咨询