

方案详情文
智能文字提取功能测试中
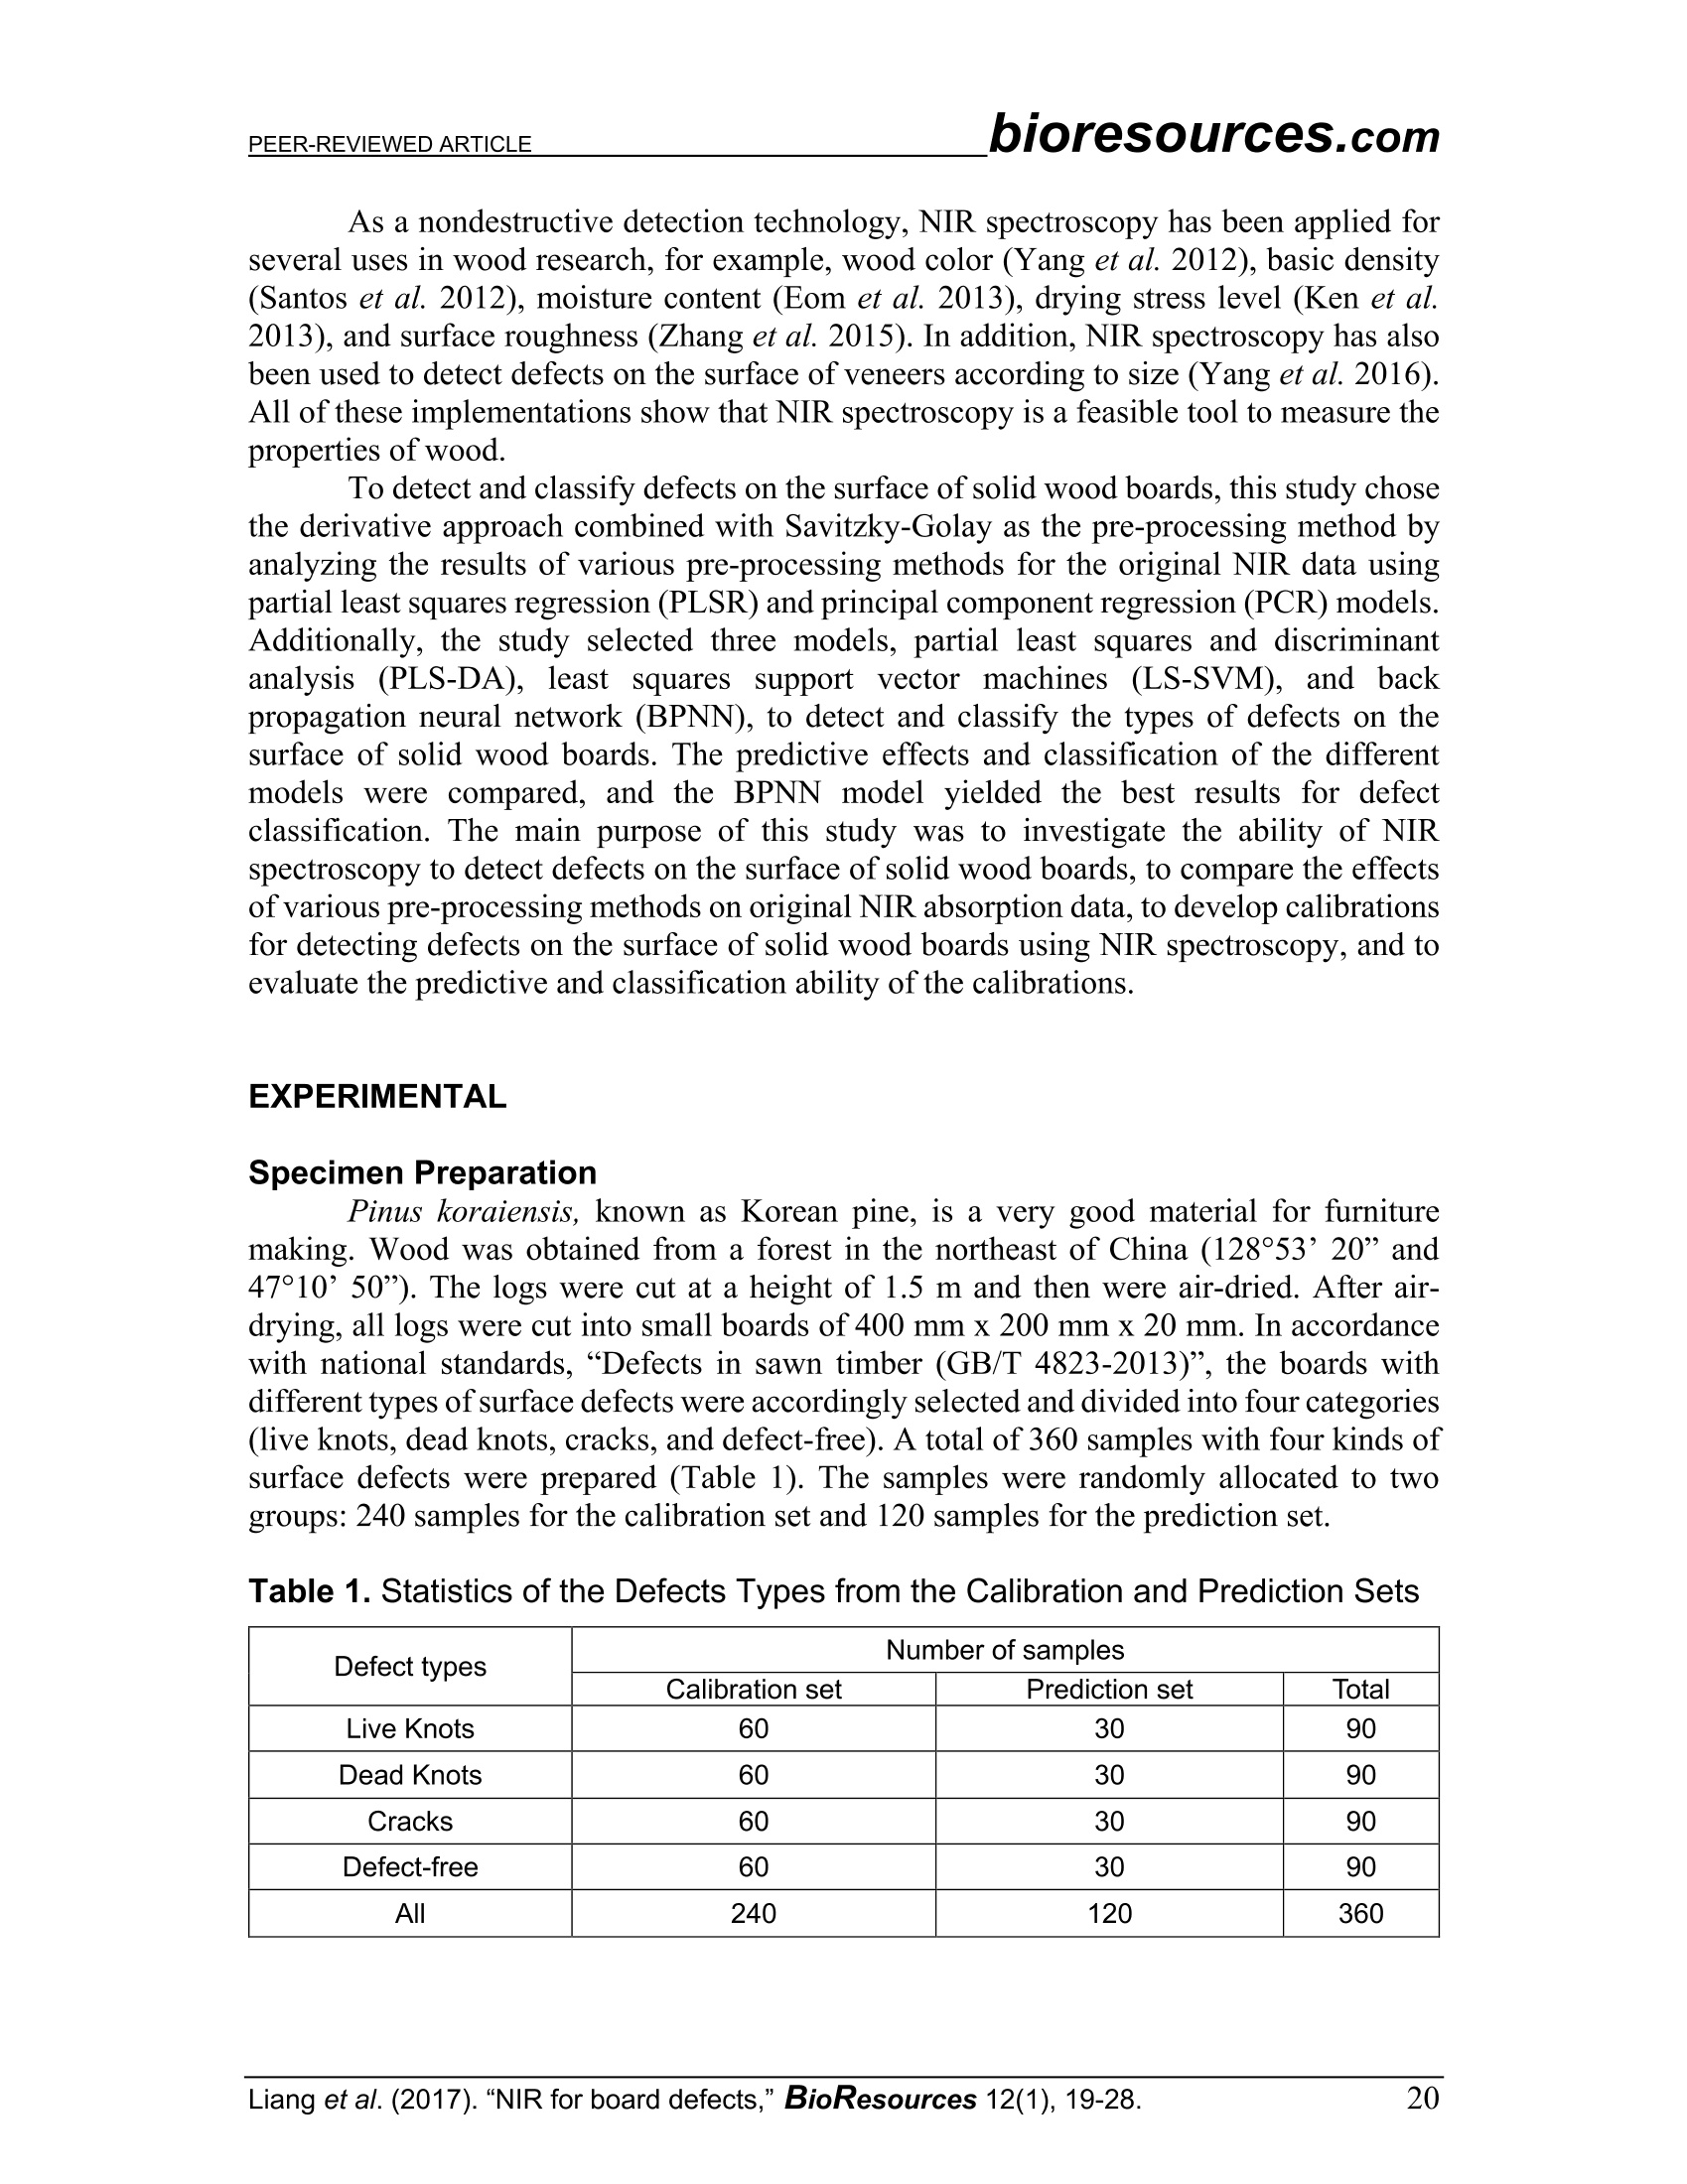
bioresources.comPEER-REVIEWED ARTICLE Potential of Near-infrared Spectroscopy to DetectDefects on the Surface of Solid Wood Boards Jun Cao, Hao Liang, Xue Lin,Wenjun Tu, and Yizhuo Zhang a.* Defects on the surface of solid wood boards directly affect theirmechanical properties and product grades. This study investigated the useof near-infrared spectroscopy (NIRS) to detect and classify defects on thesurface of solid wood boards. Pinus koraiensis was selected as the rawmaterial. The experiments focused on the ability to use the model to sortdefects on the surface of wood into four types, namely live knots, deadknots, cracks, and defect-free. The test data consisted of 360 NIRabsorption spectra of the defect samples using aportable NIRspectrometer, with the wavelength range of 900 to 1900 nm. Three pre-processing methods were used to compare the effects of noise eliminationin the original absorption spectra. The NIR discrimination models weredeveloped based on partial least squares and discriminant analysis (PLS-DA), least squares support vector machine (LS-SVM), and back-propagation neural network (BPNN) from 900 to approximately 1900 nm.The results demonstrated that the BPNN model exhibited the highestclassification accuracy of 97.92% for the model calibration and 97.50% forthe prediction set. These results suggest that there is potential for the NIRmethod to detect defects and differentiate between types of defects on thesurface of solid wood boards. Keywords: Surface defects; Solid wood boards; Near-infrared spectroscopy; PLS-DA; BPNN; LS-SVM Contact information: a: College of Mechanical and Electrical Engineering, Northeast Forestry University,Harbin, 150040, China; b: Material Science and Engineering College, Northeast Forestry University,Harbin, 150040, China; *Corresponding authors: nefuzyz@163.com INTRODUCTION Wood is a very important construction material that can achieve a high degree ofstructural performance and reliability. In recent years researchers have studied variousaspects of wood to evaluate its quality and grade. Solid wood boards play a key role in theperformance of building decoration. Therefore, the detection of surface defect informationhas become a necessary part of solid wood processing. Because of the complexity of thetexture and color of wood, it is difficult for visual methods to detect the surface defects ofboards correctly, especially those that are small in size. Therefore, a fast and accuratemethod of detection is needed to determine and classify the surface defects on solid woodboards. In recent years, several new wood surface defect detection techniques have arisen,including ultrasonic technology (Kabir et al.2003), microwave technology (Baradit et al.2006), and X-rays (Cristhian et al.2008). However, the detection of defects on the surfaceof solid wood boards needs to be rapid, inexpensive, and simple to operate andindustrialize. Near-infrared (NIR) spectroscopy can meet these requirements and iscontactless, nondestructive, and free of radiation hazards. As a nondestructive detection technology, NIR spectroscopy has been applied forseveral uses in wood research, for example, wood color (Yang et al.2012), basic density(Santos et al. 2012), moisture content (Eom et al.2013), drying stress level (Ken et al.2013), and surface roughness (Zhang et al. 2015). In addition, NIR spectroscopy has alsobeen used to detect defects on the surface of veneers according to size (Yang et al.2016).All of these implementations show that NIR spectroscopy is a feasible tool to measure theproperties of wood. To detect and classify defects on the surface of solid wood boards, this study chosethe derivative approach combined with Savitzky-Golay as the pre-processing method byanalyzing the results of various pre-processing methods for the original NIR data usingpartial least squares regression (PLSR) and principal component regression (PCR) models.Additionally, the study selected three models, partial least squares and discriminantanalysis (PLS-DA), least squares rtyvector machines (LS-SVM), and backpropagation neural network (BPNN), to detect and classify the types of defects on thesurface of solid wood boards. The predictive effects and classification of the differentmodelss were compared,and the BPNN model yielded the best results for defectclassification. The main purpose of this study was to investigate the ability of NIRspectroscopy to detect defects on the surface of solid wood boards, to compare the effectsof various pre-processing methods on original NIR absorption data, to develop calibrationsfor detecting defects on the surface of solid wood boards using NIR spectroscopy, and toevaluate the predictive and classification ability of the calibrations. EXPERIMENTAL Specimen Preparation Pinus koraiensis, known as Korean pine, is a very good material for furnituremaking. Wood was obtained from a forest in the northeast of China (128°53’20”and47°10’50”). The logs were cut at a height of 1.5 m and then were air-dried. After air-drying, all logs were cut into small boards of 400 mm x 200 mm x20 mm. In accordancewith national standards,“Defects in sawn timber (GB/T 4823-2013)”, the boards withdifferent types of surface defects were accordingly selected and divided into four categories(live knots, dead knots, cracks, and defect-free). A total of 360 samples with four kinds ofsurface defects were prepared (Table 1). The samples were randomly allocated to twogroups: 240 samples for the calibration set and 120 samples for the prediction set. Table 1. Statistics of the Defects Types from the Calibration and Prediction Sets Defect types Number of samples Calibration set Prediction set Total Live Knots 60 30 90 Dead Knots 60 30 90 Cracks 60 30 90 Defect-free 60 30 90 All 240 120 360 Table 2. Statistics of the Defects Types from the Calibration and Prediction Sets Defect types Number of samples Calibration set Prediction set Total Live Knots 60 30 90 Dead Knots 60 30 90 Cracks 60 30 90 Defect-free 60 30 90 All 240 120 360 NIR Spectra Measurements The NIR absorption spectra were acquired using an ultra-compact NIR fiber opticspectrometer (Insion Co., Gmbh, Heilbronn, Germany) from 900 to 1900 nm at a resolutionof 9 nm. The spectrometer had two fiber optic probes to scan the sample surface. Thesewere oriented at an angle of 90°above the surface of the solid wood boards. The NIRspectra data were collected using SPEC view 7.1 software (Insion Co., GmbH, Heilbronn,Germany) and exported as Excel (Microsoft, Redmond, WA) files. All measurements weretaken under laboratory conditions, 20±2 °℃ and 40% to 50% relative humidity. Thirtyspectra from each sample were collected and then averaged to a single spectrum torepresent a pooled mean. The wavelengths from 1000 to 1600 nm contained the majorityof the information about the wood properties (Todorovic et al. 2015). Pre-Processing of NIR Spectra Pre-processing is necessary and important to eliminate high-frequency noise,baseline drift, light scattering, and other negative effects in the spectra and to subsequentlyimprove the regression, classification model, or exploratory analysis. There are many pre-processing methods, including normalization, smoothing, and Fourier transform.Multiplicative scatter correction (MSC) and standard normal variate (SNV) calculationwere used to accomplish scatter correction and also to adjust the baseline excursion(Rinnan et al. 2009). Derivative combined with Savitzky-Golay was capable of effectivelyremoving the interference of baseline and other backgrounds, resolving overlapping peaks,and improving resolution and sensitivity. In addition, Savitzky-Golay derivation smoothedthe raw data. Data were pre-processed using the MSC and SNV, as well as taking thederivative combined with Savitzky-Golay (derivative combined with Savitzky-Golaypolynomial order=2, smoothing point=5). Statistical Analysis Partial least squares (PLS) PLS investigates relationships between spectral and concentration data. The PLSmodel was fit using the non-linear iterative partial least squares (NIPALS) algorithm withthe cross-validation of eight randomly chosen segments. The latent variables of PLS wereselected to relate to the set of responses to optimize the latent variables'ability to describethe variance in responses and to improve predictability. PLS can be used for both the dataclassification and prediction of responses (Danvind 2002). Partial least squares and discriminant analysis (PLS-DA) PLS-DA is a variant of PLS. In this method, PLS-DA is performed to build modelsfor classification. The models were developed and cross-validated for an optimum numberof components using partial least squares regression and setting different values fordifferent types of surface defects (Takizawa et al. 2014). The ideal values predicted byPLS-DA are integers, but in practice, these values only approximate these numbers. It wasassumed that the predicted y values followed a distribution similar to what will be observedfor future samples. With these estimated distributions, a threshold was calculated tooptimize a model for future predictions (Nascimbem et al. 2013). Least squares support vector machines (LS-SVM) Least squares support vector machine (LS-SVM) regression is a statistical learningmethod with a good theoretical foundation. It is an interesting renovation of SVMregression proposed by Suykens et al. (2002). LS-SVM is a nonlinear multivariatecalibration method that adopts a least squares linear system as a loss function. LS-SVMhas the capability for linear and non-linear multivariate calibration and quickly solvingmultivariate calibration problems (Li et al. 2016). Back propagation neural network (BPNN) Back propagation neural network (BPNN), a feed-forward network, is one of themost widely used neural networks. It uses a learning process to minimize the global errorof the system by modifying node weights. The network is trained by initially selecting theweights at random and then presenting all training data repeatedly. The weights are thenadjusted after every trial using external information to specify the correct result until theweights converge and the errors are reduced to acceptable values (Zhu et al.2016). Theneural network used in this study was established and consisted of an input layer, one ormore hidden layers, and one output layer. Input data was obtained as the pre-processedabsorbance spectra. The output neurons were using dummy variable values (1000 for liveknots, 0100 for dead knots, 0010 for cracks, and 0001 for defect-free). Chemometrics Software The data import, pre-processing (MSC, SNV, derivative combined with Savitzky-Golay), and construction of classification models (PLS-DA, LS-SVM, and BPNN) wereimplemented in MATLAB R2012b software (Mathworks Inc, Natick,MA). RESULTS AND DISCUSSION Effects of Pre-Processing Spectra Figure 1 shows the NIR absorption of all the defect-free samples from 900 to 1864nm. It could be seen that the distribution range of the calibration set was larger than theprediction set. Such sets were employed so that the samples of the calibration set could beregarded as representative. It was possible to verify some high-frequency noise,baselinedrift, and other negative effects from Fig. 1. Therefore, three pre-processing methods, MSC,SNV, and derivative combined with Savitzky-Golay, were performed with the raw data.To compare the effects of the pre-processing methods, PLSR and PCR were used tointerpret the relationship between the calibration set and the prediction set.. Theperformance of regression modelsWasassessed using four statistical metrics: (1) coefficient of determination of the calibration model (Rc²); (2) coefficient of determinationof the prediction model (Rp); (3) the root mean square error of calibration (RMSEC); and(4) the root mean square error of prediction (RMSEP). Table 2 shows the prediction resultsbased on different models and pre-processing methods. The results of the models withdifferent pre-processing methods are represented with Re’values ranging between 0.925and 0.994 and Rp’ values ranging between 0.921 and 0.991. Fig. 1. Original spectra of the defect-free samples in the (a) calibration sets and (b) predictionsets. Table2. Prediction Results Based on Various Models and Pre-ProcessingMethods Pre-Processing method Unprocessed MSC SNV DSG PLSR Rc² 0.927 0.936 0.986 0.994 RMSEC 0.04347 0.00943 0.00152 0.00034 Rp2 0.922 0.930 0.986 0.991 RMSEP 0.04574 0.00946 0.00163 0.00037 PCR R 0.926 0.928 0.975 0.983 RMSEC 0.4369 0.00940 0.00255 0.00044 Rp2 0.921 0.925 0.976 0.984 RMSEP 0.04562 0.00944 0.00253 0.00042 * PLSR: partialleast squares; PCR: principal component regression; Re: coefficient ofdetermination of the calibration model; Rp: coefficient of determination of the prediction model;RMSEC: the root mean square error of calibration; RMSEP: the root mean square error ofprediction; MSC: multiplicative scatter correction; SNV: standard normal variate;DSG: derivativecombined with Savitzky-Golay For the prediction models, the spectra pre-processed with the combination ofderivative and Savitzky-Golay exhibited the best results with an Re’ of 0.994, RMSEC of0.00034, Rpof 0.991, and RMSEP of 0.00037 in PLSR model. Likewise, for the PCRmodel, the best results were provided by the combination of derivative and Savitzky-Golay,with an Reof 0.983, RMSEC 0.00044, Rpof 0.984, and RMSEP of 0.00042. Figure 2shows the wood spectra of samples that were pre-processed with the combination ofderivative and Savitzky-Golay. The spectra were smoother and the noise and baseline driftwere mostly eliminated. Figure 3 shows the mean spectra of various types of defectsincluding live knots, dead knots, cracks, and defect-free after pre-processing. The spectraof four types of defects have some differences in the spectral range, especially in the rangeof 1468.16 to 1864 nm. 0.022 0.01 coo2--0.01 -0.02 -0.03 900 1000 1100 1200 13001400 15001600 1700 1800 1900 Wavelength (nm) (a) Fig. 2. Spectra of the defect-free samples pre-processed with a combination of derivative andSavitzky-Golay; (a) calibration sets; (b) prediction sets Fig. 3. NIR mean spectra of samples from different types of defects after pre-processing: L: liveknots, D: dead knots, C: cracks, F: defect-free Classification Results Based on Different Methods The analytical performance for the classification of the types of defects wascompared with the use of the linear regression method PLS-DA and the nonlinearregression methods LS-SVM and BP-ANN. All the methods were used to detect anddiscriminate defect types from the entire pool of defects. Results using PLS-DA for different types ofdefects First, the variable values of the calibration set were given according to the classfeature of samples (Table 3). Table 4 shows the classification results for samples withdifferent types of defects using the PLS-DA method. Four different types of defects wereimplemented in the model. It can be found that the average accuracy rates of the PLS-DAclassification model for the calibration and prediction set were 90.00% and 86.67%,respectively; the overall accuracy rates of the PLS-DA model in identifying the defect-freesamples of the calibration and prediction set were 98.33% and 96.67%, respectively;however, all the accuracies of samples with defects were less than 89.00%. It can beconcluded that the ability of the PLS-DA model to discriminate the defect-free samplesfrom the defected samples is feasible. Table 3. Category Variables for Four Types of Defects using PLS-DA Type of Defect Variable Values Live knots [1 0] Dead knots [0 1] Cracks [1 1] Defect-free [0 0] Table 4. Classification Results for Four Types of Defects 1ype otDefect Calibration Set Prediction Set Correct number Classificationaccuracy (%) Correct number Classification accuracy (%) Live knots 53 88.33 26 86.67 Dead knots 52 86.67 24 80.00 Cracks 52 86.67 25 83.33 Defect-free 59 98.33 29 96.67 Average 54 90.00 26 86.67 Results using LS-SVM for different types ofdefects The discrimination results are shown in Table 5. The LS-SVM model identified94.58%of the calibration samples correctly. For all samples in the prediction set, aprediction accuracy of 93.33% was obtained. Compared with the PLS-DA model, theperformance of the LS-SVM model was better. The experiments suggested that the LS-SVM model could be used to classify the samples with the mentioned types of defects (liveknots, dead knots, cracks, and defect-free). Table 5. Classification Results for Four Types of Defects using LS-SVM Type ofDefect Calibration Set Prediction Set Liveknots Deadknots Cracks Defect-tree Accuracy(%) Liveknots Deadknots Cracks Defect-free Accuracy(%) Liveknots 57 1 1 1 95 27 1 0 2 90 Deadknots 1 55 2 1 91.67 1 27 2 0 90 Cracks 1 2 56 1 93.33 1 1 28 0 93.33 Defect-free 1 0 0 59 98.33 0 0 0 30 100 Overallaccuracy(%) 94.58 93.33 Results using BPNN for different types ofdefects In building the BPNN model, the minimum learning rate was set at 0.1, while thethreshold residual error and the training time were set at 0.0001 and 1200 s, respectively.The discrimination results basedon BPNN are shown in Table 6. It was found that 97.92%of the samples in the calibration set were correctly identified, which was better than thoseobtained by both the PLS-DA model and LS-SVM model. Likewise, 97.50% of thesamples in the prediction set were correctly differentiated. For the samples in the prediction set, those from cracks and defect-free were correctly distinguished, but one sample in thelive knots was identified incorrectly and two were identified incorrectly in the dead knots. Table 6. Classification Results for Four Types of Defects using BPNN Type ofDefect Calibration Set Prediction Set Liveknots Deadknots Cracks Defect-tree Accuracy(%) Liveknots Deadknots Cracks Defect-free Accuracy(%) Liveknots 59 0 0 1 98.33 29 0 0 1 96.67 Deadknots 1 57 2 0 95 1 28 1 0 93.33 Cracks 0 1 59 0 98.33 0 0 30 0 100 Defect-free 0 0 0 60 100 0 0 0 30 100 Overallaccuracy%) 97.92 97.50 In comparison, the BPNN results were the best among the three models.Particularly, the identification rate of 97.50% for the prediction samples and theidentification rate of 97.92% for the calibration samples were higher than that obtained byboth the LS-SVM model and the PLS-DA model. These experiments showed that theBPNN model performed better and also demonstrated that NIR spectroscopy combinedwith BPNN and LS-SVM could be utilized to identify the defects on the surface of solidwood boards. CONCLUSIONS 1. Compared with the prediction results based on various models and pre-processingmethods, the combination of derivative and the Savitzky-Golay algorithm was mostcapable of pre-processing the original spectra of the samples. 2.Three pattern recognition methods, PLS-DA, BPNN, and LS-SVM, were used to builda model for the differentiation of defects on the surface of the solid wood board. Theresults indicated that the BPNN model performed better than both PLS-DA and LS-SVM, as shown by its respective classification accuracy. The classification accuracieswere 97.92% and 97.50% for the calibration set and the prediction set, respectively. 3.This research demonstrated that NIR spectroscopy in combination with BPNN and LS-SVM has the potential to detect and classify the different types of defects on the surfaceof the solid wood boards and offered a new approach to quickly distinguishing thedefects. While PLS-DA performed well in identifying the defect-free samples from thesamples with defects, the classification accuracy was of 98.33% and 96.67% forcalibration set and prediction set, respectively. 4Moreover, further studies are still needed to cover more types of defects on the surfaceof solid wood boards. Also, a more robust discrimination model for different kinds ofwood is desired. ACKNOWLEDGMENTS The authors are grateful for the support of the National Forestry Bureau of the 948Project (Grant No. 2015-4-52) and the support of the Fundamental Research Funds for theCentral Universities (Grant No.2572015AB14). REFERENCES CITED Baradit, E., Aedo, R., and Correa,J.(2006).“Knots detection in wood usingmicrowaves,”Journal of Wood Science and Technology 40(2), 118-123. DOI:10.1007/s00226-005-0027-8 Cristhian, A. C., Sanchez, R., and Baradit, E.(2008).“Detection of knots using X-raytomographies and deformable contours with simulated annealing,” Wood Research53(2),57-66. Danvind, J. (2002)“PLS prediction as a tool for modeling wood properties,”Holz alsRoh-und Werkstoff60(2),130-140.DOI: 10.1007/s00107-001-0271-z Eom, C. D., Park, J. H., Choi, I. G., Choi, J. W., Han, Y., and Yeo, H. (2013).“Determining surface emission coefficient ofwood using theoretical methods andnear-infrared spectroscopy,”Wood and Fiber Science 45(1), 76-83. Kabir, M. F., Schmoldt, D.L., Araman, P. A., Schafer, M. E., and Lee, S. M. (2003).“Classifying defects in pallet stringers by ultrasonic scanning,” Wood and FiberScience 35(3), 341-350. Ken, W., Isao, K., Shuetsu, S., Naohiro, K., and Shuichi,N. (2013).“Nondestructiveevaluation of drying stress level on wood surface using near-infrared spectroscopy,”Journal of Wood Science and Technology 47(2), 299-315. DOI: 10.1007/s00226-012-0492-9 Li, X. L., Yi, S. L., He, S. L., Lv, Q., Xie, R. J., Zheng, Y.Q., and Deng, L. (2016).“Identification of pummelo cultivars by using Vis/NIR spectra and patternrecognition methods,” Precision Agriculture 17(3), 365-374. DOI: 10.1007/s11119-015-9426-5 Nascimbem, L. B. L. R., Rubini, B. R., and Poppi, R.J. (2013).“Determination of qualityparameters in moist wood chips by near infrared spectroscopy combining PLS-DAand support vector machines,”Journal of Wood Chemistry and Technology 33(4),247-257.DOI: 10.1080/02773813.2013.783075 Rinnan, A., van den Berg, F., and Engelsen, S. B. (2009).“Review of the most commonpre-processing techniques for near-infrared spectra,” Trac-trends in AnalyticalChemistry 28(10), 1201-1222. DOI: 10.1016/j.trac.2009.07.007 Santos, A., Alves, A., Simoes, R., Pereira, H., Rodrigues, J., and Schwanninger, M.(2012).“Estimation of wood basic density of Acacia melanoxylon (R. Br.) by nearinfrared spectroscopy,”Journal of Near Infrared Spectroscopy 20(2), 267-274. DOI:10.1255/jnirs.386 Suykens,J. A. K., Gestel, T. V., Brabanter,J. D., Moor,B., and Vandewalle,J. (2002).Least Squares Support Vector Machines, World Scientific, Singapore. Takizawa, K., Nakano, K., Ohashi,S., Yoshizawa, H., Wang, J., and Sasaki, Y. (2014).“Development of nondestructive technique for detecting internal defects in Japaneseradishes,”Journal ofFood Engineering 126, 43-47. DOI:10.1016/j.jfoodeng.2013.10.041 PEER-REVIEWED ARTICLEbioresources.com Todorovic, N., Popovic, Z., and Milic, G. (2015).“Estimation of quality of thermallymodified beech wood with red heartwood by FT-NIR spectroscopy,”Journal ofWood Science and Technology 49(3), 527-549.DOI: 10.1007/s00226-015-0710-3 Yang, Z., Lv, B., and Fu, Y. J. (2012).“The relationship between near infraredspectroscopy and surface color of eight rosewoods,” Advanced Materials Research479-481,1772-1776. DOI: 10.4028/www.scientific.net/AMR.479-481.1772 Yang, Z., Zhang, M. M., Li, K., and Chen, L. (2016). “Rapid detection of knot defects onwood surface by near infrared spectroscopy coupled with partial least squaresdiscriminant analysis,”BioResources 11(1),2557-2567.DOI:10.15376/biores.11.1.2557-2567 Zhang, M. M., Liu, Y. N., and Yang, Z. (2015).“Correlation of near infraredspectroscopy measurements with the surface roughness of wood,”BioResources10(4),8505-8517.DOI: 10.15376/biores.10.4.8505-8517 Zhu, X. H., Fang, L. J., Gu, J. S., and Guo, W. C. (2016).“Feasibility investigation ondetermining soluble solids content of peaches using dielectric,”Food AnalyticalMethods 9(6), 1789-1798. DOI: 10.1007/s12161-015-0348-7 Article submitted: September 4, 2016; Peer review completed: October 22, 2016; Revisedversion received and accepted: October 27,2016; Published: November 2, 2016.DOI: 10.15376/biores.12.1.19-28 iang et al. (.“NIR for board defects,”BioResources , 近红外光谱学(NIR)在实木板材表面缺陷检测的潜力,近红外光谱在对木材进行检测时,近红外光谱通过化学计量方法建立木材光谱与木材性质直接的相关关系,从而实现对木材性质的定性分析,国内外已经有一些使用近红外光谱NIR对木材的物理性质和化学性质的研究。
关闭-
1/10
-
2/10
还剩8页未读,是否继续阅读?
继续免费阅读全文产品配置单
上海昊量光电设备有限公司为您提供《实木板材中表面缺陷检测方案(红外光谱仪)》,该方案主要用于木材/板材中表面缺陷检测,参考标准《暂无》,《实木板材中表面缺陷检测方案(红外光谱仪)》用到的仪器有null。
我要纠错
相关方案
 咨询
咨询