喷雾中IMI液滴粒径测量,PLIF测量,粒径,速度,质量密度检测方案(激光粒度仪)
检测样品 其他
检测项目 IMI液滴粒径测量,PLIF测量,粒径,速度,质量密度

 金牌会员
752 篇解决方案
金牌会员
752 篇解决方案
方案详情文
智能文字提取功能测试中
37 38 J. Fluid Mech. (2018), vol. 846, pp. 37-81. C Cambridge University Press 2018This is an Open Access article, distributed under the terms of the Creative Commons Attributionlicence (http://creativecommons.org/licenses/by/4.0/), which permits unrestricted re-use, distribution, andreproduction in any medium, provided the original work is properly cited.doi:10.1017/jfm.2018.247 Interaction of droplet dispersion andevaporation in a polydispersed spray S. Sahult, Y. Hardalupas and A. M. K. P. Taylor² 'Department of Mechanical Engineering, IIT Madras, Chennai, 600036, India Department of Mechanical Engineering, Imperial College London, London SW7 2AZ, UK (Received 5 February 2017; revised 8 December 2017; accepted 15 March 2018;first published online 3 May 2018) The interaction between droplet dispersion and evaporation in an acetoneevapcrating under ambient conditions is eexxppeerriimmeennttalallyly studied with an aim tounderstand the physics behind the spatial correlation between the local vapour massfraction and droplets. The influence of gas-phase turbulence and droplet-gas slipvelocity of such correlations is examined, while the focus is on the consequence ofdroplet clustering on collective evaporation of droplet clouds. Simultaneous and planarmeasurements of droplet size, velocity and number density, and vapour mass fractionaround the droplets, were obtained by combining the interferometric laser imagingfor droplet sizing and planar laser induced fluorescence techniques (Sahu et al., Exp.Fluids, vol. 55, 1673, 2014b, pp. 1-21). Comparison with droplet measurements ina non-evaporating water spray under the same flow conditions showed that dropletevaporation leads to higher fluctuations of droplet number densityand velocityrelative to the respective mean values. While the mean droplet-gas slip velocitywas found to be negligibly small, the vaporization Damkohler number (Da,) wasapproximately ‘one’, which means the droplet evaporation time and the characteristictime scale of large eddies are of the same order. Thus, the influence of the convectiveeffect on droplet evaporation is not expected to be significant in comparison tothe instantaneous fluctuations of slip velocity, which refers to the direct effect ofturbulence. An overall linearly increasing trend was observed in the scatter plot ofthe instantaneous values of droplet number density (N) and vapour mass fraction (Yr).Accordingly, the correlation coefficient of fluctuations of vapour mass fraction anddroplet number density (Rn*y) was relatively high (~0.5) implying moderately highcorrelation. However, considerable spread of the N versus Yp scatter plot along bothcoordinates demonstrated the influence on droplet evaporation due to turbulent dropletdispersion, which leads to droplet clustering. The presence of droplet clustering wasconfirmed by the measurement of spatial correlation coefficient of the fluctuationsof droplet number density for different size classes (Rn*n) and the radial distributionfunction (RDF) of the droplets. Also, the tendency of the droplets to form clusters washigher for the acetone spray than the water spray, indicating that droplet evaporationpromoted droplet grouping in the spray. The instantaneous group evaporation number(G) was evaluated from the measured length scale of droplet clusters (by the RDF)and the average droplet size and spacing in instantaneous clusters. The mean value of S. Sahu, Y. Hardalupas and A. M. K. P. Taylor G suggests an internal group evaporation mode of the droplet clouds near the spraycentre, while single droplet evaporation prevails near the spray boundary. However, thelarge fluctuations in the magnitude of instantaneous values of G at all measurementlocations implied temporal variations in the mode of droplet cloud evaporation. Key words: drops, multiphase and particle-laden flows, turbulent mixing 1.Introduction 1.1. Motivation and background Droplet dispersion, vaporization and fuel-air mixing are crucial stages in combustionof liquid fuel sprays in many industrial applications, such as internal combustionengines, gas turbines and rocket engines, and their understanding is central to optimalperformance of these devices and for reduction of pollutant emissions. The dropletvaporization rate is the controlling factor for combustion, since vaporization canbe the slowest process determining the overall burning rate (Sirignano1999). Theeither by directly modifying mass and heat transfer or indirectly through dropletdispersion. While the dispersion of droplets can strongly affect droplet vaporizationrate, interestingly, strong evaporation may cause time-varying response of the samedroplets to carrier-phase velocity fluctuations affecting dispersion. Thus, the mutuallycoupled phenomena of droplet evaporation, carrier-phase turbulence and macro-scaledroplet dispersion govern the micro-scale fuel-air mixing in an evaporating liquidfuel spray. Although there are additional parameters influencing droplet evaporationin complex spray combustion processes, comprehending non-reacting and evaporatingflows constitutes a first step. Hence, the understanding of the physics of the interactionbetween droplet and vapour phases in a polydispersed evaporating spray is the goalof the present paper. The dispersion of droplets or particles embedded in turbulent flows is a majorresearch field in the two-phase flow community. The studies concerning non-evaporating droplets1998turbulence by particles (Squires & Eaton 1990; Boivin, Simonin & Squires l1998:Sun m & Collins 1999; Ferrante & Elghobashi 2003; Sahu, Hardalupas & Taylor2014a, among others) and/or particle dispersion resulting in preferential accumulationof particles or clustering (Wang & Maxeyy1993; Fessler, Kulick & Eaton 1994;Wood,Hwang & Eaton2005; Monchaux, Bourgoin & Cartellier 2012; Sahu, Hardalupas& Taylor 2016, among others). Studies concerning droplet evaporation in turbulentflows are mostly based on two-phase simulations (for example, Reveillon & Vervisch2000; Colin & Benkenida 2003; Patel et al. 2007; Reveillon & Demoulin 2007;Apte, Mahesh & Moin 2009; Xia & Luo2009; Jones, Lyra & Marquis2010, toname a few). Relatively few experimental studies of evaporative sprays have beendocumented (for instance, Yule1983; Sommerfeld & Qui11998; Nijdam, Starner& Langr,irisshh 2004; Chen, Starner & Masri2006; Cochet et al. 2009). Although theabove studies significantly improved our understanding of droplet evaporation andmixing, the influence of turbulent droplet dispersion on droplet evaporation is notwell understood, which is mainly due to availability of only limited experimentaldata to evaluate the assumptions of theoretical models ;a and resulting simulations. In the literature, data on dispersed phase properties (size, velocity etc.), dropletdispersion due to turbulence and mean vapour mass fraction are available mostly forevaporating-droplet-laden turbulent jets and, to a lesser extent, for sprays. However,the link between the spatial distribution of the source of vapour and the fluctuationsof vapour mass fraction and its consequence on droplet evaporation have been rarelyconsidered, although it is highly relevant to modelling droplet evaporation in turbulentflows. One of the main input parameters of any non-premixed turbulent combustionmodel (for instance, Reynolds-averaged Navier-Stokes (RANS) calculations or largeeddy simulation (LES)) is the mixture fraction variable (Z), such that the properties ofmixing are characterized with the mean, variance and dissipation rate of the mixturefraction. However, due to the local sources of fuel during droplet vaporization, Zis not a conserved scalar, which results in additional unclosed source terms in thetransport equations for the mean and variance of Z (Reveillon & Vervisch2000),summarized as follows: (1.2) Here, the upper-case and lower-case letters refer respectively to instantaneous andfluctuating quantities for gas velocity (U) and vapour mixture fraction (Z). The irefers to the component of the Cartesian reference system. The overbar denotes timeaveraging. p and D, are the air density and mass diffusivity of fuel vapour in air. Theterm pM, is the Eulerian vaporization rate, which is defined over a control volume(V) corresponding to the ‘subgrid’description for the spray, and given by where N(D) is the droplet number density and m, (D) is the droplet evaporation rateof size D, and the summation refers to all droplets in a control volume V. Theterms containing correlations between fluctuations of mixture fraction and Eulerianvaporization rate andgas-phase velocity must be experimentally determined. Fora non-reacting and evaporating spray, such correlation terms can be interpreted asthe relation between vapour mass fraction, droplet number density and gas velocity,a ave significance not only in modelling but also for quantifying the roleinstantaneous droplet clusteringon droplet evaporation, as explained later. Moreover,for polydispersed sprays, those correlation terms should be determined conditional ondroplet size. However, experimental reports on such quantities are non-existent. It should be noted that in order to solve equations (1.1) and (1.2), the evaporationrate of individual droplets appearing in (1.3) is commonly modelled according tothe classical d-law (the square of the droplet diameter varies linearly with time(Spalding1951)) or its variants (Miller, Harstad & Bellan 1998). This simple modelconsiders diffusion-controlled evaporation of a single isolated droplet. The effect offorced convection is usually accounted for using the correlations by Ranz & Marshall(1998). However, one of the key assumptions of the model is that the liquid properties S. Sahu, Y.Hardalupas and A. M. K. P. Taylor at the droplet surface (regression rate, temperature, species concentration) change atrates much slower than those of the gas-phase transport processes. As per the d-law,the evaporation rate of a droplet in a turbulent flow field is expressed as where Sh and B are the convective Sherwood number and the Spalding transfernumber, respectively. The transfer number is expressed as B=(Y,-Y)/(1 -Y),where Y, is the vapour mass fraction at the droplet surface, which is usually assumedto be at saturation state corresponding to droplet temperature, and Y is the vapourmass fraction far away from the droplet. However, the appropriate location (withrespect to the droplet surface) for defining Y。 is debatable and usually Y. isconsidered to be a constant or sometimes‘zero’. In reality the mass fraction ofvapour away from a droplet need not be ‘zero’and it may be even a time-varyingquantity. However, many simulations consider a constant value for B. Also, the dropletvaporization rate is strongly affected due to the presence of neighbouring dropletsand so may not be accurately described by the d-law, i.e. the regression rate of thedroplet surface may vary nonlinearly with time. For instance, in their experimentsstudying the evaporation and mixing processes in a dense spray plume, Rivas &Villermaux (2016) and Villermaux et al. (2017) demonstrated that the lifetime of anindividual droplet embedded in a cloud of droplets is much larger than predicted bythe conventional d-law for a single drop evaporating in a quiescent environment.In a turbulent spray, due to the wide range of the droplet size distribution insprays, different dynamic behaviour of droplet dispersion and interaction with thesurrounding gas leads to formation of instantaneous clusters of droplets in sprays(Zimmer et al. 2003; Lian, Charalampous & Hardalupas 2013). Droplet clusteringcan lead to substantial increase in the instantaneous local droplet concentration abovethe mean value, which causes the inter-droplet spacing to become sufficiently smallso that interaction between neighbouring droplets prevents the penetration of oxidizer.Consequently, a fuel-rich mixture is formed in which droplets neither evaporate norburn individually, but rather in a group. Chiu & coworkers (Chiu & Liu 1977; Chiu,Kim & Croke 1982; Chiu & Kim 1983) characterized this phenomenon by the groupcombustion number, G, which represents the ratio between the characteristic dropletevaporation rate and the molecular inward diffusion rate of oxygen. The magnitudeof G has been shown to have a profound effect on flame location and distributionsof temperature, fuel vapour and oxygen. However, the experimental quantification ofthe magnitude of G is limited in the literature (see Akamatsu et al. 1996; Chen &Gomez 1997; Sornek & Dobashi 2000). In (1.4), the Sherwood number depends onthe Reynolds number (Re) of the droplet such that Re=p|Ug-U|D/u, where uis the dynamic viscosity of air. Ug -U is the instantaneous local droplet-gas slipvelocity, which, although it markedly influences the droplet evaporation rate, has beenseldom addressed in the past. Important issues, such as alignment of instantaneousvapour clouds with droplet clusters and the role of slip velocity on the correlationbetween droplets and neighbouring vapour mass fraction, remain to be addressed. The above discussion suggests the critical role of experiments to evaluate models forevaporative sprays and also to further explore the two-phase interaction mechanisms.However, the lack of experimental data in this area can be attributed to the challengesencountered in measurement of the dispersed and vapour phases in evaporativesprays. Also, both phases must be simultaneously measured, as required for thequantification of the correlation terms(as d(escribed before)and their relation to the local group combustion number. Considering the complexities involved inspray combustion, usually idealized sprays are studied to minimize the couplingbetween the different effects and to provide parametric results. In this paper, weconsider an acetone spray evaporating under ambient atmospheric and non-reactingconditions. Even this :apparently simplified configuration poses tough challengesfor simultaneous measurements of droplet and vapour phases. In the past, the phaseDoppler anemometer (PDA) has been used extensively to measure the dispersed phase(for instance, Hardalupas, Taylor & Whitelaw1990; Hardalupas, Taylor & Whitelaw1994; Sornek, Dobashi & Hirano2000; Nijdam et al. 2004; Chen et al.22006),while planar laser induced fluorescence (PLIF) is usually used for droplet vapourconcentration measurements (Bazile & Stepowski1995; Ritchie & Seitzman2001:Cochet et al.2009). However, for a single particle counter type instrument like thePDA, measurement of instantaneous inter-droplet distance and droplet number densityis not straightforward, and also, correlating the single point information of dropletproperties with planar measurement of vapour concentration by PLIF is complicated(e.g. Ferrand, Bazile & Boree 2001). In the present work we use a novel approachof combining the ILIDS (interferometric laser imaging for droplet sizing) and PLIFtechniques, as developed by Sahu, Hardalupas & Taylor (2014b), for simultaneousdroplet and vapour-phase measurements in evaporative sprays. While ILIDS providesinstantaneous planar measurements of spatial distributions of individual droplet size,velocity and number density in the spray, the instantaneousvapour mass fractionaround the droplets is simultaneously measured by PLIF. 1.2. Scope of the present paper In this paper we attempt to address some questions of fundamental importance: Canwe correlate the instantaneous local vapour mass fraction within a fuel spray to thedroplet number density at that instant? What factors influence this correlation? Earlierstudies on isolated droplet evaporation suggest that the air turbulence always increasesthe droplet evaporation rate. Should this be true for droplets in sprays as well? Howdoes preferential segregation of droplets due to clustering affect their evaporationrate? Is there a way to quantify this effect? Accordingly, the objectives of the paperare to (i) quantify the interaction between droplet and vapour phasesa八 in a spray andinvestigate the role of droplet-gas slip velocity and gas phase turbulence on dropletevaporation, (ii) investigate the consequence of droplet dispersion (due to interactionwith the surrounding turbulent air flow) on droplet evaporation, (iii) study the effectof droplet cloud formation due to turbulence in sprays on droplet evaporation, incomparison to isolated droplet evaporation, and quantify the group evaporationnumber and its fluctuations at different radial locations within the spray. The dropletand vapour phases are simultaneously characterized by application of the combinedILIDS and PLIF techniques to an evaporating acetone spray. The measurement regionis situated 350 mm below the atomizer, where strong interaction of the droplets withthe entrained air flow is expected and the memory of the liquid break-up processesduring the atomization is no longer influential. The measurement areas correspond tofour different radial locations beginning from the spray axis. Apart from presentingthe results, including basic statistical quantities (e.g. mean and standard deviation ofdroplet size, velocity and vapour mass fraction), the correlations between vapour massfraction and droplet number density and droplet velocity are presented conditional ondroplet size classes for the first time. Measurement of such statistics is vital for furtherunderstanding of the underlying physics of the two-phase interaction mechanisms, and also useful for developing models for the unclosed terms in (1.1) and (1.2). Theinstantaneous group evaporation number (G) of the droplets is quantified from themeasurements, and its link with the above correlations is established to understand theprevailing modes of group evaporation in the spray. The next section (82) describesthe experimental arrangement and measurement techniques used in this study. Theresults are presented in 83. The mean and fluctuating characteristics of the twophases are presented in $3.2 and the results of the measurements of specified spatialcorrelations are discussed in $3.3, together with the measured group evaporationnumber. A summary of the main findings can be found in 4. 2. Experimental arrangement The principle of combining the optical arrangements of ILIDS with PLIF hasbeen described by Sahu et al. (2014b). They also demonstrated the application ofthe combined technique to two-phase measurements in an evaporating polydispersedspray. A brief summary is presented here for completeness. The ILIDS technique is based on detecting the reflected and the first-order refractedlight scattered from a droplet illuminated by a laser sheet, which, at a specific forwardscattering angle, interfere to produce equally spaced parallel fringes on a defocusedplane (Glover, Skippon & Boyle 1995). The characteristic interferogram is observedwith a far-field arrangement of receiving optics (Kawaguchi, Akasaka & Maeda 2002).The number of fringes present in each of the recorded fringe patterns is proportionalto the droplet diameter. The droplet velocity is obtained by tracking the same dropleton two sequential ILIDS images, captured with a small and finite time interval. For thepurpose of characterizing simultaneously vapour distribution around individual dropletsusing the PLIF technique, both phases are imaged on the focused plane. With thisoptical system, a droplet is imaged as a rectangular region with a superimposed fringepattern on the ILIDS camera and the corresponding liquid fluorescence appears on thePLIF image, which also contains the fluorescence from droplet vapour. The dropletpositions obtained through ILIDS can be used to detect the corresponding droplets onthe PLIF image so that the droplet size/velocity (from ILIDS) is associated with thedroplet positions on the PLIF image. The contribution of liquid fluorescence due todroplets is filtered out from the PLIF image and the resulting image is processed toobtain vapour concentration. Thus, simultaneous planar measurement of both dropletand vapour phases in evaporative sprays is achieved. 2.1. Flow and optical arrangement Experiments are conducted with an air-assist internal mixing type nozzle (SprayingSystem Co. 1/4J series) producing a solid cone spray at ambient conditions, as shownin figure 1. Liquid acetone, pressurized at 1.2 bar in a pressure vessel, was fed tothe nozzle through stainless steel tubes. Both air and water streams enter the injectorfrom opposite sides, which mix within a fluid cap before being ejected from a singlehole of size 1.2 mm. The flow rates of liquid acetone and air were controlled bythe respective rotameters and were set to 0.03 and 15 1 min, respectively. Due tothe high vapour pre1..ssure of pure acetone, the liquid droplets begin to evaporate soonafter injection, while interacting with the ambient air. Hence, it is simple to recreatethe high evaporation rates of fuel spray without complicated heating arrangements.Also, there is no need to seed an additive into the liquid to track the vapour phase.The fluorescence signal from acetone has low dependence on the ambient pressureand temperature. This choice of fluorescent marker allows for adaptability to various Interaction of droplet dispersion and evaporation U Measurement area:8 mm x 12 mm (b) FIGURE1.(Colour online) Schematic of the experimental arrangementandlaserinstrumentation: (a) elevation view and (b) plan view. operating conditions and helps to avoid the complex correction in the evaluation of thevapour concentration from the magnitude of the measured fluorescent signal (Thurberet al. 1998). The two-phase measurements were performed 350 mm downstream ofthe nozzle exit (figure 1a), which represents an axial station at around 250 timesthe atomizer nozzle diameter. In this way, significant evaporation has occurred andvapour-air mixing is expected to be higher than at the near nozzle region. Thecorresponding width of the spray at this location was approximately 100 mm. Fourradial measurement locations were considered, beginning from the nozzle axis towardsthe outer spray at R=0, 15, 30 and 45 mm, where R refers to the beginning of themeasurement area measured from the nozzle axis. More details of the experimentalarrangement can be found in Sahu (2011) and Sahu et al. (2014b). We note that we have considered alternative approaches for the injection of theliquid phase such as mono-sized droplet injection using an in-house droplet generator(Pergamalis 2002). However, such an approach has some disadvantages, as describedin the following. (i) Usually, mono-disperse droplet generators tendtogenerate droplets with sizes much larger in comparison to the average droplet size in a typicalspray for combustion applications. Such droplet sizes result in long evaporation timesand the droplets must have long residence times in a flow, in order to observe asignificant change of the droplet diameter due to evaporation. This means that theentrained air flow within the mono-dispersed droplet stream will dilute the smallamount of vapour quickly and the interaction between air flow and dropletsislimited to individual droplet evaporation. (ii) When such droplets travel over longerdistances they start colliding and generating new droplet sizes. The initial narroy)Wsize range of the mono-sized droplets becomes wider at different parts of the flowand it is difficult to evaluate the origin of the droplet sizes and the contribution ofthe droplet evaporation to the measured droplet sizes (Orain & Hardalupas22014).(iii) In an evaporative spray, a local vapour concentration distribution can surroundlarger droplets and affect the physics of evaporation. This would not nbot be presentif mono-disperse droplet streams were used. Therefore, given our past experiencewith various types of experiments with mono-dispersed droplet generators and aftercareful consideration, we decided to use a commercial atomizer which produces apolydispersed droplet size distribution that is typical to injectors used in severalcombustion applications, and can be quantified without evaporation, and we use thisas a reference to evaluate the evolution of the evaporation rate in the spray. However,it is also noted that, earlier, droplet evaporation experiments in sprays with nearlymono-sized droplets (around 10 um) have been reported (for instance, see Rivas& Villermaux2016). Use of such sprays has some advantages, since it allows forwell-defined boundary conditions for droplet sizes to assist comparison with spraysimulations. However, this work is limited to very small droplet sizes, which followthe fluid flow turbulence fairly well, and therefore do not include effects related to theformation of droplet clusters due to interaction with flow turbulence and simultaneousvariations due to droplet size. This forms the emphasis of the current research, whichextends the above study to polydispersed sprays. The optical arrangement of the combined technique is shown in figure 1(b). Formeasurementsby' ILIDS, the flow field is3:illuminated by a frequency-doubled,double pulse Nd:YAG laser (120 mJ pulse aat wavelength 入 = 532 nm; beamdiameter 5 mm; 5 ns pulse width; New Wave Research), denoted as Laser 1. ForPLIF measurement, acetone droplets and vapour were excited by a fourth harmonicgenerator, single-pulse Nd:YAG laser (100 mJ pulse-1at 1=266 nm; beam diameter10 mm; 5 ns pulse width; Continuum), denoted as Laser 2. Using a pair of concaveand convex cylindrical lenses (f=-25 and +75 mm), the green laser beam wasexpanded to 15 mm in the vertical direction. Then, the two beams were combinedusing a beam combiner (25×36 mm; 95 % transmittance for green light and 99.9%reflectance for UV). Utmost care was taken to ensure both beam axes were collinearand parallel to the optical bench. Both laser sheets were focused at the measurementregion using a cylindrical convex lens (fused silica;f=+400 mm). The dimensions(height and waist) of the laser sheets at the measurement location were approximately15 and 1 mm for =532 nm beam and 10 and1 mm for the 入=266 nm beam.respectively. Acetone absorbs the UV light at 266 nm and emits fluorescence whichhas a spectrum in the range 350-550 nm with the peak around 435 nm, while thedroplets scatter light at 532 nm without absorbing it. The wavelengths of fluorescentand scattered light are separated by using appropriate optical filters. The scattered light was collected through Lens 1 (135 mm; f/2.8 Nikon lens) alongwith a suitable band-pass optical filter (532 nm; 3 nm bandwidth) to restrict thefluorescence signal from the droplets at wavelength around 435 nm. The images were captured through Camera 1 (PCO; Sensicam QE, 12 bit, 1040×1376 pixels),set at an angle of 0 = 70°, which is the optimum forward scattering angle for arefractive index of 1.35 (acetone in air) for sizing of acetone droplets by ILIDSwith vertically polarized light. The Scheimpflug condition was maintained to ensureuniform defocusing at Camera 1. The defocusing was achieved by a pair of cylindricallenses (+50 and -50 mm focal length). A rectangular aperture (4x40 mm²) wasplaced right in front of the collecting lens of Camera 1 to adjust the collectingangle and enhance the depth of focus. The collecting angle (a) was set to 7.15°,centred around the main angle of camera orientation, resulting in resolution of4.70um fringe for the ILIDS system. The depth of focus for the ILIDS settingwas approximately 0.2 mm which is much smaller than the laser sheet thickness:however, for the ILIDS technique, the droplet images are defocused anyway. Thefluorescent intensities were collected through Lens 2 (105 mm f/4 Nikon lens) witha suitable band-pass filter (260-490 nm) to restrict the scattered light from dropletsat 532 nm. The lens, being made of BK7 glass, could absorb the scattered UV lightat 266 nm. The fluorescent light was imaged by Camera 2 (PCO; Sensicam QE,12 bit, 1040 ×1376 pixels), coupled to a gated intensifier (IRO image intensifierwith PCO; LaVision). Because of the unavailability of a suitable Scheimpflug mountfor Camera 2, the Scheimpflug condition could not be incorporated. So, Camera 2could not be aligned at the same scattering angle 0 similar to Camera 1. Thus, asshown in figure 1, Camera 2 was placed at a right angle to the laser sheet, on thesame side of the laser sheet as Camera 1. The depth of focus was approximately0.9 mm for the PLIF camera setting, which is slightly less than the thickness of thelaser sheet (1mm). The lasers, cameras and intensifier were synchronously operatedusing LaVision DaVis software and a digital delay generator (DG 535; StanfordResearch Systems). The triggering and timing of Camera 1 and Camera 2 (via theintensifier) were made synchronous with the respective laser pulses, so that the PLIFimage was captured at the same time as the first of the two ILIDS images. For bothcameras, the field of view was approximately 8 ×12 mm, with magnification ofapproximately 0.7 in both horizontal and vertical directions. For each measurementlocation, 2000 image pairs were captured through each of the cameras. The repetitionrate of the laser was set to 5 Hz, so that the acquired images remained statisticallyindependent. In order to examine the effect of evaporation on droplet properties, comparisonwith a non-evaporative spray was essential. Hence, experiments were performed witha water spray under the same operating conditions of liquid and air flow rates, andat the same measurement locations as for the acetone spray. Although at the ambienttemperature of 15°C the surface tension of water is approximately three times greaterthan that of acetone, for the considered experimental regime in the spray, the dropletsize can be considered to be independent of the surface tension due to the high valueof Weber number at the nozzle exit. A three-dimensional traversing frame mechanism was31used to mount the wholeoptical assembly including the laser, laser sheet optics, cameras and lenses. This wasmechanically isolated from the rig, which consists of an aluminium frame containingan air assist nozzle producing a solid cone spray. Measurements at various locationsin the spray could be obtained by traversing the frame mechanism to the desiredpositions. At any given measurement location, the notations ‘x’and ‘y’refer to the localaxial and radial directions respectively, both lying in the plane of the laser sheet.The upper-case leltetters denote an instantaneous quantity, while lower-case lettersdenote the corresponding instantaneous fluctuations from the average. For instance, S. Sahu, Y. Hardalupas and A. M. K. P. Taylor Step 3 FIGURE 2. (Colour online) Illustration of the image processing details of the combinedILIDS and PLIF technique. In the plot of simultaneous droplet size and velocity, andcontours of vapour mass fraction, the circles represent droplets and the associated boldvectors represent droplet velocity. The scales for the droplet size and contour plots aredifferent. instantaneous velocities in the ‘x’and ‘y'directions are denoted by ‘U’and‘V’andvelocity fluctuations by ‘u’ and‘u’respectively. Similarly, ‘Y’and y’refer to theinstantaneousvapour mamsass f rIaction and its fluctuations, respectively. Ann ‘overbar'over any quantity indicates time-averaging and the subscript ‘r’ denotes the rootmean square (r.m.s.) of that quantity. 2.2. Image processing The algorithm for image processing is illustrated for a pair of ILIDS and PIV imagesin figure 2. The details can be found in Sahu et al. (2014b). The image processing procedure for droplet size and velocity measurements byILIDS is elaborated in Sahu (2011). For the present case, since the scattering intensityof the vapour is much smaller than that of the droplets, the effect of the vapour wasto create a low-intensity background noise on the defocused ILIDS image, which wasnot significant. The minimum measurable droplet size by ILIDS was 15 um, whichis obtained as a trade-off between the object distance of the collecting lens and sizeof the measurement area. The PLIF image contains fluorescence from the liquid droplets as well as the vapourphase. To suppress the high-frequency signal (noise) in the PLIF image, the intensity For quantitative evaluation of vapour concentration in the droplet-filtered PLIFimage, the raw fluorescence images were corrected for background luminosity andvariations in the laser sheet intensity profile, and finally the fluorescent intensity wasconverted to vapour concentration using a systematic calibration with the saturatedvapour concentration (due to liquid acetone partially filled in a cuvette with its lidsecurely fixed at the top) corresponding to an ambient temperature of 15°C. Theacetone vapour mass fraction was computed from the vapour concentration values byassuming ideal gas behaviour of the vapour-air mixture. Since the absorption of laserenergy due to droplets and vapour was low (3-15% at different radial locations R=0to 45 mm with the larger absorption corresponding to inner radial locations) at theconsidered measurement locations, the corresponding corrections were not taken intoaccount in the vapour mass fraction estimation. Also, since the fluorescence lifetimeof acetone vapour is very short (around 2.4 ns) and, at atmospheric pressure, thefluorescence remains almost unaffected by quenching (Thurber & Hanson 1999), thequenching correction for processing the acetone LIF images was not necessary. Asimilar approach has been taken earlier by other researchers, for example, Bazile &Stepowski (1995). In order to identify the same droplet on ILIDS and PLIF images, the positionsof the centre of the detected droplets in both images were, respectively, projectedon to the object plane (plane of laser sheet) using the calibration constants, andthe right pairs of droplet fringe pattern and the corresponding droplet fluorescencewere searched. For this purpose, the position of the droplet centres by ILIDS wascorrected for ‘centre discrepancy’originating because of the defocusing performedin the ILIDS technique (Hardalupas et al. 2010). We adopt a method similar toHardalupas et al. (2010) to quantify and minimize the positioning error. Finally,droplet size/velocity from ILIDS were assigned to the position of the same dropletson the PLIF image. Thus, simultaneous two-phase measurements were obtained inthe evaporative spray. Figure 2 shows an example of instantaneous contour plots ofacetone vapour mass fraction superimposed with size and velocity vectors of thedroplets measured simultaneously with the combined techniques. Weshouldmention here that the droplet concentrationor number densitymeasurements in the spray were obtained using the ILIDS images. It is not possibleto validate all the droplets which appear on the ILIDS image (due to the criteriaimposed by image processing). However, in any instantaneous image the validationprocedure of the image processing did not reject preferentially some droplet sizes.Therefore, the relative droplet number counts of different size classes remain thesame compared to the case when all droplets in an image were considered. Thedroplet concentration was measured by counting the number of detected droplets inthe ILIDS image, which correspond to a volume of 8 ×12×1 mm’ in the presentcase (thickness of the laser sheet=1 mm). Before discussing the results relevant to the study of the interaction betweenthe droplet and vapour phases, the basic statistics for each phases are presenseparately for reference purposes. Some of these results are as expected, for example,radial variation of mean droplet number density, mean droplet velocity, vapour massfraction etc., as should be the case in a flow with appropriate initial conditions.However, quantitative differences exist between the results for water and acetonesprays, radial variation of fluctuations of different quantities etc., whicharenoteasily anticipated. Similarly, although the droplet-gas slip velocity is expected tobe higher for droplets of larger size class, the probability of the normalized slipvelocity quantifies the significance of the slip velocity with respect to mean dropletvelocity. The identification of the presence of droplet clustering in the spray andthe quantification of its magnitude based on statistical descriptions are also noteasily anticipated and are not commonly considered in the numerical modellingof evaporating sprays. We have selected a typical spray that is common in manyapplications, including combustion, and we have characterized it in order to be ableto use this information as a reference. 3. Results and discussion 3.1. Droplet size Figure 3 shows the probability of the droplet size distribution at locations R=0(central spray) and 45Dmpm (spray edge) for the acetone and theSimilar size distributions of droplets (15-100 um) were observedmeasurement locations. The statistical analysis is presented for three different dropletsize classes, namely, 15-30 um, 30-45 um and 45-60 um. A width of each sizeclass of AD= 15 um was selected as a compromise between higher statisticaluncertainty (with smaller AD) and obtaining size-averaged information (with larger Droplet size (um) FIGURE 3. (Colour online) Probability of droplet size for the acetone and the water spraysat the radial locations (a) R=0 mm and (b) R=45 mm. AD). Figure 4(a) compares the probability of the three droplet size classes at differentmeasurement locations for both sprays. It can be observed that the small droplets ofsize 15-30 um dominate the droplet size distribution for all locations in the spray. Forthe water spray, the probability of 15-30 um droplets increases slightly away fromthe spray axis due to radial transport of the smaller droplets, although the probabilityof other size classes remains almost invariant at different spray locations. The Sautermeandiameter (SMD) was selectedas a representative diameter to evaluate thebehaviour of the size distribution: i=1 where ‘D’represents diameter of i’th identified droplet in an ILIDS image andnr is the total droplet number count for all images. The SMD provides the ratio S. Sahu, Y. Hardalupas and A. M. K. P. Taylor R (mm) FIGURE 4. (Colour online) (a) Comparison of probability of the three droplet size classes,and (b) variation of droplet SMD for different measurement locations for the acetone andthe water sprays. of the liquid volume over the surface area of the droplets, which is important forevaporation. Considering the accuracy of the droplet size measurement for the presentcase(approximately ±3 um), the SMD is considered to be constant acrossthewater spray at the measurement plane of 350 mm from the nozzle exit, as shownin figure 4(b). From figure 3(a), it can be observed that near the central location ofthe acetone spray, the probability of larger droplets (≥45 um) is almost the same asthat for water droplets and, while the probability of droplets of approximately 30 umreduces, more smaller droplets of approximately 20 pm appear in comparison to thewater spray. Hence, the SMDs of the two sprays are nearly same at the locationR=0 mm. However, away from the spray axis, the probability of 15-30 um dropletsincreases in comparison to the water spray, while that of larger droplet size classesdecreases (see figure 3b), thus the SMD is smaller towards the edge of the spray.This is attributed to evaporation of acetone droplets since radial transport of smaller droplets away from the spray axis is not more significant in the evaporative sprayowing to much smaller droplet radial velocity in comparison to the water spray. It should be noted that comparison of SMD between acetone and water sprays isnot sufficient to draw conclusions on the extent of evaporation at any measurementlocation. Thisis because, the SMD isdetermined by the droplet probabilitydistribution, which may not be altered due to evaporation as, for example, dropletsin the central spray region have nearly the same probability as the three dropletsize classes for water and acetone sprays (figure 4a). However, the overall reductionof SMD for the acetone spray in figure 4(b) is, as expected, caused by dropletevaporation. The extent of evaporation at any measurement location depends on twofactors, namely the droplet evaporation rate and the number density of droplets. Theevaporation rate of a droplet in turn depends on the droplet size, velocity and vapourmass fraction around the droplet, although the latter may be significantly influencedby the number of neighbouring droplets present. Thus, knowledge of droplet numberdensity, droplet velocity and vapour mass fraction are also essential, and are presentedbelow. 3.2. Mean and fluctuations of properties of droplet and vapour phases 3.2.1. Droplet number density Figure 5(a) shows the average droplet number density, N, of the considered dropsize classes at different measurement locations for both the acetone and water sprays.N is normalized by the corresponding value for evaporative spray at R=0 mm. Theuncertainty of N was approximately ±4% at a 95% confidence interval. The averagenumber density decreases towards the spray edge. The radial gradient of N acrossthe spray is always higher for the water spray, while evaporation reduces the gradientconsiderably for the acetone spray. Also, in the case of the acetone spray, due todroplet evaporation, significant reduction in the number of 15-30 um droplets (byapproximately 2-3 times) in the central spray region (R=0 mm) can be observedin comparison to the water spray. So, the vapour mass fraction is expected to behigher in this region, though the number density of droplets of other size classesreduces proportionately such that their probability remains the same for both sprays.T1hne intensity of fluctuations of droplet number density (ratio of r.m.s. of dropletnumber density fluctuations to the mean value, nr/N) is shown in figure 5(b). Thestatistical uncertainty of n, was approximately ±9 % with 95% confidence interval.It should be noted that for a non-evaporating spray (the water spray in the presentcase), the fluctuations of droplet number density are due to droplet dispersion, whichcan lead to preferential accumulation of droplets and formation of droplet clustersas a consequence of interaction with the carrier phase (e.g. Monchaux et al. 2012).However,for an evaporating spray (the acetone spray) the number density fluctuationsare additionally governed by droplet evaporation (i.e. the rates at which droplets ofa particular intermediate size class evaporate to become smaller droplets and largerdroplets evaporate to become droplets of that intermediate size class resulting in,respectively, decrease and increase in droplet number density of that intermediate sizeclass). It can be observed in figure 5(b) that the fluctuations (relative to mean) arehigher for the larger droplets, and increase towards the edge of the spray, in contrastto trends in variations of the mean values (figure 5a). Also, importantly, evaporationcauses increased fluctuations of droplet number density at all measurement locationswithin the spray. Near the spray edge these fluctuations can even be higher than theircorresponding mean values. S. Sahu, Y. Hardalupas and A. M. K. P. Taylor R(mm) FIGURE 5. (Colour online) (a) Normalized mean droplet number density; (b) intensityof fluctuations of droplet number density for the three droplet size classes at differentmeasurement locations for the acetone and the water sprays. 3.2.2. Droplet velocity Figure 6 shows the vector plots of the average droplet velocity of 15-30 umdroplets for the acetone spray, which indicate that the droplet velocity is mostlyaxial and with a downward direction (away from the nozzle), and its magnitudedecreases away from the spray centre. The mean droplet velocity is observed tobe almost spatially invariant within each measurement region. The same is true fordroplet velocity fluctuations. Similar trends were observed for water droplets, so arenot presented here. For the reason mentioned above, the spatially averaged velocityof droplets (of any size class) across each measurement area (i.e. 8 ×12 mm)is considered to be representative of individual droplet velocity of that size class.Figure 7(a,b) compares respectively the spatially averaged mean axial velocity (U)and intensity of axial velocity fluctuations (ur/U) for droplets of the consideredsize class for acetone and water sprays. The uncertainties (with 95% confidenceinterval) of U and ur were approximately ±1% and ±15% respectively. Although FIGURE 6. (Colour online) Vector plots of mean droplet velocity for acetone droplets ofsize class of 15-30 pm at different measurement locations. no significant difference is present in the mean velocity between the droplet sizeclasses, the droplet velocity is consistently higher for larger droplet size classes. Itis observed that evaporation caused the mean and fluctuations of droplet velocity tobecome more uniform across the spray radial profile. This requires some explanation,which is provided below. In comparison to the water droplets, the mean velocity of acetone droplets appearsto be smaller near the spray axis and higher towards the spray edge (by approximately10%). However, it can be shown to a first approximation that evaporation is expectedto always cause reduction of droplet velocity. From (1.4), the rate of change of sizeof a droplet can be expressed as Since the droplet Reynolds number (based on its mean velocity) is low (~0.2),assuming Stokes’ drag law for a single droplet, a, and considering the effect ofevaporation on droplet drag (Spalding 1951), From the above equations it can be shown that S. Sahu, Y. Hardalupas and A. M. K. P. Taylor 15-30pm 15-30 pm 30-45 pm 0 30-45 um FIGURE 7. (Colour online)(a) Mean droplet velocity and (b) intensity of fluctuations ofdroplet velocity at different measurement locations for acetone and water droplets for thethree droplet size classes. Assuming that for a given measurement location the transfer number B and thegas velocity Ug are constants within the measurement volume, and since Sh →2as Re →0, integration of the above equation implies that droplet velocity reducesproportionately with droplet size. We consider the droplet size range of 15-30 umas an example to explain the trends of figure 7(a). For the location at R=0 mm, thevelocity of 15-30 um acetone droplets, which before evaporation had a larger size(say 30-45 um; this droplet size range is selected only to demonstrate our argument)with a larger velocity, is now smaller compared to water droplets of the same size.Equation (3.4) also shows that the rate dU/dD is smaller for larger B. Since Bincreases towards the spray edge (as the vapour mass fraction away from a droplet issmaller), the evaporation rate (dD/dt) is higher but dU/dD is smaller. Thus, for thelocation at R=45 mm, the velocity of 15-30 um acetone droplets, which used to beof even larger size (say 45-60 pm; again this droplet size range is selected only to Normalized droplet-gas slip velocity FIGURE 8. (Colour online) Probability of instantaneous droplet-gas slip velocity in theaxial direction for 30-45 um and 45-60 um droplet size classes for the acetone spray atthe measurement location R=0 mm. demonstrate our argument) with an even larger velocity, is now larger compared towater droplets of the same size. The above discussion does not consider the responseof the different droplet sizes to the induced mean airflow in the spray, which will bediscussed below. For both sprays, the axial velocity fluctuations were smaller than the respectivemean values at all measurement locations although they increased away from the spraycentre, and were smaller for larger droplet size classes (figure 77bb). Also, fluctuationsof droplet velocity were higher for the acetone droplets compared to water dropletsfor both axial directions (approximately 15%) and radial direction (approximately25%). The anisotropy of the droplet velocity fluctuations, defined as the ratio ofur/ur, was approximately 1.5-2 for all cases, and was slightly reduced away from thespray axis. These characteristics are according to expectations for a jet flow, whichis approximately the flow behaviour induced by the spray. The droplet-gas slip velocity is an important parameter, which not only influencesdroplet evaporation and drag (equations (3.2) and (3.3)) but also the correspondencebetween droplet properties and neighbouring vapour mass fraction. Therefore, thedroplet slip velocity was determined by considering the instantaneous relative velocityof droplets with respect to gas velocity (approximated by the velocity of 15-30 umdroplets, which is justified by the Stokes number evaluation presented below) for theevaporative spray. The corresponding probability distributions for the 30-45 um and45-60 um droplet size classes are shown in figure 8 for the axial velocity componentof the droplets. The slip velocity for a given droplet size class is normalized bythe respective mean velocity of the droplet size class. It is observed that the meandroplet-gas slip velocity is close to zero, thus the droplet Reynolds number fordroplets of all sizes is very small (Re <1). However, the slip velocity of the dropletshas both positive and negative sign, indicating that droplets may lead or lag the gasmotion. This refers to fluctuations of slip velocity indicating the role of gas-phaseturbulence. Therefore, the vapour evacuation due to convective effects (mean slip) is 0 mm 45 mm Integral length scale, L (mm) 13 23 Axial r.m.s. velocity, ur (m s-) 0.60 0.45 Characteristic time scale, tg (ms) 21 51 Energy-containing eddy Stokes number, Stz 0.05, 0.16, 0.30 0.02,0.06,0.13 TABLE 1. Estimated turbulent characteristics of the air flow in the acetone sprayaandcorresponding droplet Stokes numbers for the 15-30 pm, 30-45 um and 45-60umdroplet size classes at the measurement locations R=0 and 45 mm. not expected to be significant in comparison to the turbulence effects. This highlightsthe differences in the droplet evaporation experiments based on isolated pendantdroplets (typically in wind tunnels), where the convective effects are always dominant,and sprays. Nevertheless, as will be explained later, the instantaneous slip velocity isresponsible for spatial disparity between the locations of droplets and vapour, whichresults in reduced correlation between the two phases. Table 1 shows the estimated turbulent characteristics of the air flow for the acetonespray at measurement locations R=0 mm and 45 mm. Since the air velocity aroundthe droplets was not measured in our experiments, the gas velocity is assumed tobe the same as the velocity of small droplets of size 15-30 um. These droplets areexpected to faithfully follow the gas flow since the measurement location is situatedfar downstream of the injector exit, and so the ‘ballistic’motion of atomized dropletsthat strongly determines droplet motion near the atomizer (Hardalupas et al. 1990)is attenuated. This is supported by the Stokes number analysis presented below. Theintegral length scale (L) of the turbulent air flow is determined by measuring spatialvelocity correlation coefficients between fluctuations of velocity of 15-35 um dropletsfollowing the method described in Sahu et al. (2014a). The value of L at R=0 mmis approximately 13 mm, which is in agreement with the value of L estimated as1/5 of the spray radius (≈10 mm), as suggested by Tennekes & Lumley (1972). Thecharacteristic time scale of the entrained air flow by the spray (te) is chosen as theratio of the integral length scale to the axial r.m.s. velocity of the 15-30 um droplets.The Stokes number (St) of a droplet size class is defined as the ratio of the dropletaerodynamic time constant or the ‘droplet relaxation time’(ta) to an appropriateturbulence time scale of the flow. Based on the characteristic time of the entrainedair flow by the spray, the Stokes number of the 15-30 wm, 30-45 pm and 45-60 umdroplet size classes at the spray centre are estimated as Stz=0.05, 0.16 and 0.30,respectively. This means that while droplets of 15-30 um follow the gas motion,larger droplets show partial response to the large-scale eddies of the gas phase. Theestimated values in table 1 were nearly the same for the water spray, hence are notpresented here. Since the estimated St, for the smallest droplet size class is very low(=0.05), thisjustifies our assumption of those droplets following the air flow faithfully. Also, thefact that the droplet-gas slip velocity decreases significantly for all droplet sizes fardownstream of the injector exit (see Gounder, Kourmatzis & Masri 2012; Sahu et al.2016) further supports the above assumption. However, in our earlier work (Sahu et al.2014a) we have shown that the integral length scale of the droplet flow is smallerthan that of the gas flow, and also, the gas velocity fluctuations are smaller thanthe droplet velocity fluctuations, though the differences are smaller for droplets oflow Stokes number. Thus, the energy-containing eddy time scale is expected to be 0.05 0.04 0.03 0.02 0.01 (mm) FIGURE 9. (Colour online) Contour plots of mean mass fraction of acetone vapour atdifferent measurement locations: R =0 mm (a), 15 mm (b), 30 mm (c) and 45 mm (d)for the acetone spray. slightly overestimated, and the Stokes numbers are expected to be smaller than theestimated values presented in table 1. Nevertheless, we emphasize that the turbulentcharacteristics and Stokes numbers are good estimates in an order of magnitude sense. 3.2.3. Vapour mass fraction The contour plots of average vapour mass fraction (Y) are presented in figure 9.As compared to the saturated condition (Ysat=0.32 at 15°C), the mean vapour massfraction was low (≈5-15% of the saturation value) throughout the measurementregion. This corresponds to equivalence ratio of approximately 0.07-0.3 implying alean mixture. Also, as expected, Y reduces considerably for measurement locationstowards the edge of the spray in accordance with the reduction of acetone dropletnumber density (compared to the water droplets), as presented in figure 5(a). Thisconfirms that the assumption of neglecting laser energy absorption by the vapour inthe vapour mass fraction evaluation from the PLIF measurements is valid. In general,Y is expected to increase in the direction of mean flow downstream as the dropletscontinue to release vapour during their motion away from the nozzle exit. However,this effect is expected not to be significant in the present case, since the dropletevaporation time,tu ≈ 50-40 ms (obtained from (3.2) and based on droplet SMD,as explained later), is larger than the droplet residence time within the measurementwindow (≈5-10 ms), where the limits of the time interval correspond to the spraycentre and edge, respectively. For the rest of the paper, the spatial average of the vapour mass fraction within themeasurement area of 8 × 12 mm² across an ‘instantaneous’realization is consideredto be representative of the vapour mass fraction at that instant. This is done to allowestimation of the correlation between instantaneous vapour mass fraction, and droplet S. Sahu, Y. Hardalupas and A. M. K. P. Taylor 3 (b)0.70 0.65 0.60- 0.55 0.50 0.45 0.40- 0.35 01 FIGURE: 10. (Colour online) Radial profiles of (a)) mmeeaann vapour massSffraction and(b) intensity of fluctuations of vapour mass fraction in the acetone spray. number density and velocity, which will be presented later. Also, this is justifiedsince no notable spatial gradient of vapour concentration is observed in figure 9 foreither axial or radial directions at each of the measurement locations. The averagevalues of the instantaneous vapour mass fraction over all realizations is obtained andpresented in figure 10 along with the corresponding normalized fluctuations of vapourmass fraction (yr/Y). This is consistent with figure 9 and, as expected, the meanvapour mass fraction reduces away from the spray axis. However, the fluctuations(relative to the mean) increase away from the spray axis, as a consequence of thelocal fluctuations of droplet number density and velocity for which similar trendswere observed (figure 5b). In fact, near the spray boundary, the fluctuations of vapourmass fraction are of the same order as the mean value. Figure 11 presents the probability distributions of the instantaneous vapour massfraction within the acetone spray at the measurement locations R =0 mm and45 mm respectively. These probability distributions signify temporal variations ofvapour mass fraction around the droplets, hence the transfer number B is expectedalso to be a time-varying parameter and therefore may not be assumed constant.While at the spray centre, the probability distribution function of the vapour massfraction iss approximately Gaussian, near the spray edge the probability functionis positively skewed with a peak appearing at the minimum vapour mass fractionvalues (figure 11b). This can be explained as follows. For measurement locationsclose to the spray edge (R=30 and 45 mm), an instantaneousPLIF image maynot contain any droplets. The vapour mass fraction in such cases was found to bevery low and can be either due to vapour transported from elsewhere or backgroundnoise (even though a background noise image is subtracted from the measured LIFintensity, some shot-to-shot variation of laser energy is possible). Thus, the peakprobability, corresponding to nearly zero vapour mass fraction, is attributed to theflow intermittency near the spray edge. FIGURE 11. Probability distribution of fluctuations of vapour mass fraction atR=0 mm (a) and 45 mm (b). 3.3. Quantification of interaction between droplet and vapour phases 3.3.1. Correlation between droplet number density and vapour mass fraction At first sight, it may appear that the momentum and inertia of the droplets caneasily separate them from the vapour that they release due to evaporation, so thatthe measured droplets at any location in the flow are not responsible for the localvapour. However, it is important to note that the correlation between droplet andsurrounding vapour depends on the droplet evaporation rate as well as the dropletStokes number St (in other words how well the droplets follow the surroundinggas flow) and density difference between the vapour and ambient gas. Althoughthe density of acetone vapour is nearly twice that of the air, due to the very lowvapour mass fraction (figure 9) the mixture density can be assumed to be the sameas that of the air. For our experimental conditions, as mentioned before, Stz ≈0.1,which means medium and large droplet sizes partially follow the large scales of the air flow. This means the generated vapour is transported with the droplets. Hence,a certain level of correspondence between local droplets and surrounding vapourmass fraction is expected. This is confirmed in figure 12, which presents the scatterplot of the instantaneous droplet number density (N), measured by ILIDS, and thecorresponding local vapour mass fraction, (Y) measured by PLIF, for measurementlocations at R=0 mm and 45 mm. The plots signify proportionate increase ofacetone vapour (within the measurement region) with droplet number density in anaverage sense (as shown by the linear fit of the data). This linear dependence ofthe two quantities is expected if the droplets are far apart from each other, so thatthe totallgenerated vapour is simply a multiple of the vapour released by singledroplets: these characteristics indicate the relevance of the d--law for the modellingof droplet evaporation. However, considerable scatter is observed around the lineardependence of figure 12 for both number density N and vapour mass fraction Yaxes. The spreading along the N-axis (horizontal) indicates the presence of the sameamount of vapour for different droplet numbers in the measurement region, whilethe spreading in the Y-axis (vertical) indicates variation of vapour mass fractionfor the same number of droplets present in the measurement region. This can beattributed to dispersion of droplets due to interaction with carrier-phase turbulentflow, which leads to droplet clustering resulting in smaller inter-droplet spacing thanthe average, which consequently reduces the droplet evaporation rate which is thendetermined by the group evaporation of droplet clouds. On the other hand, scalarmixing of droplet vapour with the surrounding air results in local dissipation ofvapour fluctuations. Hence, the scattering of the data can be attributed to competitionbetween droplet dispersion and scalar mixing. It can also be observed in figure 12 thatthe extent of spreading for both N and Y directions is reduced for the case of locationR= 45 mm in comparison to the central spray location, and the slope of the linearfit is larger. This indicates that the group evaporation tendency of droplets reducestowards the spray boundary. It should be noted that the dependence between N andY, as presented above, is important for the evaluation of the Eulerian joint probabilitydensity function of mixture fraction and vapour source term, which can fully describethe unclosed source terms appearing in the transport equations of mixture fraction in(1.1) and (1.2) (Reveillon & Vervisch 2000). Experimental evaluation of these termsis not available in the literature. The above discussion explained the need to evaluate the correlation betweenfluctuations of droplet number densities and vapour mass fraction n xy from ourmeasurements, which uniquely provides this ability. Since the definition of the mixturefraction in sprays (containing vapour sources) is not straightforward (Reveillon &Vervisch 2000), we present n×y. The corresponding correlation coefficient, denotedas Rn*y, can be expressed for droplet size class D as where nr and yr are the r.m.s. of the number density fluctuations for size class D andmass fraction fluctuations respectively. Rny, evaluated for each droplet size class andfor different measurement locations in the acetone spray, is presented in figure 13. Theuncertainty in Rnxy was approximately ±0.05 with 95 % confidence interval. It can be observed in figure 13 that the correlation is always positive, which meansthat positive/negative fluctuations of droplet number density results in higher/lowervapour mass fraction than the mean value at any instant in time. Also, the correlation FIGURE12. (Colour online) Scatter plot of instantaneous droplet number density andvapour mass fraction at R=0 mm (a) and 45 mm (b). s stronger away from the spray axis. This is in agreement with the scatter plotsof figure 12, and the discussion thereafter. At any measurement location, Rnxyvaries inversely with droplet size. Even if the droplet evaporation rate is higherfor larger droplets (see (1.4)), since the smaller droplet size class dominates thedroplet size distribution, t..he respective contribution to vapour mass fraction fromsmaller droplet sizes is higher. For any droplet size class, it can be argued thatthe relative magnitude of Rnxy at different radial measurement locations suggeststhe mode of droplet evaporation: while larger values indicate individual dropletevaporation, smaller values of the correlation signify group evaporation. Due to their partial response to the gas motion, the droplets are associated withthe slip velocity (see figure 8) such that the released vapour from droplets may leador lag the droplet motion. In such a case, it is important to recall the effect ofdroplet-gas slip on the correlation Rn*y, which, however, cannot be discerned fromfigure 13 since the current dimensions of the measurement area (8×12 mm²) are S. Sahu, Y. Hardalupas and A. M. K. P. Taylor R(mm) FIGURRE E13. (Colour online) Correlation coefficient(Rn*y) between fluctuationsofnumber density (for different droplet size classes) and vapour mass fraction at differentmeasurement locations in the acetone spray. The uncertainty in Rnxy was approximately±0.05 with 95 % confidence interval. of the order of the large-scale eddies of the carrier-phase flow. Hence, Rnxy was alsocalculated for smaller window sizes, one-half and one-quarter of the measurementwindow dimensions (i.e. 4×6 mm’ and 2×3 mm², respectively) for droplets of thethree size classes. The statistical uncertainty of Rny increases for smaller window size,and was found to be ±0.06 and ±0.15 for the 4x6 mm²and 2×3 mm²windowsrespectively. Figure 14 shows the comparison of Rnxy for different measurementlocations for the three window sizes. It can be observed that for any window size,the correlation is smaller for larger droplet size at all measurement locations, asobserved before. Importantly, the magnitude of Rnxy decreases for smaller windowsizes (by approximately 30% and 50% for windows of 4×6 mm’ and 2×3 mm²,respectively), implying the role of droplet-gas slip, which results in spatial disparitybetween the location of droplets and vapour. Due to the larger statistical uncertaintyfor the smallest window size, the radial increase of Rnxy cannot be observed, unlikefor the other window sizes. 3.3.2. Correlation between droplet velocity and vapour mass fraction As mentioned earlier, since in our experiments small droplets (15-30 um) can beassumed to follow fairly well the gas velocity fluctuations, the correlation betweenthe 15-30 pm droplet velocity and vapour mass fraction can elucidate the effectsof gas turbulence on the droplet evaporation rate. Figure 15 presents the scatter plotbetween instantaneous fluctuations of droplet velocity and vapour mass fraction forboth axial and radial velocity components of 15-30 um droplets for a measurementlocation at R=0 mm. It is interesting to observe that instantaneous fluctuations ofdroplet velocity are positively correlated to fluctuations of vapour mass fraction. Thismeans increase/decrease of gas velocity fluctuations results in similar variation of thedroplet evaporation rate. The correlation is much stronger for axial droplet velocity(figure 15a) in comparison to the radial component (figure 15b), which is expectedsince there is strong anisotropy at the spray centre. R (mm) FIGURE 14. (Colour online) Correlation coefficient of the fluctuations of droplet numberdensity and vapour mass fraction, Rny, for different window sizes and measurementlocations for droplet sizes of (a) 15-30 um, (b) 30-45 um and (c) 45-60 pum. Next we calculate the normalized correlations for the considered droplet size classesand different measurement locations. The correlation coefficients, denoted as Ruy andRuy, can be expressed for droplet size class D as S. Sahu, Y. Hardalupas and A. M. K. P. Taylor (b) 0.06 u-T FIGURE 15. (Colour online) Scatter plot of fluctuations of velocity of 15-30 pm droplets(approximating the gas flow velocity fluctuations) and vapour mass fraction at R=0 mmfor (a) axial velocity and (b) radial velocity. where ur and ur are the r.m.s. of axial and radial velocity fluctuations for sizeclass D. Figure 16 presents the results. The statistical uncertainty for the correlationcoefficientswasapproximately ±0.05 with 95% confidence interval. Unlike thecorrelation between droplet number density and vapour mass fraction (Rn*y) apresented earlier (figure 13), both Ruy and Ruxy are nearly independent of dropletsize, since their Stz are not significantly different, although Roxy reduces slightly withdroplet size. Ruy is nearly invariant (≈0.6) across the spray and higher than Ruxyfor all measurement locations. Ruy is nearly zero at the spray centre but increasestowards the spray edge as radial transport of droplets becomes more important. R(mm) FIGURE16. (Colour online) Correlation coefficient between fluctuations of dropletvelocity and vapour mass fraction for different droplet size classes and measurementlocations for (a) axial velocity and (b) radial velocity components. Although in the past considerable research work has been reported concerningthe effect of turbulence on evaporation rate of suspended droplets (for example,see Gokalp et al. 1992; Birouk et al. 1996; Birouk & Toth 2015), there is nogeneral consensus yet on the role of air turbulence in a spray. According to Gokalpet al. (1992), a way to evaluate the role of turbulence in droplet evaporation is byconsidering the vaporization Damkohler number (Da,), which is the ratio of the timescale of turbulent eddies (t) and droplet evaporatfWion time (t,). For two dropletsof different volatility but the same size subjected to the same turbulent flow field,smaller Da, implies a stronger influence of turbulence on droplet evaporation. Asingle droplet evaporation study by the same authors focused on very low values ofDa,(<1) due to their large initial droplet size (approximately 1 mm), which wasof the same order as the integral length scale. However, this is not true in technicalapplications of sprays. For the present case, Da,was calculated considering the S. Sahu, Y.Hardalupas and A. M. K. P. Taylor characteristic time scale of energy-containing eddies of the gas flow turbulence (seetable 1) and the theoretical droplet evaporation time, since in the present experimentsthe evaporation rate of individual droplets of the spray cannot be measured as thisrequires Lagrangian tracking of the droplets. The theoretical evaporation time of adroplet (whose initial size D, is equal to the measured SMD in our experiments) wascalculated based on the d-law according to (3.2): where the evaporation constant K,=8(p/pi)D, ln(1+B)Sh. This leads to Da~0.4and 1.3 at locations R=0 mm and 45 mm, respectively, which means the evaporationtime of isolated droplets is comparable to the large eddy time scale of the surroundingturbulent flow. Thus, the gas-phase turbulence can influence the droplet evaporationrate. In order to evaluate the role of turbulence on droplet evaporation one canalso compare the Stefan velocity (u) and turbulent velocity fluctuations of thecarrier-phase velocity (ur). For an initial droplet size equal to the measured SMD, theStefan velocity can be calculated as The ratio us/ur was found to be approximately equal to 0.15 and 0.22 at R=0 mmand 45 mm respectively, which values are less than the corresponding Da,. However,it conveys the same information, as described above in the context of the Da, that theevaporation speed of the droplets is comparable to turbulent velocity fluctuations, andturbulence effects on the evaporation of the droplets are higher at the spray centreas us/ur is lower compared to that close to the spray edge. Here, we note that insprays, unlike in single droplet evaporation studies, turbulence has an indirect effect ondroplet evaporation through droplet dispersion leading to interaction between vapourfrom neighbouring droplets. The influence is more significant when droplets tend toform clusters due to their interaction with the flow turbulence, resulting in reductionof inter-droplet distance and therefore evaporation rate. Thus, t, increases and Da, issmaller. This explains the strong correlations observed in the above figures. Inisummary, 1above providee usefulinformation regarding the interaction between the two phases in sprays. However,the question remains as to what factors govern the correlation between local vapourmass fraction and droplet properties: Should this be due to local evaporation, mixingor advection from upstream? We attempt to explain this below. In our experimentsapproximately5-10 ms, while the droplet evaporation time is typically 40-50 ms, as predicted by theconvection corrected d--law. The actual droplet evaporation time may be somewhathigher due to droplet clustering resulting in evaporation of the droplet cloud ratherthan individual droplets. In addition, the time scale of vapour diffusion across themeasurement area is much larger (approximately 1 s). Hence, the correlation betweeninstantaneous droplet number density and the local evaporation of droplets and/ormixing must be very weak. On the other hand, since the density difference betweenvapour and air is not significant and the droplet Stokes number (based on the largeeddy scale) is small, the vapour around droplets is carried along with the carrier airflow. Hence, the instantaneous correlation between the droplet number density andvelocity with surrounding local vapour concentration is attributed to advection ofvapour. Interaction of droplet dispersion and evaporation 0.8 R (mm) FIGURE 17. (Colour online) Correlation coefficient (Rm;*n;) between fluctuations of numberdensity of different droplet size classes as a function of distance from spray axis. Theuncertainty in the correlation was approximately ±0.05-0.07 with 95 % confidence interval.The open and closed symbols refer to water and acetone droplets, respectively. 3.3.3. Correlation between droplet number density of different size classes The correlation coefficient between fluctuations of droplet number density ofdifferent droplet size classes, denoted as Rn;*n;, is useful for understanding dropletdispersion and clustering in isothermal spr:ays (Sahu et al. 2016) and can provide aninsight into the dispersion of evaporating droplets. The correlation coefficient of thefluctuations of droplet number density of two droplet size classes D; and D; can beexpressed as Large values of Rmin imply that any increase or decrease in droplet concentrationof one size class is accompanied by a similar variation for the other, which meansthat droplets belonging to both size classes respond similarly to the gas motion andtherefore may both contribute to droplet clustering affecting droplet evaporation. In thepresent case, Rn;*n; is obtained for both acetone and water sprays, and the results areplotted in figure 17 for different measurement locations, R. The statistical uncertaintyin the correlation was approximately ±0.05-0.07 with 95 % confidence interval. Figure 17 shows Rmn for the three combinations of droplet size classes consideredin the present case (i.e.Rn1*n2, Rn2*n3 and Rn*n3, where 1, 2 and 3 denote increasingorder of droplet size classes), which are positive for all cases. It can be observed thatfor all measurement locations, Rn*n2>Rn*n3> Rn *n, which is due to increasinglypoor response of the large droplet size class to gas motion. For water droplets Rn;*n;increases considerably towards the spray edge due to the better response of thedroplets (smaller Stz). However, for acetone droplets, the correlation coefficients forany combination of droplet size classes are almost spatially uniform across the spray,and higher in comparison to water droplets, especially close to the spray centre. Thisis attributed to evaporation of acetone droplets, which caused increased fluctuations of droplet number density compared to the water spray (figure 5b). Thus, Rn;*ni. canbe considered as an indication of existence of droplet clustering, which is moreprominent in the acetone spray than the water spray. 3.3.4. Group evaporation number (G) As mentioned earlier, Chiu & coworkers (Chiu & Liu 1977; Chiu et al. 1982;Chiu & Kim 1983) characterized group burning of droplets by the group combustionnumber, G. For a mono-dispersed spherical cloud of droplets, the magnitude of Gspecifically depends on droplet diameter (D), number of droplets (nr) and inter-dropletdistance (la), and can be expressed as where Re is the droplet Reynolds number, Sc and Le are the gas Schmidt and theLewis numbers respectively and S is the non-dimensional separation distance such thatS=(la/10D)/(1+0.276Re5Sc 33). With a progressive increase in the magnitude ofG, different modes of group combustion may prevail (Sirignano 1999), for example,single droplet combustion (G《1), internal group combustion (G<1), external groupcombustion (G>1) and external sheath combustion (G>1). For a reacting spray, a flame surrounding a cloud of droplets results in the groupburning mode of the droplet cloud. In the present work we identify droplet clusteringas one of the reasons behind droplet cloud formation, though in the context of anevaporating, non-reacting spray. Away from the injector exit, dynamic interactionof droplets with the surrounding turbulent air flow leads to formation of clustersof droplets. The droplet clusters are dynamic entities and the droplets within acluster remain close to each other for a time scale comparable to the characteristicturbulence time scale of the surrounding air flow (Monchaux et al. 2012). Althoughthe convection of the vapour away from the droplet vicinity is the controlling factorfor droplet evaporation, however, in our case, since the droplet Reynolds numberis small (Re≈0.1), the diffusion plays an important role in addition to turbulence.The diffusion of vapour from the droplet surface is controlled by the gradient of thevapour concentration. Due to smaller separation distance between droplets within acluster, the gradient in vapour concentration at the droplet surface is smaller thanthat for an isolated droplet. Hence, the overall evaporation rate of a droplet clusteris expected to be smaller than that for an isolated droplet. Earlier, several worksand review articles (for instance, Reveillon & Vervisch 2000; Kronenburg 2007;Reveillon & Demoulin 2007; Jenny, Roekaerts & Beishuizen 2012) identified that thedroplet segregation strongly affects the evolution of the vapour mixture fraction andinsisted on lack of models to account for such effects. However, experimental workhighlighting the above effect is rare. The measurement of the local group evaporationnumber is a way to quantify the change of evaporation rate due to the above effects.For non-reacting and evaporating sprays G can be termed the group evaporationnumber, which indicates the significance of the gross droplet evaporation rate relativeto the inward diffusion rate of air. Since for our flow conditions the droplet Reynoldsnumber is small, and for mixture of acetone vapour and air Sc≈1 and Le ~ 1,equation (3.12) becomes Since the expression for G (3.12) was derived for droplets uniformly spaced withina cloud of droplets, the volume occupied by the cloud approximately equals to np ×nla/6. Thus, for a spherical droplet cloud of size Lc, Thus, equation (3.14) can be expressed as The group evaporation number is evaluated using (3.16) instead of (3.14); the reasonbehind this will be explained later. However, in such a case, two challenges areencountered: (i) an estimation of the size of droplet clouds or clusters is essential,and (ii) the droplet cluster passing through the measurement region must be identified,since (3.16) is applicable to droplet clouds only. Both of these aspects are discussedbelow. 3.3.5. Radial distribution function (RDF) In the present case, the droplet cluster dimension (Le), required for (3.16), wasobtained by evaluating the radial distribution function (RDF) of the droplets fordifferent measurement locations in the spray. RDF essentially measures the probabilityof finding a second droplet at a given separation distance from a reference droplet,compared to a case where the droplets are homogeneously distributed (Sundaram& Collins 1999; Salazar et al. 2008). It is computed from a field of M number ofdroplets by binning the droplet pairs according to their separation distance (r), andcalculating the function where Pi is the number of droplet pairs separated by a distance r; ± 8r/2, theparameter ri refers to the discrete values of separation distance, where the RDF iscalculated, 8A, is the area of the discrete shell located at r;, P=M(M-1)/2 is thetotal number of pairs and A is the total area of the measurement region. Effectively,the values of RDF>1 refer to the degree of preferential accumulation or clusteringof droplets due to their interaction with turbulent eddies, while values of RDF <1represent voids. Thus, the value of radial separation (r) for which RDF(r) ≈ 1provides an estimate of the length scale of the clusters (Lc). In the present work,measurement of RDF was achieved by ILIDS measurements of droplets. We haveverified in our previous work (Sahu et al. 2016) that calculation of L by an RDFbased on ILIDS agrees well with the ‘droplet counting in a cell’approach (Fessleret al. 1994) based on focused spray droplet images. The expression for G in (3.16)is derived for uniform size of droplets in a cloud. However, a droplet cluster maycontain droplets of different sizes. Thus, Le should be determined for an averagedroplet size. However, before presenting this we will explain the tendency of dropletsof different sizes to form clusters, and in such a case whether the correspondinglength scales of droplet clusters are different. Figure 18 presents RDFs for radial measurement locations in the acetone spray atR=0 mm and 45 mm respectively. The RDFs are calculated conditional on dropletsize classes, which means that only droplets of that size class are assumed to bepresent in an ILIDS image. The RDFs are plotted for different r values normalizedwith the local integral length scale, L, which is larger towards the spray edge (table 1). S. Sahu, Y. Hardalupas and A. M. K. P. Taylor r/L FIGURE 18. (Colour online) Evaluation of RDF for the radial measurement locations inthe acetone spray at (a) R=0 mm (L=12 mm) iand (b) R=45mm (L=17 mm)conditional on droplet size. The error bars indicate uncertainty in the RDF with 95%confidence interval. Theincrements in ri, and 8ri/2 were chosen to be 1 mm and 2 mm respectively, asa compromise between losing the spatial resolution and having enough droplets toobtain appropriate statistics. Similar trends were found for RDFs at other measurementlocations, and are not presented here. It can be observed that the RDF values arehigher for larger droplet sizes due to the smaller droplet number count per unitarea in an image (low P/A). This trend is in agreement with fluctuations of dropletnumber density (relative to the mean) as shown in figure 5(b). The length scale of thedroplet clusters is approximately 0.1L-0.3L, as shown in figure 18, which means theenergy-containing eddies influence dispersion of droplets similarly to particle-ladenjet flows (Longmire & Eaton1992). Also, the cluster dimension is larger for higherdroplet size classes. Thus, the larger droplets have a greater tendency to preferentiallyaccumulate in some regions of the flow. It is also observed in figure 18 that the Interaction of droplet dispersion and evaporation Radius of separation,r (mm) iURE 19. (Colour online) Evolution of radial distribution function (RDF) of thespray droplets for increasing radius of separation for the acetone and water sprays atmeasurement locations R=0 mm and 45 mm. RDF values increase for the location of R= 45 mm for all droplet size classes incomparison to those for the spray centre. This is justified due to the better responseof the droplets towards the edge of the spray as the flow is slower and Stz is smaller. In order to estimate the droplet size-averaged Le, RDF is calculated by consideringdroplets of all sizes in the ILIDS images. Figure 19 presents such RDFs for theacetone spray at the measurement locations R=0 mm and 45 mm. The functionsare plotted for different radii of separation. The RDF values are close to those of the15-30 um droplets in figure 18, as expected, due to domination of smaller dropletsin the droplet population. Figure 19 also shows the RDFs for the water spray for therespective measurement locations in order to assess the effect of droplet evaporationon droplet clustering. For both sprays, the function shifts upward for the R=45 mmlocation implying increase in RDF values and droplet cluster length scale towards thespray boundary. Also, it can be observed that the RDF values are higher (though notsignificantly) for the acetone spray for all radii of separation - hence the tendency ofdroplets to form clusters and the cluster dimension increase due to evaporation. Asthe droplets tend to form clusters, the temporal variation of droplet number densityis expected to increase at any spatial location. This is in agreement with the increasein number density fluctuations in figure 5(b), and number density correlation (Rn*n) infigure 17. The length scale of the droplet clusters, Le, in the acetone spray was estimated to beapproximately 2-3 mm, which is approximately one-third of the measurement windowdimension as depicted in the PLIF images shown in figure 20. As mentioned earlier,since Le is of the order of L, the large scales of the turbulent flow are expected toinfluence the cluster size. In addition, the large eddies are responsible for the transportof these clusters, and thus the frequency of passage of droplet clusters and inter-clusterspacing at any location in the spray are expected to be governed by the large-scaleeddies of the flow (Fessler et al. 1994; Sahu et al. 2016). S. Sahu, Y. Hardalupas and A. M. K. P. Taylor FIGURE 20. Instantaneous PLIF images of the spray depicting (a) droplet clusters and(b) no clustering at the measurement location R=0 mm. The images are presented ingreyscale (0-256) for better visualization. 3.3.6. Measurement of group evaporation number For the present experiments, the droplet residence time at the measurement region(≈5-10 ms) is smaller than the energy-containing eddy time scale (≈21-51I ms).which is of the order of the time scale of transport of droplet clusters. Thus, atany time instant about one droplet cluster is expected to be present within themeasurement area at any measurement location (the image dimensions are similarto the large eddy length scales of the flow). This is also supported by the visualinspection of the PLIF images at R=0 mm in figure 20. The group evaporationnumber (G) is evaluated for different time instants corresponding to passage of adroplet cluster through the measurement window at any radial measurement locationin the spray. For instantaneous ILIDS images where droplet clusters are identified, Gis calculated under the assumption that the characteristic droplet size and inter-dropletdistance within a cluster is the spatially averaged droplet size and average dropletseparation distance calculated based on all droplets appearing in an instantaneousimage. Thus, in (3.16), the parameter D is considered as the arithmetic mean diameter(AMD) of droplets identified in an instantaneous ILIDS image such that nTu where D is the size of ith droplet and nr is the total number of droplets identifiedin the ILIDS image. The parameter la is the average minimum droplet separation distance defined as nTu where lai is the minimum separation distance of the ith droplet with respect to anyother droplet in the ILIDS image. Since the validation rate of ILIDS image processing(i.e. the ratio of number of droplets identified in the image (nTu) to the total number ofdroplets actually present within the measurement volume) is approximately 30-50 %,nTu
-
1/45

-
2/45
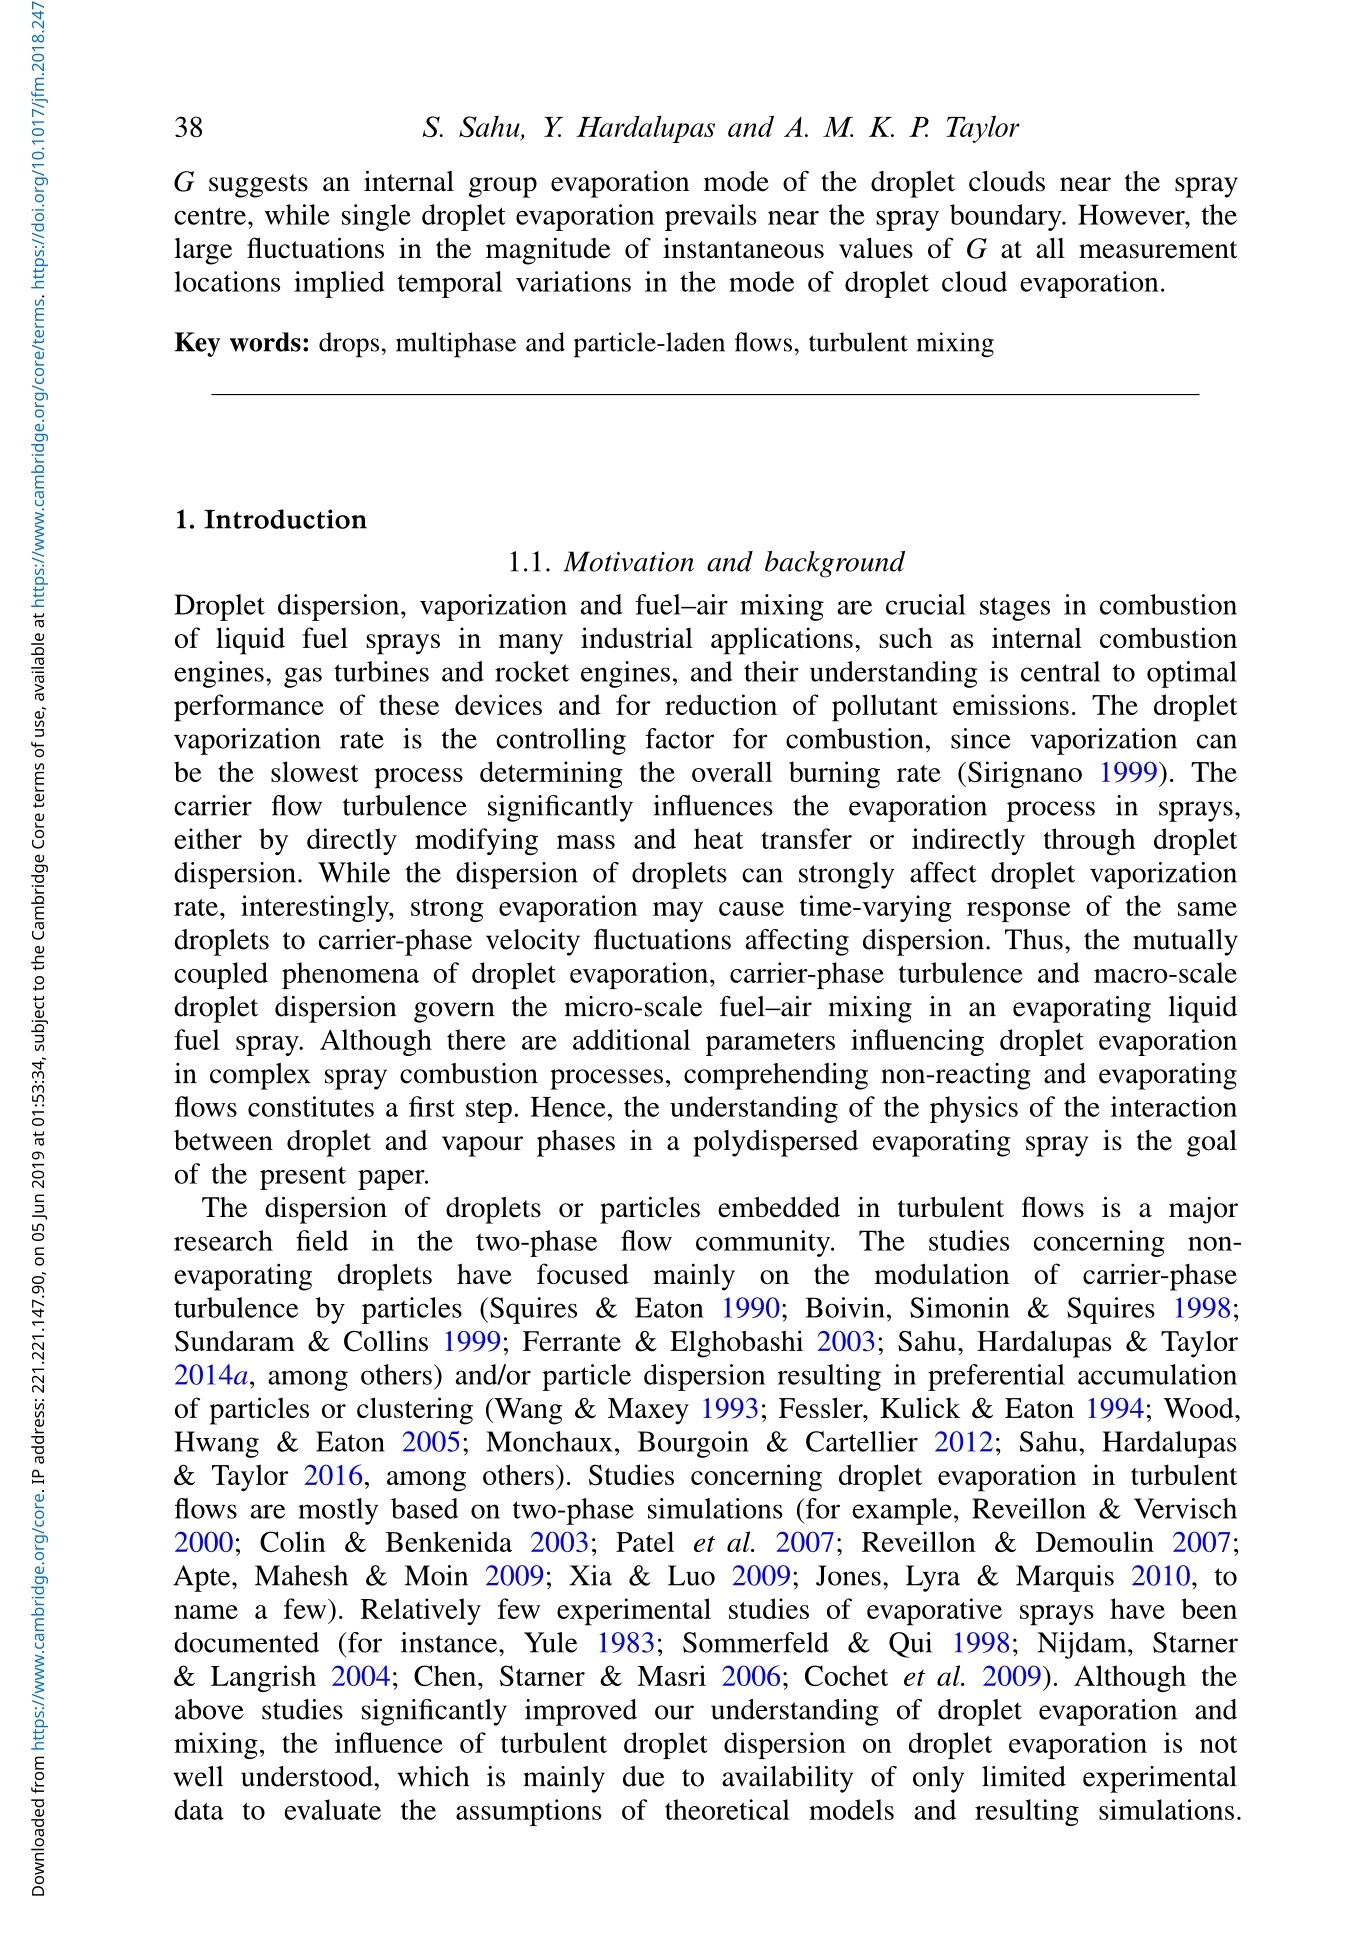
还剩43页未读,是否继续阅读?
继续免费阅读全文产品配置单


北京欧兰科技发展有限公司为您提供《喷雾中IMI液滴粒径测量,PLIF测量,粒径,速度,质量密度检测方案(激光粒度仪)》,该方案主要用于其他中IMI液滴粒径测量,PLIF测量,粒径,速度,质量密度检测,参考标准《暂无》,《喷雾中IMI液滴粒径测量,PLIF测量,粒径,速度,质量密度检测方案(激光粒度仪)》用到的仪器有LaVision ParticleMaster-IMI 干涉米氏粒径测量、激光相位多普勒干涉仪LDV,PDI,PDPA,PDA、PLIF平面激光诱导荧光火焰燃烧检测系统、德国LaVision PIV/PLIF粒子成像测速场仪、LaVision DaVis 智能成像软件平台。
我要纠错
推荐专场


相关方案
 咨询
咨询