方案详情文
智能文字提取功能测试中
The Goal of the present study was to investigate the effect of varying levels of dietary protein and energy/lipid on the growth performance, nutrient retention and body composition of fingerling Nile tilapia (Oreochromis niloticus). Therefore nine experimental diets were formulated to create a series of five different levels of dietary protein (33, 36, 39, 42 and 45 % DM) and a series of five different levels of lipid (5, 7, 10, 13 and 16 % DM). The initial body weight of the experimental fish was 2.17 g. The fish were fed five times a day for 20 experimental days. Best growth rates were obtained by fish fed a diet containing 38.3 % protein and 10.8 % lipid at a crude protein to gross energy ratio of 18.2 g CP MJ-1 GE. 35.3 % protein and 5.3 % lipid led to significant growth reduction in comparison to higher levels of protein and lipid. Energy retention efficiencies increased linearly with increasing levels of dietary lipid.本研究旨在研究不同膳食蛋白质和能量/脂肪水平对尼罗罗非鱼生长性能、营养保留和体组成的影响。因此,我们制定了9种实验性饮食,以创建一系列5种不同水平的膳食蛋白质(33、36、39、42和45 % DM)和一系列5种不同水平的脂肪(5、7、10、13和16 % DM)。实验鱼的初始体重为2.17 g。这些鱼每天喂食5次,实验20天。在含蛋白质为18.3%和10.8 %脂肪的饲料中,粗蛋白与总能量比为18.2 g CP MJ-1 GE,可获得最佳的生长速率。与较高水平的蛋白质和脂肪相比,35.3 %的蛋白质和5.3 %的脂肪导致生长显著降低。能量保留效率随膳食脂肪水平的增加呈线性增加。ResearchGate不同膳食蛋白质和能量水平对尼罗罗非鱼的生长和肌体组成的影响 VI All content following this page was uploaded by Jan Becker on 10 November 2017.The user has requested enhancement of the downloaded file. See discussions, stats, and author profiles for this publication at: https://www.researchgate.net/publication/320991180 Growth and body composition of fingerling Nile tilapia (Oreochromisniloticus) in response to different levels of dietary protein and energy Thesis· January 2017 CITATIONS READS 0 353 1 author: Humboldt-Universitat zu Berlin 1PUBLICATION O CITATIONS HUMBOLDT-UNIVERSITAT ZU BERLINFaculty of Life Sciences Albrecht Daniel Thaer-Institute of Agricultural and HorticulturalSciences 不同膳食蛋白质和能量水平对尼罗罗非鱼的生长和肌体组成的影响 “Growth and body composition of fingerling Nile tilapia(Oreochromis niloticus) in response to different levels ofdietary protein and energy” Master-Thesis in: Integrated Natural Resource Management Submitted by: Jan Becker Student ID: 514670 1. Supervisor: Prof.Dr. Katheline Hua Aquaculture, Department of Crop and Animal Sciences, Faculty of LifeSciences, Humboldt-Universitat zu Berlin 2. Supervisor:PD Dr. Annette Simon Animal Husbandry and Technology, Department of Crop and AnimalSciences, Faculty of Life Sciences, Humboldt-Universitat zu Berlin Berlin, 12.01.2017 Table of contents List of figures .. List of tables)........,IV List of abbreviations.. .V Abstract. 1. Introduction..... 2. Review of Literature .... 3 2.1 Overview on Nile tilapias...... 3 2.1.1 Taxonomic classification, distribution and anatomyy...... 3 2.1.2 Environmental conditions ...... 4 2.1.3 Aquaculture...... 5 2.2 Nutritional physiology....... 7 2.2.1 Intestinal physiology and anatomy....... 7 2.2.2 Protein requirements......●9 2.2.3 Energy requirements. 13 2.2.4 Lipid requirements. 15 3. Material and methods.. 18 3.1 Experimental system and fish....... 18 3.2 Experimental diets.... 20 3.3 Feeding trial........ 22 3.4 Sampling & chemical analysis. 22 3.5 Calculation of parameters...... 23 3.6 Statistics....... 24 4. Results....25 4.1 Growth, feed intake and utilization efficiency....... 25 4.2 CP and GE intake/gain. 32 4.3 Body composition....... 33 4.4 Deduction of the protein requirement and optimal CP/GE ratio....... 36 5.Discussion.....39 5.1 Requirement estimation using non-linear modelling ...... 39 5.2 Overall growth rates ...... 40 5.3 Body composition....... 40 5.4 Feed intake .. 41 5.5 Growth response to different levels of protein....... 42 5.6 Protein retention efficiency.......45 5.7 Growth response to different levels of energy/lipid... 46 5.8 Energy retention efficiency. 49 5.9 Protein to energy ratio ....... 50 6. Conclusions....... 52 References.VI Erklarung.... XVII List of figures Figure 1: Global production of selected groups and species of fish in 1994, 2004 and2014 (data source: FAO, 2016).......... ..6 Figure 2: Experimental tank setup; 1 = automatic feeder; 2= water inlet; 3= aeration; 4= water outlet ...... .....19 Figure 3: Final body weight (mean values; n= 299-301) of Nile tilapia fingerlings inresponse to different levels of dietary protein. Error bars indicating 95% confidenceintervals. 28 Figure 4: Body weight gain in response to different levels of dietary protein........... 28 Figure 5: Feed efficiency in response to different levels of dietary protein ..... 29 Figure 6: Protein retention efficiency in response to different levels of dietary protein 29 Figure 7: Energy retention efficiency in response to different levels of dietary protein 30 Figure 8: Final body weight (mean values; n=300-301) of N. tilapia fingerlings inresponse to different level of dietary lipid. Error bars indicating 95 % confidenceintervals ...... 30 Figure 9: Body weight gain in response to different levels of dietary lipid.... 31 Figure 10: Feed efficiency in response to different levels of dietary lipid. 31 Figure 11: Energy retention efficiency in response to different levels of dietary lipid ..32 Figure 12: Body protein content of Nile tilapia fingerlings in response to different levelsof dietary protein..... 35 Figure 13: Body lipid content of Nile tilapia fingerlings in response to different levels ofdietary protein ..... 35 Figure 14: Body lipid content of Nile tilapia fingerlings in response to different levels ofdietary lipid ..... .....m36 Figure 15: Non-linear Regression to estimate the optimal dietary protein contents forNile tilapia fingerlings using the best fitting exponential and four-parameter logistic-model. 37 Figure 16: Non-linear Regression to estimate optimal dietary CP to GE ratio for Niletilapia fingerlings using the best fitting exponential and four-parameter logistic-model.38 Figure 17: Relationship between CP intake and CP gain of fish fed graded levels of CP.Diamonds indicate experimental groups fed Diet 33/10.. ....45 Figure 18: Body energy gain in response to GE intake of fish fed graded levelsenergy/lipid. Diamonds indicating experimental groups fed Diet 39/5. 49 List of tables Table 1 Formulation and proximate composition of experimental diets ... 21 Table 2: Growth and utilization efficiencies of Nile tilapia fingerlings in response tograded levels of protein (mean ± SD)...... 27 Table 3: Growth and utilization efficiencies of Nile tilapia fingerlings in response tograded levels of lipid (mean ±SD).... 27 Table 4: CP intake and CP gain in response to different levels dietary protein, and GEintake and GE gain in response to different levels of energy/lipid (mean± SD)............332 Table 5: Body composition (%) of Nile tilapia fingerlings in response to graded levelsof protein (mean ±SD)...... 34 Table 6: Body composition (%) of Nile tilapia fingerlings in response to graded levelsof lipid (mean ± SD). 34 List of abbreviations AA Amino acid ADTI Albrecht Daniel Thaer-Institut ANOVA Analysis of Variance AOCS American Oil Chemists Society ARC Aquaculture Research Centre BW Bodyweight BWG Body weight gain C Centigrade CA Crude ash CL Crude lipid CP Crude protein CP/GE ratio Crude protein to gross energy ratio DE Digestible energy DHA Docosahexaenoic acid DM Dry matter DNA Deoxyribonucleic acid EAA Essential amino acid EFA Essential fatty acid EPA Eicosapentaenoic acid ERE Energy retention efficiency et al. et alia FBW Final body weight FI Feed intake FE Feed efficiency Gram GE Gross energy GFRP Glass-fiber reinforced plastic HE Basal metabolism HEm Maintenance energy HE Heat increment of feeding HE Voluntary activity IBW Initial body weight IE Ingested energy kg Kilogram kgDE Utilization efficiency of DE for growth kJ Kilojoule Liter LA Linoleic acid LC-PUFA Long chain polyunsaturated fatty acid LNA Linolenic acid MBW Metabolic body weight ME Metabolizable energy mg Milligram min Minute MJ Megajoule mm Millimetre NE Net energy NMKL Nordic Committee on Food Analysis NMR Nuclear magnetic resonance analysis NH3 Ammonia NO2 Nitrite O.n. Oreochromis niloticus PRE Protein retention efficiency PUFA Polyunsatured fatty acid RAS Recirculating aquaculture system RE Recovered energy SD Standard deviation SGR Specific growth rate T Temperature Number of feeding days TGC Thermal growth coefficient UE Urinary energy ZE Branchial energy Abstract The Goal of the present study was to investigate the effect of varying levels ofdietary protein and energy/lipid on the growth performance, nutrient retention and bodycomposition of fingerling Nile tilapia (Oreochromis niloticus).Therefore nineexperimental diets were formulated to create a series of five different levels of dietaryprotein (33, 36,39, 42 and 45% DM) and a series of five different levels of lipid (5, 7,10, 13 and 16 %DM). The initial body weight of the experimental fish was 2.17 g. Thefish were fed five times a day for 20 experimental days. Best growth rates were obtainedby fish fed a diet containing 38.3 % protein and 10.8 % lipid at a crude protein to grossenergy ratio of 18.2 g CP MJGE. 35.3 % protein and 5.3 % lipid led to significantgrowth reduction in comparison to higher levels of protein and lipid. Energy retentionefficiencies increased linearly with increasing levels of dietary lipid. 1.Introduction Worldwide Nile tilapias (Oreochromis niloticus) are among the most importantfish produced in aquaculture. Its global production volume has increased tremendouslyover the past two decades, which amounted in 1994, 2004 and 2014 to 0.54, 1.75 and5.25 milliontons, respectively.These quantitiesincludeNile tilapiahybrids(Oreochromis niloticus x Oreochromis aureus) and the statistical category Tilapias nei,which constitutes mainly of Nile tilapia (FAO, 2016; RAKOCY, 2016). From this pointof view, solely Grass carps (Ctenopharyngodon idella) are produced in higherquantities. This extension of tilapia production is strongly associated with an increasedusage of commercial compound feeds as well as a variety of agricultural and fisheryproducts and by-products in farm-made feeds (LIM and WEBSTER, 2006). In 1995 about70% of all tilapias produced in aquaculture were fed on compound feeds. This shareincreased to about 90% in 2015 (TACON and METIAN, 2008). Feed costs are a majorexpense in aquaculture. Adequate feeding strategies and feed formulations are crucialfor the economic success and the ecological sustainability of aquaculture. For adequategrowth and maintenance of fish, a regular intake of protein with high quality isessential. At the same time, protein is usually the most expensive component inaquafeeds. Protein not utilizable by fish is lost, and the excretion of nitrogenouscompounds can be a burden to the environment. Therefore formulating aquafeeds, it isof high importance to meet the protein requirements of the fish as close as possible. Thedietary protein requirements of fish for maximum growth are influenced by severalfactors. Besides protein quality (amino acid composition), protein-to-energy balance,protein digestibility of the test ingredients and environmental factors (e.g.Vwatertemperature), the size and life stage of fish affects the dietary protein requirements(WILSON and HALVER, 1986). Generally, small fishes require higher levels of dietaryprotein than larger fishes. A considerable portion of ingested protein is catabolized byfish to meet their energy requirements, and thus cannot be deposited as body protein forgrowth (NRC, 2011). It has been shown, that non-protein energy sources, such as lipidsand carbohydrates, are capable to increase protein and amino acid utilization efficiency,and to “spare” protein for growth. This work investigates the effects of graded levels of protein and energy ongrowth and body composition of Nile tilapia fingerlings. Therefore, a feeding trial wasconducted at the ADTI, HU Berlin. The results are expected to make a contribution to a better understanding of the dietary protein and energy requirements of tilapias.Moreover, this work can also make a contribution to a better understanding of lipidnutrition of tilapias, as graded levels of energy are altered by different inclusion levelsof lipid. 2. Review of Literature 2.1 Overview on Nile tilapias 2.1.1 Taxonomic classification, distribution and anatomy The Nile tilapia belongs to the taxonomic family of the Cichlidae. Cichlids areone of the most species rich fish families comprising more than 1600 valid taxa (DuNZand SCHLIEWEN, 2013). Cichlids naturally inhabit waters in Africa, Latin America andparts of Asia (RIEHL and BAENSCH, 1997). Tilapias are part of the African assemblageof Cichlids. According to SURESH and BHUJEL (2012), the common term “tilapia”includes all species that belong to the genera Tilapia, Sarotherodon and Oreochromis.Although African Cichlids show a large variation of adaptation and occupation ofecological niches, their underlying anatomy is very similar. This makes it difficult fortaxonomists to define evolutionary relationships by using morphological characteristics.Consequentially, the taxonomic classification of Tilapias was often subject of revisionand scientific discussion. andphylogeneticrelationshipsremained unclear(McANDREW,2000). Recently, research using multi-locus DNA analysis led to a betterunderstanding of the phylogenetic relationships of tilapias. A monophyletic clade wasidentified, the Haplotilapiines, as wweellll as several new ttribes and genera. TheHaplotilapiines include tilapias, Haplochromines and other groups of fish. This workalso led to a revision and re-classification of many taxa. The genera Sarotherodon andOreochromis are now classified under a common tribe, the Oreochromini. This includesthe important aquaculture species Oreochromis niloticus. Within the genera Tilapia,only four Species are remaining (DuNz and SCHLIEWEN, 2013; SCHWARZER et al.,2009). All species belonging to the Oreochrominiaree mouthbrooder. WhileSarotherodon are paternal and bi-parental mouthbrooders, Oreochromis are all maternalmouthbrooders (SHELTON and POPMA,2006). Oreochromis niloticus can be sub-dividedinto eight sub-species. These are Oreochromis niloticus niloticus, O.n. eduardianus, O.n. cancellatus, O.n. filoa, O.n. vulcani, O.n. baringoensis, O.n. sugutae and O.n. tana(MCANDREW, 2000). Naturally Nile tilapias inhabit coastal rivers of Israel, the Nile basin and adjacentrivers and lakes, water bodies of the East African rift valley and in Ethiopia, as well asSenegal, Gambia, Niger and Chad river basins in Western Africa (FROESE and PAULY,2016). In the course of the 20h century, and especially between the 1960s and the1980s, Nile tilapias were distributed from Africa to all over the world, mainly to thetropics and sub-tropics, for aquaculture purposes (SHELTON and POPMA, 2006). Sincethen, several local strains and breeds evolved and Nile tilapias have also been focused inselective breeding programs (EKNATH et al., 1993). Nile tilapias have a laterally compressed and oval body shape, which is verytypical for Cichlids. Their lateral line is interrupted by 30-34 cycloid scales and theyshow laterally several more or less distinct dark colored vertical stripes. The caudal finalso shows a series of vertical clearly defined blackish stripes. The backbone consists of30-32 vertebrae. The dorsal and the anal fins carry several soft rays, as well as hardspines. Nile tilapias possess a terminal ending mouth and their jaws carry 3-7 rows ofteeth (FROESE and PAULY, 2016; Ross 2000). 2.1.2 Environmental conditions The Nile tilapia is a tropical species that is generally very adaptive to differentenvironmental conditions and water parameters. Nile tilapias prefer shallow waters.While larger Nile tilapias feed as omnivorous grazers on plankton, aquatic plants andbenthic fauna as well as on detritus and bacterial films, juvenile Nile tilapias mainlyfeed on zooplankton. However, adult Nile tilapias seem to be highly opportunisticfeeders, occupying a large variation of different feeding niches (BEVERIDGE and BAIRD,2000; RAKOCY, 2016). Further, Nile tilapias are a thermophile fish species. Longerexposures to water temperature between 10 and 15°C are critical to them and theycannot survive water temperatures lower than 10 °C. Water temperatures between 22and 30 °℃ are considered to be optimal for growth, feeding and reproduction. Underexperimental conditions, water temperatures of 30 °C yielded best growth rates, whilewater temperature of 22, 26 and 34 ℃ led to reduced growth (AzAZA et al., 2008).Despite being recognized as a freshwater fish species, Nile tilapias can tolerate a widerange of water salinities. When gradually transferred, they can tolerate water salinity up to 3.6 %. Optimal growth is still obtained at water salinity of 0.5 to 1.5 % andreproduction at 1.35 to 2.9% (EL-SAYED, 2006). Further, tilapias are known to toleratevery low levels (0.1-0.5 mg 1’) of dissolved oxygen for various periods of time(EL-SAYED, 2006). Normal respiratory rates of Nile tilapias do not markedly decreaseuntil levels of dissolved oxygen are below 3 to 4 mg/l. In agreement with that, dissolvedoxygen levels below 3-4 mg/l can lead to growth reduction of tilapias (Ross, 2000). 2.1.3 Aquaculture Nile tilapias are produced in a variety of different production systems. Thisincludes semi-intensive and intensive pond production, integrated and polyculturesystems, intensive production in cages, raceways and tanks, as well as production inrecirculating aquaculture systems (RAS). Semi-intensive production of tilapias is oftenadopted by small-scale producers and relies on natural food production of fish ponds,pond fertilization using organic and inorganic fertilizer and supplementary feeding(EL-SAYED,2006). Supplementary feeding in semi-intensive production can be realizedin very different ways and is often highly adapted to local production conditions andenvironments (NG et al., 2013). Supplementary feeds do not have to be nutritionallyfully balanced, as part of the required nutrients is provided by natural-food. Inpolyculture production systems different species are reared together in one productionenvironment in order to utilize synergistic relationships and different feeding niches.Tilapiasareinteraliareared1togetherwith carps,。ClariasSSp2..Ccatfish andshrimps/prawns(e.g. penaeusmonodon) (WANG and LU,2016). In integratedaquaculture systems fish are reared together with land crops and domestic animals, suchas fish culture in flooded rice fields and combined rearing of poultry and fish. Theintensive culture of tilapias is globally expanding and comprises high stocking rates, theexclusive use of commercial compound feed and advanced management practice (EL-SAYED, 2006). According to EL-SAYED (2006) tilapias combine attributes that suitesthem ideally for production in aquaculture, these are: Fast growth Tolerance to a wide range of environmental conditions High resistance to stress and disease Ability to reproduce in captivity and short generation time Feeding on low trophic levels and acceptance of artificial feeds even atvery early life stage In terms of production volume, the Nile tilapia is by far the most importantcultured tilapia species, as it represented approximately 84% of total global aquacultureproduction in 2009 (MJoUN et al.,2010). Further, the majority, about 75 %, of tilapiasare produced in Asia, whereas China is by far the main tilapia producing country(JOSUPEIT,2010). In 2009 about 46 % of global the tilapia production was produced inChina. Other main producing countries are Egypt, Indonesia, the Philippines, Thailandand Brazil (Mjoun, 2010). Whereas tilapia retail products are not well-established inEurope, tilapias were among the five most consumed seafood products in the UnitedStates of America (USA) in 2009. The USA imported about 184 000 tons of tilapiaproducts in 2009, of which about 70 % came from China (MJOUN,2010). 6 Figure 1: Global production of selected groups and species of fish in 1994, 2004 and2014 (data source:FAO,2016) The global tilapia production increased in a peerless manner in the course of thelast two decades. Whereas the tilapia production volume increased almost equally incomparison to other fish species between 1994 and 2004, growth rates of tilapiaproduction increased considerably between 2004 and 2014, and now, tilapia productionexceeds the production volumes of formerly more important fish like Common carp,Silver carp or Salmonids (Figure 1). 2.2 Nutritional physiology 2.2.1 Intestinal physiology and anatomy Nile tilapias are omnivorous freshwater fish, and as such, they feed on a largevariety of different food items. In order to capture, to process and to digest food of verydifferent physiological properties, Nile tilapias obtain a unique and interesting digestivesystem. The anatomy and morphology of the digestive system of fish shows greatvariation among different species. Some fish species like Common carp (Cyprinuscarpio), for instance, do not possess a stomach. The general structure of the digestivetract of fish can be separated into foregut, midgut and hindgut. Whereas the foregutcomprises mouth, pharynx, oesophagus and stomach (NRC, 2011). The digestive stractof Nile tilapias is structured as follows. They possess a terminal ending mouth, acomplex pharyngeal system, a short oesophagus, a rather small stomach and a long andcoiled gut, which is separated from the stomach by a sphincter. In natural environmentsadult Nile tilapias usually acquire a large portion of their food by filter feeding onmicrophagous food like phytoplankton. Nile tilapias are enabled to filter feed, becausetheir gill arches carry several filamentous gill rakers, which allow filter feeding not onlyby mechanical sieving but also by a mucus entrapment mechanism (BEVERIDGE andBAIRD, 2000). The stomach of tilapias is rather small compared to many other fishspecies, which might be a relic of their grazing nature, therefore tilapias are more likelyto show a positive growth response on multiple daily feeding than fish with largerstomachs (NRC, 2011). The pH-value in the stomach of tilapias can be very low, pH-values of 1.4-1.5 were measured regularly in the stomachs of Nile tilapias, and further,theestomachpH of tilapiasseems to be afunction of stomachfullness(GETACHEW, 1989) The highly acidic conditions in the stomach of Nile tilapiasfacilitate lyses of cell walls and digestion of plant materials. Further, pepsinogen, theprecursor for the proteolytic enzyme pepsin, is secreted in the stomach. Tilapias have along and coiled gut and they lack any intestinal caeca, which both is characteristicallyfor omnivorous and herbivorous fish species (SMITH et al.,2000). Further, SMITH et al.(2000) examined the intestinal tract of adult Nile tilapia and identified five principalregions due to their topographical relation. These were designated from cranial tocaudal as the hepatic loop, proximal major coil, gastric loop, distal major coil and十terminalsegment. Thedensityof villiin the intestineOo士fttilapiahybrids (Oreochromis niloticus x Oreochromis aureus) is highest in the hepatic loop anddeclines in the more distal regions of the intestine. The density of mucin producinggoblet cells increases distally. The gut is the place where the majority of nutrients areabsorbed and where the pancreatic enzymes operate that are excreted, as active forms oras proenzymes, together with bicarbonate as pancreatic juice at the entrance of themidgut. In tilapias the absorption of proteins and fatty acids takes place mainly in themore cranial regions of the gut and the pancreatic enzymes trypsin, amylase and lipaseshow also highest activity in the cranial regions of the gut and decline markedly towardsthe more caudal regions (SKLAN et al., 2004a). TENGJAROENKUL et al. (2000)investigated enzyme activities along the intestine of Nile tilapias and noticed that thebrushborder enzymes maltase, peptidase and phosphatase were active along the firstfour more cranial principal regions covering a large proportion of the whole gut length,whereas strongest activity was found in the first three regions. In the terminal end ofthe gut no enzyme activity was identified, indicating that this gut region rather plays arole for the resorption of water and electrolytes. The authors further concluded that thecombination of intestinal length and wide distribution of digestive and absorptiveenzyme activity along the digestive tract contributes to the ability of N. tilapias toefficiently utilize various food items and to their rapid growth rates. Moreover, SKLANet al. (2004a) showed that tilapias can efficiently adapt enzymatically to the diet fed. Incomparison with a no starch containing diet, amylase activity in the intestine of 0.niloticus x O. aureus hybrids was markedly higher, when a starch containing diet wasfed. SUGITA et al. (1997) revealed, that tilapias like other omnivorous fish inhabit highdensities of amylase producing bacteria in there intestine, in contrast to the Japanese eel(Anguilla japonica), a carnivorous species, which showed low densities of thesebacteria. They suggested that intestinal bacteria could be an important source foramylase in the intestine of fish. In the digestive tract of fish, feed is mechanically hackled and grinded,chemically dissolved and homogenized and decomposed by enzymes into metabolizablenutrients that are finally adsorbed by the intestinal mucosa. This process is calleddigestion. The digestibilites of protein, lipid, carbohydrate and energy in various feedingredients in tilapias were investigated by SKLAN et al. (2004b). They showed that intilapias, the crude protein (CP) digestibility ranged between 75.1 % for corn and 99.2 %for sunflower meal. The CP in fish meal, corn gluten meal, soybean meal and full-fatsoybean meal was also highly digestible and showed a digestibility above 90 %. The digestibility of lipid in various feed ingredients ranged between 71.9 and 92.1 %inwheat bran and rapeseed meal, respectively. Carbohydrate showed a digestibilitybetween 32.5 and 80.1 % in wheat bran and corn gluten meal, respectively. Overallenergy digestibility was lowest in wheat bran (38.8%) and highest in fish meal (89.2%). The common feed ingredients wheat and soybean meal showed carbohydratedigestibilities of 71.7 and 65.2 %, respectively, and overall energy digestibilities of 71.9and 84.5 %, respectively. SKLAN et al. (2004b) further showed that, in tilapias, thedigestibility of carbohydrates is negatively correlated to the inclusion level of dietaryfibre and that heat extrusion can increase the carbohydrate digestibility from 60.4 to64.5%. 2.2.2 Protein requirements Proteins are the building blocks of any living organism and they consist of 20proteinogenic amino acids. In fish, the rate of protein deposition does strongly correlatewith their growth rates (DuMAs et al., 2007). In animal nutrition protein is generallyanalysed and displayed as CP in feeds, faeces and carcass samples. The term CP refersto the common analytic procedure were the nitrogen content of a sample is measuredand subsequently the nitrogen content is multiplied by the factor 6.25, which reflects theaverage nitrogen content in proteins. However, the obtained value is referred as CP,because not all nitrogen in organic samples originates from protein and, moreover,proteinss differ, depending ontheir amino acid composition, in tthheeir actualpercentagewise nitrogen contents. Therefore, the CP contents represent more or less anapproximation for the true protein content of a sample and true protein may differ fromCP contents by 10-20% (NRC, 2011). Proteins are present in the tissues of animals asactin and myosin in muscle tissues, as enzymes, as structural important collagens, asimmunoglobulin’s, as membrane proteins or as keratin structures in hair or scales.Amino acids (AA) are small molecules consisting of a carbon skeleton, a nitrogencontaining amino-group and a carboxyl-group. AA are build up in several variousstructures. Aliphatic AA obtain a chain-like structure, whereas alkaline and acidicamino acids obtain a second amino- and carboxyl-group, respectively. Aromatic AAobtain a carbon ring and sulfur containing amino acids contain sulfur atoms within theirstructure. Besides the proteinogenic AA, numerous non-proteinogenic AA exist inorganisms that fulfill inter alia hormonal and/or intermediary metabolic functions. Most plants and microorganisms are able to synthesize all 20 proteinogenic AA out of lower-molecular compounds in their metabolism. In contrast to that, animals are not able tosynthesize all proteinogenic AA. Some animals, like ruminants, have evolved a specialdigestive tract that inhabits symbiotic microorganisms, which are able produce all AAthe animal requires. But most animals must take up the AA they cannot synthesize withtheir food. AA, which cannot be synthesized by animals, are referred as essential aminoacids (EAA). For fish, 10 AA are considered to be essential. These are arginine,histidine, isoleucine, leucine, lysine, methionine, phenylalanine, threonine, tryptophanand valine (NRC, 2011). NosE et al. (1974) identified these amino acids as beingessential for Carp (Cyprinus carpio). Tyrosine and cysteine can only be synthesized onthe basis of the EAA phenylalanine and methionine, respectively. Therefore these AAare referred as being semi-essential for fish. AA form peptides and proteins by theformation of peptide-bonds, where the amino-group of one AA connects to thecarboxyl-group of another AA by dehydration. As protein constitutes of AA, it is oftenstated that fish rather have a requirement for AA, than for protein per se. The AArequirements of fish generally reflect to high degree the AA acid whole body profile ofthe corresponding fish (NRC, 2011). Diets for fish should contain protein, thatpreferably closely reflects the “ideal-protein" for the fish fed, and that is well balancedregarding its EAA profile. If the dietary AA profile is not well balanced and one ormore AA are supplied in a deficient amount, then these AA hamper the buildup of newtissue protein, they are the limiting AA. In fish feeds lysine is generally the first limitingAA (WILSON, 2002), especially in diets that contain higher amounts of plant proteinsources. COwEY (1994) mentioned that the AA acid profiles of fish bodies do not differvery much among different species and that therefore previously reported differences inthe AA requirements are partially attributable to methodological aspects of therequirement determination. Such methodological aspects could be the macronutrientcomposition of experimental diets, statistical methods or the mode how to express theAA requirements. AA requirements can be percentagewise expressed on the basis ofeither dietary dry matter (DM), digestible energy (DE) or dietary CP. ENCARNACAO etal. (2004) showed that in Rainbow trout, lysine requirements were not affected by theDE content of the diet, as lysine utilization was positively affected by dietary DE.Therefore, to express AA requirements on the basis of dietary DE might not beappropriate in fish. Further, HUA (2013) showed in a meta-analytic study, thatexpressing AA requirements on the basis of dietary CP is probably the most appropriate mode for percentagewise expression. However, accordingly to NRC (2011) the dietaryEAA requirements for Nile tilapias are 1.2, 1.0, 1.0,1.9,1.6,1.0,1.6,1.1,0.3 and 1.5%of DM for arginine, histidine, isoleucine, leucine, lysine, methionine+cystine,phenylanaline+tyrosine, threonine, tryphthophan and valine, respectively. Compared toEAA requirements of the important aquaculture species Atlantic salmon (Salmo salar)and Common carp, Nile tilapias seem to have a slightly reduced requirement forarginine and lysine, and a slightly higher requirement for leucine. However, a well-balanced EAA composition of the dietary protein is necessary in order to achieveoptimal results when fish are cultured. Fish need to take up protein and AA in order to build up new tissue for growthor reproduction and for the replacement of existing protein (maintenance) (WILSON,2002). In fast growing fish the protein requirements for optimal growth are generallymuch higher than for maintenance. KAUSHIK et al. (1995) found out, that Nile tilapiajuveniles require 12 g protein kg bodyweight (BW) day for maximum protein gainand about 2 g protein kg BW day for maintenance. RODEHUTSCORD et al. (1997)revealed that the ratios for maintenance requirements in relation to the requirement foroptimal growth differ among EAA. For instance just 4 % of the optimally suppliedlysine is required for maintenance, whereas for tryptophan 30 % of the total requirementfor proteindeposition is required for maintenance in Rainbow trout(Oncorhynchus mykiss). The digestion of ingested dietary protein takes place in the stomach and in thegut of fish. The breakdown of proteins into low-molecular peptides and AA isfacilitated by the stomach protease pepsin and the pancreatic proteases. Peptidasesassociated to the intestinal mucosa further facilitate the breakdown of petides into AA.AA and also some peptides are adsorbed by the intestinal membrane either by activemembrane transporters or by passive diffusion along a concentration gradient (NRC,2011). Adsorbed AA enter the pool of free AA in the fish’s organsism. Free AA caneither be used for the synthesis of new body protein (growth), for the replacement ofbody protein (maintenance), for the synthesis of glucose and lipid or can be catabolizedfor the production of energy in the citric acid cycle (DABROWSKI and GUDERLEY, 2002).The catabolism of AA can be divided into inevitable AA catabolism, preferential AAcatabolism and catabolism of excess AA (NRC, 2011). Inevitable AA catabolismdescribes the degradation of AA that cannot be down regulated by the metabolism and itstill occurs when energy supply is not limiting protein synthesis and AA intake is below the requirement for maximum protein deposition. It can be estimated that about 20-40% of digestible AA supplied above maintenance AA requirements are suspected toinevitable AA catabolism (NRC, 2011). The term preferential catabolism AA describesthe catabolism of AA, when dietary energy is limiting growth/protein deposition, inorder to provide more energy. In this case, AA are actively steered away from proteinsynthesis towards degradation for energy needs. When AA are supplied in excess of theamount required for maintenance, growth/protein deposition, inevitable and preferentialcatabolism, than this would lead to additional catabolism of AA (NRC,2011). The relative protein requirements for optimal growth as a percentage of a dietare affected by a series of factors. Besides dietary energy content, protein digestibilityand AA composition of the dietary protein, does the fish size and life stage play animportant role for the protein needs of fish. Younger fish generally require higheramounts of dietary protein than older fish. This can be attributed to the high growthrates and protein systhesis rates at the early life stages of fish (DABROWSKI andGUDERLEY, 2002). EINEN and ROEM (1997) found out that larger Atlantic salmonrequire less dietary protein and also a lower dietary protein to energy ratio to acquirehighest growth rates as smaller fish of the same species. Further, ABDEL-TAWWAB et al.(2010) showed that Nile tilapia fry required 45 % dietary protein for optimum growth,whereas advanced juveniles of the same species reached best growth rates already atdietary protein inclusion level of 35%. It has often been stated that fish have relatively high protein requirements inrelation to terrestrial farmed animals. But this is only true for the relative proportion ofprotein in the diets. Absolute dietary protein requirements of fish and terrestrial animalsgenerally do not differ very much. The relatively higher protein requirements of fish asa proportion of the diet are explained by the lower energy requirements of fish formaintenance. The energy requirements of fish are lower in relation to terrestrial animals,because, as poikilotherms, they do not expend much energy for the control of bodytemperature. Further, the majority of catabolic nitrogen is excreted as ammonia in fish,in contrast to land animals, which excrete nitrogen on the more metabolic energyrequiring pathway as urea (KAUSHIK and SEILIEZ, 2010). Therefore, fish show higherprotein requirements as a percentage of the diet, but higher feed conversion efficienciesand similar protein retention efficiencies in comparison to terrestrial animals (WILSON,2002). Tilapias, in general, require lower inclusion levels of dietary protein than manyother fish species. The recommend dietary protein levels for fish weighing less than 20g is 40 % for Nile tilapias, whereas for Channel catfish (Ictalurus punctatus), Commoncarp, Atlantic salmon, Rainbow trout, Gilthead sea bream (Sparus auratus) andEuropean seabass (Dicentrarchus labrax) of the same size class, 44, 45, 48, 48,50 and55 % dietary protein, respectively, is recommended (NRC, 2011). VAN TRUNG et al.(2011) mentioned that tilapias do not differ very much from other fish species, evencarnivorous species, in terms of optimal dietary digestible protein to digestible energyratio and that the lower percentagewise dietary protein requirements of tilapias are aresult of the ability of tilapias to efficiently digest and utilize dietary starch, which inturn, enables this species to use low-energy density diets effectively. Feeding on low-energy and protein density diets would mean that tilapias must ingest more feed in orderto approach similar or even higher growth rates in comparison to fish species that feedon diets with higher energy and protein density. This thought is going to be supportedby the findings of FIGUEIREDO-SILVA et al. (2013) where similar diets were fed toRainbow trout and Nile tilapias. Here, food intake of Nile tilapias was markedly higherthan for Rainbow trout, noticing that Rainbow trout were, due to their environmentaladaption as a cold water fish, reared at much lower temperatures in comparison totilapias. However, the impact of different feeding strategies, ecological adaptions,feeding rates and macronutrient compositions of feeds on the protein utilization andprotein requirements in various fish species seems to be an interesting objective forfurther research. 2.2.3 Energy requirements All animals, and hence fish, must take up chemically bound energy with theirfood in order to sustain vital physiological processes and functions. In nutritionalscience, the term gross energy (GE) refers to the amount of enthalpy that is gained bycombustion of a substance. The GE content of a substance is usually measured in abomb calorimeter, where the substance is combusted under high pressure in an oxygenatmosphere. Proteins, lipids and carbohydrates all contain different amounts of GE.Mean values for the content of GE are 17.2, 23.6 and 39.5 MJ kg for carbohydrates,proteins and lipids, respectively (NRC, 2011). Energy requirements and contents are commonly expressed in calories or joule. Traditionally, in nutritional science, thecalorie is the most common unit for energy, but recently it has become more popular touse the joule as kilo joule (kJ) or mega joule (MJ) to express a certain amount ofenergy. GE that is taken up with food by animals can undergo many different fates andpathways. It can be excreted as urinary or fecal energy, completely oxidized for theprovision of metabolic energy or incorporated into body tissues. The National ResearchCouncil established a common framework and terminology for the partitioning andutilization of dietary energy by animals in 1981, which has been widely adopted inanimal, and hence also in fish nutrition. The framework divides the ingested energy (IE)into digestible energy (DE), metabolizable energy (ME), net energy (NE) and recoveredenergy (RE), whereas DE, ME, NE and RE are defined by IE - fecal energy, DE -(urinary energy (UE) + branchial energy (ZE)), ME - heat increment of feeding (H;E)and NE - (basal metabolism (HE) + voluntary activity (HjE)), respectively (NRC,2011). This framework is the basis for a series of approaches to partition and determinethe energy requirements of animals, as well as to predict feed input and output ofwastes. Another concept that has been added to this framework is the amount of energythat is needed for maintenance, referred as maintenance energy (HEm). HEm is definedas the intake of ME that is necessary, so that RE equals zero. Theoretically, HEmconstitutes of HE + HE for the required amount of feeding to maintain zero growth(NRC, 2011). The percentage of IE that can be provided to tilapias as DE by differentfeedstuffs was already mentioned in chapter 2.1.1. Commonly, the energy requirementsof fish for growth and maintenance are evaluated on the basis of the DE content of adiet, although a net energy evaluation system, which takes different energy utilizationefficiencies of the different macronutrients protein, lipid and carbohydrate into account,might be beneficial in fish (SCHRAMA et al., 2012). CHOWDHURY et al. (2013) proposeda factorial model for tilapias to predict feed requirement and waste output. According totheir model, in fish with a bodyweight of 2 g, 11.9 MJ DE are required to achieve 1kgof body weight gain, which results in the accretion of 6.43 MJ RE whereas 1.30, 3.48and 0.64 MJ are required for HE, H;E and UE+ZE, respectively. The proportion of DEenergy that is used for HE is higher in larger fish as in smaller fish, therefore accordingto the factorial model 14.6 MJ DE are required to obtain 1 kg body weight gain in 200 gfish. It must be noted that energy uptake and partitioning of fish can be highly variableand depends on a lot of factors such as dietary protein content, type of energy source,environmental condition, fish health and condition, growth rates and feed intake, which also interdepend each other. Therefore, predictions that are made by a bioenergeticsmodel for a specific situation or environment cannot easily be transferred to othersituations. For instance, it has been shown that the dietary nutrient composition affectsas well feed and DE intake as energy utilization efficiency in tilapias (SCHRAMA et al.,2012; TRAN-DuY et al.,2008). The requirement for HE is generally a function of watertemperature and bodyweight (CHOWDHURY et al., 2013). The influence of body weighton H E can be reflected appropriately by the exponent 0.80. Therefore basal energyrequirements of fish are most often expressed on the basis of the unit metabolic bodyweight (MBW) in kg0.80.ILUPATSCH et al. (2010) calculated the HEm (maintenancerequirements) for female egg producing tilapia and determined a value of 59.5 kJ DEkg-0.80day.VAN TRUNG et al. (2011) determined 25.9 kJ DE kg-0.80dayasmaintenance requirements for Nile tilapias. MEYER-BURGDORFF et al. (1989) observed amaintenance energy requirement for Nile tilapia of 57 kJ ME kg-0.80 day. The energyrequirements for growth are generally determined by using the partial efficiencies ofenergy utilization for growth, protein and lipid deposition (NRC, 2011). When partialenergy utilization efficiencies, expectable growth rates and the body composition of afish are established, the energy requirements can be calculated on this basis. SCHRAMAet al. (2012) determined partial utilization efficiencies for DE of 0.663 and 0.561 for adiet that contained high amounts of lipid and a diet containing high amounts of starch,respectively. According to NRC (2011), a typical diet for Nile tilapias contains about14.2 MJ DE kg feed at a digestible protein level of 29 %. 2.2.4 Lipid requirements Lipids are a group of molecules that include among others fats, phospholipids,waxes and steroids. Phospholipids, for instance, are an integral component of semi-permeable cell membranes. Fats are carbonesters from glycerol and one, two or threefatty acids, which are termed mono-, di-, or triglycerides, respectively. Whereas mono-and diglycerides play a role in the intermediary metabolism, triglycerides are the mainconstituent of storage fat in plants and animals. The two main functions of dietary lipidare the provision of metabolitic energy and essential fatty acids (JAUNCY, 2000).Therefore, the dietary lipid requirements can be divided into dietary lipid requirementsto provide nutritional optimal amounts of energy and requirements for fatty acids. Fat is a highly dense source of dietary energy for fish. Moreover, lipids aregenerally highly digestible. Increasing the level of dietary lipid in fish feeds has beenshown increase the protein utilization efficiency and feed efficiency in many fishspecies. Moreover, an increment of dietary lipid can help to reduce the excretion ofsolid matter and ammonia by fish. Extrusion pelleting technique allowed increasingdietary lipid contents markedly (EINEN and ROEM, 1997). However, the use of lipids intilapia feeds to provide dietary energy use seems to be limited. According to EL-SAYED(2006) tilapias require about 10-15% dietary lipid. Many other fish species, especiallyCcarnivorous coldwater species, showa positive response of growth and proteinutilization to much higher dietary lipid levels of 20-40 % (NRC, 2011). For instanceHEMRE and SANDNES (1999) observed a growth improvement of Atlantic salmon whendietary lipid levels were increased from 31 to 37 %. They further suggested that theupper limit for dietary lipid inclusion in Atlantic salmon may lie somewhere between 37and 47 %. However, upper limits for lipid inclusion in lipid diets are much lower.JAUNCY (2000) reported that dietary lipid levels beyond 12 % led to growth depressionof Oreochromis aureus x Oreochromis niloticus hybrids. The causes and physiologicalreasons for the differences regarding the abilities and limitations to utilize dietary lipidsacross different fish species seem to remain unclear and might be worth furtherresearch. Fatty acids consist of a carbon chain with a terminal carboxyl-group. One ormore carbon bonds of the carbon chain can be desaturated and form a double bond. Thestructure of fattyyacids 1Sof particular importance for the propertiesSOof thecorresponding fat or oil. The length of the carbon chain and the number of doublebonds in a fatty acid determines the melting point and the fluidity of the fat. Longercarbon chains lead to lower fluidity and a higher melting point, whereas increasingnumbers of double bonds have the opposite effect. Polyunsatured fatty acids (PUFA)have more than one double bond and cannot be synthesized by vertebrates, and thus byfish. Moreover, PUFA are grouped into n-3 and n-6 PUFA, corresponding to theposition of the first double bond counting from the terminal end of the fatty acid. PUFAhave a number of essential functions, for instance as part of cell membranes and in thecentral nervous system (SIMON, 2008). Due to their essential physiological function anddue to the fact that fish are not capable to synthesize them, an absolute dietaryrequirement for these fatty acids exists. These fatty acids are termed as essential fattyacids (EFA) (NRC, 2011). Fish species differ in their requirement for specific fatty acids and in their capability to convert PUFA into long chain PUFA (LC-PUFA). Theconversion of basic PUFA into LC-PUFA takes place by elongation and desaturation inthe metabolism. Thereby, PUFA of the n-3 and the n-6 group can only be converted intoLC-PUFA of the same group. Important LC-PUFA are the Eicosapentaenoic acid (EPA,20:5n-3) and the Docosahexaenoic acid (DHA, 22:6n-3). Although fish, in contrast toterrestrial animals, generally have a higher dietary requirement for n-3 than for n-6PUFA, Arachidonic acid (20:4n-6) plays a physiological important role in fish(SARGENT et al., 1999). Differences between species presumably reflect a metabolicadaption to the specific prevalence of fatty acids in the corresponding food webs andnatural occurring food sources (NRC, 2011). SARGENT et al. (1999) stated that dietaryrequirements for specific PUFA cannot be viewed in an isolated manner, because thereare certain interactional and competitive physiological relationships among PUFA,interalia related to the formation of eicosanoid hormones and the conversion of linolenicacid (LNA, 18:3n-3) and linoleic acid (LA, 18:2n-6) to LC-PUFA. Therefore, theysuggest that it is more appropriate to define dietary requirements for EFA as a ratio ofcertain EFA. rather than in absolute terms. Moreover, there seem to be vital differencesfor specific EFA requirements across life stages and developmental phases of fish. Thecapability to convert n-3 PUFA into physiological important LC-PUFA is restricted inmarine fish species. Therefore marine fish species have an absolute dietary requirementfor specific LC-PUFA, while freshwater/diadromous fish are generally capable toconvert PUFA into LC-PUFA, although also in freshwater fish growth can be improvedby the inclusion of dietary LC-PUFA. Among freshwater fish, warmwater species tendto require higher n-6:n-3 PUFA ratios than coldwater/diadromous species (NRC, 2011;STICKNEY and HARDY, 1989). Besides their essential relevance for a vital growth of fish,fatty acids have also an important impact on the quality and composition of fishproducts. BAHURMIZ and NG (2007) showed that the dietary fatty acid compositionstrongly influences the carcass fatty acid composition in tilapias. The same effect hasbeen shown for several other fish species. This is of high relevance, because the highcontent of DHA and EPA in fish products is a strong argument for human fishconsumption. Moreover, IZQUIERDO et al. (2005) showed in a study with Giltheadseabream (Spaurus aurata) that the type of lipid source has an effect on the fish fleshand fillet quality regarding texture and taste. Tilapias, as warmwater species, require adietary level of about 0.5 to 1.0 %n-6 PUFA and also n-3 PUFA (NRC, 2011). NG ANDCHONG (2004) suggest that tilapia feeds should contain about 0.5 to 1.0 % of both, n-3 and n-6 PUFA. Although OLSEN et al. (1990) confirmed that Tilapias are able to convertLNA and LA into LC-PUFA, NG and CHONG (2004) mentioned that the desaturationand elongation of LNA and LA to LC-PUFA might be insufficient in Tilapia, andtherefore, a certain dietary supply of LC-PUFA might be necessary. 3. Material and methods 3.1 Experimental system and fish The feeding trial for this study was conducted at the Aquaculture NutritionLaboratory located at the Faculty of Life Sciences of the Humboldt-University Berlin.The Aquaculture Nutrition Laboratory comprises a recirculation aquaculture system(RAS), where the fish were kept during the experiment. The RAS comprises 30 GFRPfish tanks with a volume of 200 1 each. The fish tanks (Figure 2) are designed as roundtanks with a conical bottom and a circulating flow pattern, to allow hydraulic self-cleaning. The water renewal rate for each tank averaged 4.82±0.70 1 min’. Each tankwas aerated by a diffusor stone. All diffusor stones were connected to a Hiblow HP 200membrane pump. All tanks were covered with nets to prevent fish loss. Further, theRAS comprises a drum-filter unit (Faivre-Sarl 02-040), a moving-bed filter, a tricklingfilter and a UV-System (ABOX S 120) for water cleaning and disinfection. During theexperiment about 30 % of the RAS water was exchanged on a daily basis to maintaingood water quality. Water temperature, Ammonia (NH) and Nitrite (NO2) weremonitored daily. Water temperature averaged 27.6±0.3 C, whereas NH and NO2averaged 0.008±0.007 mg1 and 0.14±0.15 mg 1, respectively. Dissolved oxygenconcentrations of RAS water were maintained above 6.5 mg 1 throughout theexperiment. Juvenile Nile tilapias were provided by TilAqua International, Netherlands. Allfish were natural males of the TilAqua silver strain, which are produced by using theYY-technology. The fish were stocked into the experimental system with a meanbodyweight of about 0.2 g and were fed 5 times a day with a commercial feed (Gemma0.5 mm, Skretting) for 22 days until the fish reached a mean bodyweight of about 2 gbefore starting the feeding trial. Figure 2: Experimental tank setup; 1= automatic feeder; 2=waterinlet; 3 =aeration; 4 = water outlet 3.2 Experimental diets In order to investigate the response of Nile tilapia fingerlings to different levelsof dietary protein and energy/lipid an experimental design was selected, which allowedto derive two dose-response relationships out of one feeding trial. Therefore nineexperimental diets (Table 1) were formulated. Five diets (Diet 33/10, 36/10, 39/10,42/10 and 45/10) were formulated to contain 33, 36, 39, 42 and 45 % protein and 10 %lipid. Another four diets (Diet 39/5,39/7, 39/13 and 39/16) were formulated to contain39 % protein and 5, 7, 13, and 16 % dietary lipid. This formulation of experimentaldiets allows to derive one sequence of five graded levels of protein and one sequence offive graded levels of lipid/energy, because diet 39/10 can be included into bothsequences. The dietary protein content of the nine experimental diets was altered by theinclusion of varying amounts of soy bean meal, wheat gluten meal and soy proteinconcentrate, whereas the dietary content of energy/ was altered by the inclusion ofvarying amounts of rapeseed and fish oil. All experimental diets were pressed as sinkingpellets. The diameter of these pellets was 1.6 mm. In addition to the nine experimentaldiets, a commercial diet (Tomboy Micro 80, 0.8 mm, floating) was fed in the feedingtrial, in order to compare the experimental diets with a commercial diet. Proximate analysis of the experimental diets showed that Diet 33/10, 36/10,39/10, 42/10 and 45/10 actually contained 35.3,38.3,39.9,42.6 and 45.77%CPrespectively. Diet 39/5, 39/7, 39/13 and 39/16 contained between 39.4 and 40.3%CP.The actual crude lipid (CL) content of Diet 39/5,39/7, 39/10,39/13 and 39/16 was 5.3,7.4, 10.6, 13.1 and 16.0 % respectively. Diet 33/10, 36/10, 42/10 and 45/10 containedbetween 10.5 and 10.8% CL. The gross energy (GE) content was 20.8, 21.0, 21.1,21.2,21.4, 19.9, 20.3,21.6 and 22.3 MJ kg for Diet 33/10, 36/10,39/10,42/10, 45/10, 39/5,39/7, 39/13 and 39/16 respectively. The CP/GE-ratio was 17.0, 18.2,18.9,20.1,21.3,20.2, 19.4, 18.4 and 17.9 g CP MJGE respectively for these diets. The commercialdiet contained 47.4 % CP, 7.8% CL, 20.5 MJ kg and 23.2 g CP MJGE. Table 1 Formulation and proximate composition of experimental diets Protein/Lipid Commer- cial diet 33/10 36/10 39/10 42/10 45/10 39/5 39/7 39/13 39/16 Ingredients (%) Wheat 56.3 50.1 43.9 37.7 31.5 49.9 47.6 40.2 36.5 Hi-pro soya 6.0 8.0 10.0 12.0 14.0 10.0 10.0 10.0 10.0 Wheat gluten 5.0 6.9 9.1 11.3 13.6 8.1 8.5 9.7 10.4 Soya protein concentrate 5.0 7.0 9.0 11.0 13.0 9.0 9.0 9.0 9.0 FM North-Atlantic 21.0 21.4 21.4 21.4 21.4 21.4 21.4 21.4 21.4 Rapeseed oil 3.5 3.5 3.5 3.4 0.0 1.3 5.6 7.8 Fishoil North-Atlantic 1.5 1.5 1.5 1.5 0.0 0.6 2.4 3.3 Yttrium premix 3巧巧 0.1 0.1 0.1 0.1 0.1 0.1 0.1 0.1 Premix Vit/Min 1.5 1.5 1.5 1.5 1.5 1.5 1.5 1.5 Pellet diameter (mm) 1.6 1.6 1.6 1.6 1.6 1.6 1.6 1.6 1.6 0.8 Proximate composition (%DM) Dry matter 89.2 89.0 89.2 89.7 89.8 88.4 88.7 89.8 90.3 90.5 Crude protein 35.3 38.3 39.9 42.6 45.7 40.3 39.4 39.7 39.9 47.4 Crude lipid 10.5 10.8 10.6 10.7 10.8 5.3 7.4 13.1 16.0 7.8 Ash' 5.8 6.0 6.1 6.2 6.4 6.1 6.1 6.1 6.1 8.8 NFE+ CF 48.4 44.9 43.4 40.5 37.2 48.3 47.1 41.1 38.0 35.9 GE(MJkgDM) 20.8 21.0 21.1 21.2 21.4 19.9 20.3 21.6 22.3 20.5 CP/GE* 17.0 18.2 18.9 20.1 21.3 20.2 19.4 18.4 17.9 23.2 Nitrogen-free extract + crude fibre; calculated by: 100 - (crude protein + crude lipid+ash). Gross energy; calculated based on combustion values after NRC (2011) as protein = 23.6 MJ/kg, lipids =39.5 MJ/kg and carbohydrates = 17.2 MJ/kg. 4 Crude protein to gross energy ratio (g protein MJgross energy) 3.3 Feeding trial At the beginning of the experiment 100 Nile tilapia fingerlings were weighedand distributed to each tank of the experimental system. The mean initial body weightof the experimental fish waLsS2.17±0.03g. The nine experimental diets and thecommercial diet were randomly allotted to triplicate groups of tanks. The fish were fed5 times per day every 2 hours between 8:00 am and 4:00 pm for 20 days. The first andthe last feeding of each day were carried out manually. 3 times per day the fish were fedby automatic feeders (Automatic Feeder 3581, Eheim). Once a week feeding wascarried out solely by hand in order to monitor feed intake and to adjust automaticfeeders accordingly. Fish were fed in excess of satiation to achieve an ad libitum likefeeding scheme. The quantity of feed distributed to fish by automatic feeders and byhand was recorded every day for each tank. During the feeding trial a naturalphotoperiod of 12 hours day/night was adopted. 3.4 Sampling & chemical analysis After the feeding trial all fish were euthanized with an overdose of MS-222(Sigma-Aldrich) and all fish were weighed individually. Subsequently all fish of eachtank were pooled together and were stored at -18C. In order to determine the initialbody composition, a representative sample of approximately 300 fish was taken at thebeginning of the feeding trial and also stored at -18 C. The initial carcass sample andthe final carcass samples were sent on dry ice in polystyrene boxes to SkrettingAquaculture Research Centre (ARC) laboratory in Stavanger, Norway, where proximateanalysis was conducted. The Skretting ARC laboratory is accredited according to ISO9001. The crude lipid (CL) content of the carcass samples was analysed in a Soxthermand a Hydrotherm apparatus (C. Gerhardt - analytical instruments) by petroleum etherextraction with prior hydrochloric acid hydrolysis using a modified version of theAOCS method BA3-38. The CL content of feed was determined by nuclear magneticresonance analysis (NMR). CP of the fish samples and feed was determined accordingto Kjeldahl NMKL method 6, 4" Edition, 2003. DM and crude ash (CA) contents offish samples were determined gravimetrically following the NMKL method 23, 3md Edition, 1991. GE contents of experimental diets and fish samples were calculated onthe basis of the values or combustion energy published by the NRC (2011). 3.5 Calculation of parameters All parameter in this study were calculated as follows: Final body weight (FBW) (g) —Sum of individual final bodyweightfinal number of fishBody weight gain (BWG) (g) =FBW-IBWThermal growth coefficient (TGC) BW-BW)×100TXtlnFBWSpecific growth rate (SGR) (%/day)--lnnLEw)×100 Where T is the average temperature (C) during the feeding trial, t is the number offeeding days and IBW is calculated by: initial bulk weight/initial number of fish. Feed intake (g fish) (FI) was calculated for each tank as the sum of the average feedintake per fish of each experimental day. BWGFeed efficiency (FE)-×100FIdiCP intake (g fish)二 e ta r y CP ( % we t w e ig ht )×FI100CP gain (g fish)=(final body CP*FBW)-(initial body CP*IBW)protein gainProtein retention efficiency (PRE)(%)-×100protein intakeGE intake (kJ fish)=(dietary GE ( wet weight) ×FI)×1000GE gain (kJ fish )= (final body GE ×FBW)- (initial body GE ×IBW)Energy retention efficiency: ERE (%)二energy gain-×100energy intake 3.6 Statistics All data that is presented in the result section in Tables 2, 3, 4, 5, and 6 ispresented as mean values of the triplicate feeding groups (n=3)± standard deviation(SD). A One-way Analysis of Variance (ANOVA) was performed for parameters ofgrowth performance, nutrient retention efficiencies and body composition to determinedifferences between graded levels of protein and between graded levels of energy/lipid,respectively. The same procedure was executed for CP intake and CP gain in responseto graded levels of dietary protein, as well as for GE intake and GE gain in response tograded levels of energy/lipid. If significant differences (p <0.05) between treatmentswere found, the Tukey-HSD multiple comparison procedure was executed. A linear andquadratic contrast analysis was performed for all parameters to determine polynomialtrends (p<0.05). All data was tested for homogeneity of variances by Levenes-test. Ifthe assumption of homogeneity of variances could not be accepted, the non-parametricprocedure by Kruskal-Wallis, instead of ANOVA, and the polynomial contrast analysisnot assuming homogeneity of varianceswere executed. Because individual finalbodyweights for all experimental fish were known, a nested ANOVA design waschosen for the parameter FBW in order to achieve a better test strength. For FBW theScheffe post-hoc procedure was used, due to unbalanced sample size. Further, meanvalues and 95 % confidence intervals for FBW in response to different levels of proteinand energy/lipid are presented graphically. Statistical analysis was performed using theSPSS 14.0 statistical software package. Two models were used to deduct the protein requirements from the growthresponse by non-linear regression analysis. TGC was selected as response variable.These were the exponential model and the four-parameter-logistic-model, which werederived from HUA (2013). The exponential model is described by: , where y is the response variable (TGC), x is the independent factor (Protein %), a isthe plateau of the curve, b characterizes the steepness of the curve and c is the interceptwith the x-axis. The four-parameter-logistic model is described by: where y is the response variable (TGC), x is the independent factor (dietaryconcentration) (Protein %), a is the plateau of the curve, d is the intercept of the y-axis,k is the scaling parameter that scales x, and m is the shaping parameter that locates theinflection point. The parameter estimation for the dose-response models was conducted using thenon-linear procedure in SPSS 14.0 and graphs of the non-linear regressions wereproduced, using Microsoft excel. In order to deduct the requirement from the estimateddose-response models, equations were solved by using Mathematica. 4.Results 4.1 Growth, feed intake and utilization efficiency Fish mortality was very low during the experiment. Throughout the wholeexperimental phase only two fish died, the remaining individuals were generally healthyand stayed in good condition. FBW, BWG, SGR, TGC, FI, FE, PRE and ERE averaged 11.97±0.3 g,9.81±0.4g, 8.56±0.2,0.180±0.005, 8.35±0.6 g fish , 117.71±4.4,39.8±1.0% and 45.7±0.4% forfish fed the commercial diet, respectively. In comparison to fish fed the experimentaldiets, growth performance of fish fed the commercial diet was intermediate. Fish fed onthe commercial diet showed better growth than fish fed Diet 33/10 and 39/5, but lessgrowth than fish fed the remaining experimental diets. Further, fish fed on thecommercial diet showed average FI and high FE in comparison to fish fed experimentaldiets. Only fish fed on Diet 45/10 and 39/16 showed higher FE. Growth performance and nutrient retention efficiencies of Nile tilapia fingerlingsin response to graded levels of protein are presented in Table 2. Among different levelsof protein, diet 36/10 produced best growth rates. Fish fed this diet showed highestFBW, BWG, SGR and TGC. Diet 33/10 led to significantly reduced FBW incomparison to diets containing higher levels of dietary protein. Growth of fish fed diet39/10, 42/10 and 45/10 showed a slight, but not significant, growth reduction in comparison to fish fed Diet 36/10. FBW of Nile tilapia fingerlings in response todifferent levels of protein is presented graphically in Figure 3. Polynomial contrastanalysis revealed a significant quadratic response of SGR and TGC to graded levels ofprotein. Diet 36/10 resulted in the highest and diet 33/10 in the lowest FI among fish fedgraded levels of protein, but here, no significant differences were found. Fish fed Diet33/10 showed lowest FE among fish fed diets containing graded levels of protein andsignificantly lower FE than fish fed Diet 36/10, 39/10 and 45/10. Moreover, asignificant positive linear trend was observed for FE in response to graded levels ofdietary protein. PRE was highest for fish fed Diet 36/10. Higher amounts of dietaryprotein led to decreased PRE, while fish fed Diet 45/10 showed a significantly reducedPRE in comparison to Diet 33/10, 36/10 and 39/10. A significant negative linearresponse of PRE to graded levels of protein was determined by polynomial contrastanalysis. A quadratic response was observed for the ERE of fish fed graded levels ofprotein. BWG, FE, PRE and ERE in response to graded levels of protein are presentedgraphically in Figure 4, 5, 6 and 7, respectively. Growth performance, FI, FE and nutrient retention efficiencies of Nile tilapiafingerlings in response to graded levels of energy/lipid are presented in Table 3. Thenested ANOVA analysis revealed a statistical significant effect of different dietary lipidlevels on the FBW of Nile tilapia fingerlings. Fish fed diet 39/5 showed a significantlyreduced FBW in comparison to fish fed Diets 39/10 and 39/13. However, BWG, SGRand TGC showed no significant response to graded levels of dietary lipid, probably dueto smaller sample size and different ANOVA design. Figure 8 shows the growthresponse of the experimental fish to different levels of lipid. FI and PRE were notaffected by dietary energy/lipid levels, while FE and ERE showed a significant positivelinear trend in response to graded levels of dietary energy/lipid. BWG, FE and ERE inresponse to different levels energy/lipid are presented graphically in Figures 9, 10 and11, respectively. Table 2: Growth and utilization efficiencies of Nile tilapia fingerlings in response to graded levels of protein (mean ± SD) Diet P/L FBW(g) BWG(g) SGR TGC FI (g/fish) FE PRE(%) ERE (%) 33/10 10.75±0.8 8.57±0.8 7.98±0.4 0.165±0.010° 8.08±0.80 106.15±2.71° 47.3±1.2 44.06±1.1 36/10 13.03±0.5° 10.86±0.5° 8.94±0.2 0.191±0.006° 9.39±0.44 115.54±0.49° 47.8±0.7 47.74±0.4 39/10 12.30±0.3° 10.12±0.3a,b 8.67±0.1a,b 0.184±0.003a,b 8.74±0.19 115.90±1.14° 47.4±2.3 46.64±1.5 42/10 12.20±0.7° 10.02±0.7a,b )a,b 8.58±0.3a,b ,b 0.182±0.008 8.86±0.48 112.96±1.98a,b 43.9±1.2a, 46.18±1.5 45/10 12.35±1.2° 10.18±1.2a,b 8.66±0.5a,b 0.184±0.014a,b 8.62±0.72 117.86±5.77° 42.9±1.6° 46.02±1.4 Anova D<0.05 p<0.05 p<0.05 p<0.05 n.s. p<0.05 D<0.05 n.s. Polynomial contrast Linear n.s. n.s. n.s. n.s. n.s. p<0.05 p<0.05 n.s. Quadratic n.s. n.s. p<0.05 p<0.05 n.s. n.s. n.s. p<0.05 Different superscripts indicate significant differences between dietary treatments Table 3: Growth and utilization efficiencies of Nile tilapia fingerlings in response to graded levels of lipid (mean ± SD) Diet P/L FBW(g) BWG(g) SGR TGC FI (g/fish) FE PRE (%) ERE (%) 39/5 11.30±0.5° 9.16±0.5 8.31±0.2 0.173±0.005 8.39±0.11 109.19±4.58a,D 45.5±2.1 43.43±1.4 39/7 12.14±0.83,5 9.98±0.8 8.62±0.4 0.182±0.010 9.29±0.73 107.40±2.84° 44.7±0.6 44.10±0.4 39/10 12.30±0.3 b 10.12±0.3 8.67±0.1 0.184±0.003 8.74±0.19 115.90±1.14..5 47.4±2.3 46.64±1.5 39/13 12.38±1.2 b 10.21±1.2 8.68±0.5 0.184±0.013 8.97±0.49 113.56±7.00a,0 45.4±2.5 46.56±4.0 39/16 12.23±1.1a,b 10.09±1.0 8.69±0.3 0.184±0.009 8.34±0.63 120.85±4.99° 47.8±0.6 48.20±1.1 Anova p<0.05 n.s. n.s. n.s. n.s.* p<0.05 n.s. n.s.* Polynomial contrast Linear n.s. n.s. n.s. n.s. n.s. p<0.05 n.s. p<0.05 Quadratic n.s. n.s. n.s. n.s. n.s. n.s. n.s. n.s. Different superscripts indicate significant differences between dietary treatments; * assumption of homogenous variances rejected-Kruskal-Wallis test; Figure 3: Final body weight (mean values; n=299-301) of Nile tilapia fingerlings inresponse to different levels of dietary protein. Error bars indicating 95% confidenceintervals. Figure 4: Body weight gain in response to different levels of dietary protein Figure 5: Feed efficiency in response to different levels of dietary protein Figure 6: Protein retention efficiency in response to different levels of dietary protein Figure 7: Energy retention efficiency in response to different levels of dietary protein Figure 8: Final body weight (mean values; n = 300-301) of N. tilapia fingerlings inresponse to different level of dietary lipid. Error bars indicating 95 % confidenceintervals Figure 9: Body weight gain in response to different levels of dietary lipid Figure 10: Feed efficiency in response to different levels of dietary lipid Figure 11: Energy retention efficiency in response to different levels of dietary lipid 4.2 CP and GE intake/gain Table 4: CP intake and CP gain in response to different levels dietary protein, and GEintake and GE gain in response to different levels of energy/lipid (mean ± SD) Diet CP intake CP gain Diet GE intake GE gain (g fish) (g fish) (kJ fish") (kJ fish") 33/10 2.54±0.25° 1.20±0.11“ 39/5 147±2 64±3 36/10 3.20±0.15° 1.53±0.10° 39/7 166±13 73±6 39/10 3.11±0.07° 1.47±0.07a,b 39/10 163±4 76±4 42/10 3.38±0.19° 1.49±0.12a,b 39/13 173±10 81±11 45/10 3.54±0.30° 1.52±0.15° 39/16 167±13 80±8 Anova p<0.05 p<0.05 n.s.* n.s. Polynomial contrast Linear p<0.05 p<0.05 n.s. p<0.05 Quadratic n.s. n.s. n.s. n.s. Different superscripts indicate significant differences between dietary treatments; * assumption ofhomogenous variances rejected-Kruskal-Wallis test; As presented in Table 4, CP intake of fish fed Diet 33/10 was significantlyreduced in comparison to higher protein inclusion levels, whereas no significantdifferences were observed among Diet 36/10,39/10, 42/10 and 45/10. CP gain was alsolowest for fish fed Diet 33/10 and was significantly lower than for fish fed Diet 36/10and 45/10. Significant differences induced by different energy/lipid inclusion levels could not be detected for GE intake. GE gain showed a significant linear increase inresponse to increasing dietary energy/lipid contents. 4.3 Body composition DM, CP, CL and CA contents of fish fed the commercial diet were 27.1±0.5,14.5±0.2, 9.0±0.4 and 2.8±0.1 % respectively. CP and CA contents of fish fed thecommercial diet were intermediate while DM and CL were low in comparison to fishfed experimental diets. Only fish fed diet 39/5 showed lower DM and CL contents thanfish fed the commercial diet. Body composition parameters of Nile tilapia fingerlings in response on gradedlevels of protein are presented in Table 5. The DM and CA contents of fish fed gradedlevels of protein were not significantly different. Different dietary protein levels had asignificant effect on CP and CL contents of fingerling Nile tilapia. Increasing dietaryprotein contents led to increased body CP and decreased body CL. However, tukey'stest did not find any significant subgroups between feeding groups for body carcass CP. Body composition parameters of Nile tilapia fingerlings in response to gradedlevel of dietary lipid are presented in Table 6. Different levels of dietary lipid had asignificant effect and on fish body DM and CL contents. Fish fed Diet 39/13 and 19/16showed highest CL (10.6±0.7 and 10.6±0.4%) contents, while fish fed Diet 39/5showed lowest CL contents (8.3±0.1). CP and CA contents of the experimental fishwere not significantly affected by dietary lipid. Nevertheless, a slight reduction of bodyCP contents in response to increasing levels of dietary lipid was noticed. Body proteinand body lipid contents in response to graded levels of dietary protein are presented inFigures 12 and 13. Body lipid contents in response to graded levels of dietary lipid arepresented in Figure 14. Table 5: Body composition (%) of Nile tilapia fingerlings in response to graded levelsof protein (mean ± SD) Diet P/L Dry matter Crude protein Crude lipid Crude ash 33/10 27.9±0.8 14.2±0.0 10.0±0.48,b 2.7±0.3 36/10 27.9±0.3 14.2±0.1 10.3±0.24 2.8±0.1 39/10 27.8±0.2 14.6±0.5 9.5±0.4a.b 2.8±0.1 42/10 28.3±0.3 14.8±0.2 9.9±0.4a,b 2.8±0.2 45/10 28.0±0.5 14.9±0.3 9.2±0.2 2.8±0.2 Anova n.s. p<0.05 p<0.05 n.s. Polynomial contrast Linear n.s. p<0.05 p<0.05 n.s. Quadratic n.s. n.s. n.s. n.s. Different superscripts indicate significant differences between dietary treatments Table 6: Body composition (%) of Nile tilapia fingerlings in response to graded levelsof lipid (mean ± SD) Diet P/L Dry matter Crude protein Crude lipid Crude ash 39/5 26.9±0.6° 14.8±0.5 8.3±0.1 3.0±0.3 39/7 27.5±0.7a,b 14.6±0.3 9.3±0.3a,b 2.8±0.1 39/10 27.8±0.2a,b,c 14.6±0.5 9.5±0.4,C 2.8±0.1 39/13 28.4±0.5D,C 14.4±0.1 10.6±0.7Cd 2.8±0.1 39/16 28.8±0.4° 14.3±0.4 10.6±0.4 2.9±0.1 Anova D<0.05 n.s. p<0.05 n.s. Polynomial contrast Linear D<0.05 n.s. p<0.05 n.s. Quadratic n.s. n.s. n.s. n.s. Different superscripts indicate significant differences between dietary treatments 16 48 Figure 12: Body protein content of Nile tilapia fingerlings in response to differentlevels of dietary protein y=-0,0749x+12,797 Figure 13: Body lipid content of Nile tilapia fingerlings in response to different levelsof dietary protein Figure 14: Body lipid content of Nile tilapia fingerlings in response to different levelsof dietary lipid 4.4 Deduction of the protein requirement and optimal CP/GE ratio Non-linear regression using the exponential and the four-parameter-logisticmodel to analyze the growth response of Nile tilapia fingerlings to graded levels ofdietary CP and to different dietary CP to GE ratios is summarized in Figure 15 andFigure 16 respectively. Dependent on the model and whether 95 % or 99 % of theplateau was selected for requirement estimation, estimates for optimal dietary proteincontents ranged between 35.47 and 36.91 CP (%DM). Estimates for optimal CP/GE-ratio ranged between 17.03 and 17.62gMJ. Figure 15: Non-linear Regression to estimate the optimal dietary protein contents for Nile tilapia fingerlings using the best fitting exponential andfour-parameter logistic-model. 0,2 × Figure 16: Non-linear Regression to estimate optimal dietary CP to GE ratio for Nile tilapia fingerlings using the best fitting exponential andfour-parameter logistic-model. 5.Discussion 5.1 Requirement estimation using non-linear modelling Outcomes of dose-response studies in nutritional sciences are highly dependenton the statistical method that has been chosen to evaluate the results and to deductquantitative statements about the requirements of an ingredient under investigation(HUA, 2013; PESTI et al., 2009). The advantage of regression analysis in dose-responsestudies is that the continuous character of the independent variable is reflected properlyin a continuous model, whereas in ANOVA the independent variable is treated as adiscrete variable (SHEARER, 2000). In the present study, two non-linear models weretested for their applicability to mathematically correctly deduct the dietary proteinrequirement and the optimal CP/GE ratio for fingerling Nile tilapia to maximize growth.These were the exponential model and the four-parameter logistic model. Moreover,two different criteriawere tested1..Thesewere 955and 99 % of Y-max of thecorresponding model. This approach led to different estimations of optimal nutrientcomposition. Within the series of graded levels of protein only one protein level wasclearly below the optimum. This circumstance probably led to a rather arbitraryestimation of the ascending part of the curves. Especially, the breakpoint of theexponential model for different levels of dietary protein was distinctively far away fromthe protein level that resulted in best growth rates. In general, the exponential modelyielded estimations that were quite close to the protein level and CP/GE ratio thatresulted in lowest growth rates. Therefore requirement estimations that were obtainedby the exponential model should reasonably be rejected. The four-parameter-logisticmodel seems to reflect the observed dose-response relationship better. But even here95% Y-max led to optimum dietary protein and CP/GE energy estimations that wereclose to the diet that resulted in lowest growth rates. The most reasonable deduction ofthe dietary protein requirement and the optimum CP/GE ratio was probably given at 99% of the plateau (maximum) of the four-parameter-logistic model. 5.2 Overall growth rates In the present study, overall, fish were healthy and grew fast. The highest growthrate that was achieved resulted in a TGC of 0.191 (Diet 36/10), whereas the lowestobserved TGC was 0.165 (Diet 33/10). The TGC is a good indicator to compare thegrowth of fish over a range of water temperatures and different fish sizes and it can beeasily calculated, if information on water temperature, feeding period, initial and finalweight is available. CHOWDHURY et al. (2013) observed a TGC of 0.143 for fingerlingNile tilapia, which were raised under commercial conditions from 1.6 to 28.6 g in 49days. The only fish nutrition study that could be found by the author, where similar oreven higher growth rates as in the present study were obtained by tilapias, was the studyof FIGUEIREDO-SILVA et al. (2013). In their growth trial, the best performingexperimental diet yielded a TGC of 0.213 when Nile tilapias with an initial weight of40.6 g reached a weight of 249.8 g in 48 days. In their study, fish of the same strain asin the present study were used. Maximum TGC's obtained in other previously publishedstudies on tilapia nutrition were generally much lower and ranged between 0.0622 and0.079 for fish with an initial weight between 0.45 and 16.31 g (ABDEL-TAWWAB et al.,2010; ALI et al., 2008; LI et al., 2013; MAZID et al. 1979). Other reasons for theobserved differences in growth rates across studies than experimental conditions, feedsand feeding patterns, might lie in greater differences regarding the genetic growthpotential of different Nile tilapia strains. Knowledge about growth rates and geneticgrowth potential of aquaculture species and strains is important in order to predict thenutrient requirements in fish production. 5.3 Body composition In the present study, graded levels of protein had a significant effect on bodyprotein and lipid contents of the experimental fish. Usually, body protein content ishighly associated to bodyweight in fish, while body weight gain is highly associated toprotein deposition (DUMAS et al.,2010). Moreover, body protein contents are not likelyto be influenced by exogenous factors such as feeding regime, in contrast to body lipidand body DM, which can be influenced by such exogenous factors (DuMAs et al., 2007). Therefore, body protein contents should remain constant irrespective of dietarytreatment or other factors. In general, when additional lipid is deposited in the fish body,lipid replaces water for its portion of whole body mass, consequentially leading to anincrease of body DM (DuMAs et al.,2007). However, in the present study, body proteinincreased and body lipid generally decreased (linear effect) with increasing dietaryprotein contents, whereas body DM was not affected by dietary protein contents.JAUNCY (1982) also observed increasing body protein contents as well as decreasinglipid contents when dietary protein contents were increased in diets for tilapias. Similareffects of increasing dietary protein on body composition of tilapias were observed bySHIAU and HUANG (1989) and SIDDIQUI et al. (1988). The percentagewise content ofbody protein is usually larger in larger fish as in smaller fish (BRECK, 2014), but thisdoes not explain the differences of body protein contents in fish of the same size asobserved in the present study. Low body lipid contents at high dietary protein levels canbe explained by metabolic energy cost of protein catabolism. Body DM and CLincreased linearly with increasing levels of dietary energy/lipid. This effect has alreadybeen documented in tilapia (ALI et al., 2008; HANLEY, 1991; SHIAU and HUANG, 1990).Interestingly, body lipid contents of fish fed Diet 39/13 and 39/16 were not much higherthan fish fed Diet 36/10. 5.4 Feed intake In the present study, FI was neither significantly affected by graded levels ofdietary protein nor by graded levels of lipid. It has been stated that fish take up food inorder to fulfill digestible energy requirement (SARAVANAN et al., 2012). BOUJARD andMEDALE (1994), for instance, observed that Rainbow trout regulate voluntary FI inresponse to the digestible Energy (DE) content of a diet. Further, FI of fish might beregulated by a lipostatic mechanism, where the hormone leptin is secreted in proportionto the amount of body fat content and regulates feed intake (TRAN-DuY et al., 2008). Inthe present study, body fat contents increased linearly with increasing dietary lipidlevels, but this did not have a significant effect on the amount of FI. This is inaccordance with findings of TRAN-DUY et al. (2008), who rejected the hypothesis of alipostatic regulation of FI in Nile tilapias in their study, because higher levels of bodyfat did not result in lower feed intake. TRAN-DUY et al. (2008) further hypothesized, that FI intake is regulated by the oxygen uptake capacity of Nile tilapias, because theyobserved, that irrespective of different dietary lipid, starch or DE contents, whichresulted in different amounts of FI, heat production, i.e. oxygen consumption, was samein Nile tilapias. Another hypothesis is, that FI intake in fish is regulated by bloodglucose levels (glucostatic regulation). Despite, FI was not significantly affected bydifferent dietary macronutrient composition, FI was lowest for diets containing highestamounts of starch (diet 33/10 and 39/5), indicating that glucostatic regulation mighthave played a role for FI regulation in the present study, as high amounts of dietarystarch lead to high blood glucose levels in fish (BRAUGE et al.,1994). The average dailyfeeding rate in this study was about 7.3 to 7.8 % BW day, depending on the type ofgrowth interpolation, and was therefore in close range to suggested values for the samespecies and size class by CHOWDHURY et al. (2013). Although FI was assessed in thisstudy, the main focus was on growth response of fingerling Nile tilapia to differentlevels of protein and energy. Therefore fish were fed in excess/ad libitum in order toassure that the fish can reach their full growth potential and maximum feed intake at agiven dietary nutrient level. Consequentially, results for FI, FE, PRE, ERE, CP intakeand GE intake might be more or less biased by uneaten feed. However, FE ratios, in thepresent study, were very similar to FE ratios obtained in other studies (SARAVANAN etal., 2012; SCHRAMA et al., 2012), where fish of the same strain and supplier (TilAqua,Silver strain)Wwere usedas experimental fish, FI wvas monitored carefully andcomparable feeds were fed, suggesting that, overall, in the present study, the portion ofuneaten feed was rather small. Therefore, these response parameters may representvaluable information and were presented in this study. 5.5 Growth response to different levels of protein In the present study, fingerling Nile tilapia with an initial body weight of 2.17 gfed different levels of dietary protein grew best on a diet containing 38.3 % CP. Feedinga diet containing a reduced level of CP (35.3%) led to a significant growth reduction,while a further increase of dietary protein beyond 38.3 % did not result in better growth.Estimated dietary protein requirementsby non-linear regression aanalysis rangedbetween 35.5 and 36.9 %. These findings are in close accordance to a series ofpreviously published studies. JAUNCY (1982) fed diets containing 0-56% CP and about 10 % CL to Mozambique tilapia (Sarotherodon mossambicus) with an initial bodyweight of about 1.85 g over a 40-days period, where fish grew best feeding on dietcontaining 42 % CP, while growth was reduced for fish feeding on diets containing 34and 50 % CP. ABDEL-TAWWAB et al. (2010) fed different level of dietary protein todifferent size classes of Nile tilapia. Here, fish with an initial bodyweight of 0.4-0.5 ggrew better on a diet containing 45% CP than on a diet containing 35 % CP, but fishwith an initial weight of 17-22 g showed no growth improvement, when dietary CP wasincreased beyond 35 %. TESHIMA et al. (1985a) fed gelatin-casein based diets with adietary CP content ranging from 25 to 40 % to N. tilapia fingerlings with an initialbodyweight of 0.56 g and showed that growth was best at a dietary CP level of 35 %,while 40 % dietary protein did not result in better growth. SIDDIQUI et al. (1988)conducted a growth trial with N. tilapias having an initial weight of 0.84 g and feddifferent dietary protein levels ranging from 20 % to 50 %. In this experiment fishreceiving a diet containing 40 % dietary protein showed superior growth in comparisonto fish fed 30 and 50 % dietary protein. OGUNJI and WIRTH (1999) obtained best growthrates when feeding a diet containing 33.3 % CP to N. tilapia fingerlings with an initialweight of 4-5 g, while fish fed 42 and 44 % CP diets showed no further growthimprovement. The data for growth response to graded levels of dietary protein obtainedin the present study does also fit well to the observations of MAZID et al. (1979), whofed casein based diets with different levels of dietary protein to Redbelly tilapia(Coptodon zillii; Syn.: Tilapia zillii) with an initial weight of 1.65 g. Here, 35% dietaryprotein was found to be optimal for growth. In this case, casein was fed as the soleprotein source, which has found to be deficient in some essential amino acids (EAA)(NRC, 2011) and would hence lead to a relatively higher absolute dietary proteinrequirement. On the other hand, dietary energy contents were considerably lower (15.2MJ kg) as in the present study and hence, the observed optimal dietary protein toenergy ratio was higher (19.4 g MJ") as in the present study. AL-HAFEDH (1999) feddiets containing dietary protein levels ranging from 25 to 45 % to Nile tilapias with aninitial weight of 0.51 g and observed that fish fed a diet containing 40 % protein grewmarkedly faster than fish fed a diet containing 35 % protein, whereas fish fed a dietcontaining 45 % protein showed no significant growth improvement in comparison tofish fed a diet containing 40 % protein. DE SILVA et al. (1989) implemented a meta-analysis on protein requirements of juveniles of different Tilapia species and identified acurvilinear relationship of dietary protein and growth, and maximum growth at a dietary protein level of 34 %. In contrast to that, SHIAU and HUANG (1989) obtained somewhatdifferent results in comparison to the present study when feeding different levels ofdietary protein to Oreochromis niloticus x Oreochromis aureus hybrids reared inseawater with an initial weight of 2.88 g, observing no significant differences of growthamong fish fed dietary protein levels ranging from 24 to 56 %. However, a majority ofstudies indicate that growth rates of fingerling Nile tilapia increase in response todietary protein levels up to a level of approximately 35-40 % dietary protein where aplateau is reached, when experimental diets are nutritionally well balanced andsufficient energy is supplied. Differences in reported protein requirements might beattributed to several factors such as tilapia species and strain, fish size, protein quality,dietary energy or environmental conditions, like temperature or water salinity. Indifference to many previously conducted dose-response studies, in the present study,distances between graded levels of protein (approximately 3%) were rather small. Thepresent study shows that fingerling Nile tilapias with a bodyweight of approximately 2-12 g grow better on 38.3 than on 35.3 % CP, therefore the present study allows anaccurate estimation of the protein requirements for optimal growth of Nile tilapiafingerlings under the given experimental conditions. The CP intake wassignificantly reduced in comparison to higher proteininclusion levels when Diet 33/10 was fed, whereas CP intake was not significantlydifferent among Diet 36/10, 39/10, 42/10 and 45/10. Possibly, fish fed Diet 33/10 werenot able to ingest sufficient amounts of dietary protein that were required to fullyexploit the growth potential. Lower protein intake was probably caused by acombination of lower protein inclusion levels and reduced feed intake (see chapter 5.4).The relationship between CP intake and CP gain is presented in Figure 17. Therelationship of CP gain to CP intake followed a curvilinear pattern, similar to theobservations of KAUSHIK et al. (1995) for nitrogen gain and nitrogen intake. Figure 17: Relationship between CP intake and CP gain of fish fed graded levels of CP.Diamonds indicate experimental groups fed Diet 33/10. 5.6 Protein retention efficiency In the present study, different levels of dietary protein significantly affected thePRE of Nile tilapia fingerlings. A marked decrease of PRE could be observed for Diet42/10 and 45/10 containing 42.6 and 45.7 % CP, respectively. A decrease of PRE inresponse to increasing dietary protein contents was observed in several studies fortilapia (MAZID et al., 1979;TESHIMA et al., 1985a; SIDDIQUI et al., 1988;ABDEL-TAWWAB etal.,2010)andalsofor fingerlingsnakehead(Channa striata)(SAMANTARAY and MOHANTY, 1997). Further, KAUSHIK et al. (1995) fed dietscontaining different levels of dietary CP between 1.6 and 38.5 % to N. tilapias with aninitial weight of 8 g and they found strongly diminishing protein retention, when thedietary protein level was increased from 32.8 to 38.5 %, while protein retentionremained relatively constant, when dietary protein levels were increased from 9.5 to32.8 %. Taking into consideration that these fish were larger as in the present study andwould consequentially require lower levels of dietary protein, their findings fit well tothe results obtained for PRE in the present study. Moreover, ALI et al. (2008) observedno significant alteration of PRE for Nile tilapia, when comparable amounts of dietary energy, as in the present study, and dietary protein levels ranging from 26.33 to 36.76%were fed. The results, obtained in the present study, indicate that a larger portion of theingested dietary protein was not utilized for growth and the synthesis of new tissues athigher levels of dietary protein. A significant effect of different levels of lipid/energy on the PRE could not beobserved in the present study. The increase of the dietary energy/lipid content did notmarkedly elevate the efficiency of protein retention, but lead to significant increase ofbody lipid storage. In contrast to that, DE SILVA et al. (1991) found increasing proteinretention in tilapias when the dietary lipid contents were elevated from 6 to 18%.Overall, PRE ranged in the present study depending on the dietary treatment between42.9 and 47.8 %, indicating a good utilization of dietary protein. A significant reductionof protein utilization was only observed when the dietary inclusion level of protein wasincreased above a certain level and AA were supplied in access. 5.7 Growth response to different levels of energy/lipid In the present study, growth (FBW) of fingerling N. tilapia was significantlyaffected by different levels of dietary energy/lipid and a significant growth reductionwas observed for fish fed a diet containing 5.3 % CL in comparison to fish fed dietscontaining 10.6 and 13.1 % CL, respectively. Available experimental data on the effectof dietary lipid levels on the growth of tilapias is somehow contradictory. TESHIMA etal. (1985b) tested different levels of protein, carbohydrate and lipid in diets for Niletilapias and observed that the growth rates increased almost linearly with increasingdietary lipid levels of 5, 10 and 15 % at a dietary protein level of 35 %. The positivegrowth response on dietary lipid levels up to 15 % was observed on digestiblecarbohydrate inclusion levels of 20, 30 and 40 %, although increasing the dietary lipidlevel from 10 to 15 % showed a slightly reduced positive response at a digestiblecarbohydrate level of 40 % in comparison to lower inclusion levels of digestiblecarbohydrate. FITZSIMMONS et al. (1997) conducted a study on the response of Hybridtilapia to different levels of dietary lipid. Here, no differences of growth performance offish with an initial weight of 67 g were observed when feeding diets containing 30 %CP and 3, 6 or 8% dietary lipid respectively. HANLEY (1991) also observed nosignificant effect of different lipid levels (5.1, 9.1 and 12.4 %) on growth when feeding Nile tilapias, but in this case, the experiment was conducted in a semi-intensiveenvironment, and further, higher dietary lipid contents were realized by the inclusion ofsupplementary yellow grease, a lipid source, which might be of questionable nutritionalvalue. In contrast to that, DE SILVA et al. (1991) found increasing growth rates inresponse to increasing dietary lipid contents up to a dietary lipid content of 18 % whenhe fed experimental diets containing 6, 12, 18 and 24 % dietary lipid and 15, 20, and 30%dietaryrprotein toHybridtilapia(OreochromisniloticusXOreochromismossambicus) with an initial weight of 1.2 g. ScHRAMA et al. (2012) found nodifferences regarding growth performance of Nile tilapias between two diets containing18.7 and 5.6 % CL, respectively, when dietary lipid was replaced by maize starch andthe digestible energy contents of the diets were similar. JAUNCY (2000) reported thatdietary lipid levels beyond 12 % lead to growth depression of Oreochromis aureus xOreochromis niloticus hybrids. Such a growth depression could not be observed in thepresent study. CHoU and SHIAU (1996) tested different levels of dietary lipid whenfeeding isocaloric diets to Oreochromis niloticus x Oreochromis aureus hybrids. In theirstudy, corn starch gradually replaced no DE containing cellulose and lipid for theenergy portion. They observed that growth of the fish was not affected when dietarylipid was increased from 5 to 15 %. A further increase of dietary lipid to 20 % led togrowth reduction in their study. Overall, differences in findings for the effect of dietarylipid contents (which are above a certain level that ensures sufficient supply ofEFA) ongrowth performance of tilapias are likely to be influenced by the dietary content of goodquality protein and/or the quantity and quality of dietary carbohydrates, which canprovide energy instead of lipid. Two explanations for the poorer growth performance of fish fed diet 39/5 mightbe conceivable. (1) Diet 39/5 was deficient in EFA. (2) The supply of fish with non-protein energy was sub-optimal at the lowest lipid level and a portion of the dietaryprotein was catabolized in order to fulfill energy needs and could not be utilized topromote growth. (1) Unfortunately, experimentaldiets were nott analyzed for fatty aacidcomposition in this study. In Diet 39/5, no supplementary oils were added to the dietand the dietary lipid content based solely on residual lipids of solid ingredients. Thesewere wheat, wheat gluten meal, high-protein soybean meal, soybean protein concentrateand North-Atlantic fishmeal. Calculations based on available data of ingredientproximate and fatty acid composition (MORRISON,1978; NRC, 2011), suggest that diet 39/5 contained approximately 1.0% n-6 PUFA and 0.6 % n-3 PUFA and thereforewould probably meet the EFA requirements proposed for Nile tilapias, but also wouldprobably be at the lower limit for sufficient EFA supply (KANAZAWA et al., 1980; NGand CHONG, 2004; NRC, 2011). EL-SAYED and GARLING (1988) fed isocaloric andisonitogenous diets containing different levels of carbohydrate and lipid to Redbellytilapia fingerlings, where a 1.7% dietary lipid diet produced considerably reducedgrowth in comparison to diets containing 4.2, 9.4 and 14.8 % lipid respectively. Theyhypothesized that the requirements for EFA was not met at low dietary lipid of 1.7 %,whereas at a dietary lipid level of 4.2 % supply of EFA was sufficient. However,information on the exact dietary EFA of Tilapias is relative scarce. The dietaryrequirement for n-3 PUFA are not yet determined (NRC, 2011), but recent researchsuggests that a certain requirement for n-3 PUFA exist in Tilapia (NG AND CHONG,2004). (2) Supposing that the requirements for EFA were met by all experimental dietsin the present study, than, a lack of utilizable dietary energy intake seems to be the mostprobable explanation for the observed growth depression of fish fed the lowestenergy/lipid containing diet. Although GE intake of fish fed different levels ofenergy/lipidWas notsignificantly affected, GEEintake of fishfed Diet 39/5(147 kJ fish’) was markedly lower in comparison to fish fed Diet 39/7, 39/10,39/13and 39/16 (163-173 kJ fish). Moreover, there were almost no marked differences ofGE intake between Diet 39/7, 39/10, 39/13 and 39/16. It might be conceivable that fishfed Diet 39/5 were not able to take up a sufficient amount of energy in order to reachtheir full growth potential. According to CHOWDHURY et al. (2013) 11.9 kJ DE arenecessary to promote 1 g of body weight gain in Nile tilapia weighing 2 g. Supposingthat in Diet 39/5 80 % of GE was digestible, than DE intake of fish fed Diet 39/5amounted about 118 kJ fish. In the present study, the highest body weight gain of10.86 was achieved by fish fed Diet 36/10. According to the data provided by theaforementioned study, 10.86 g of BWG would require 129 kJ DE, and thus is probablymore than fish fed Diet 39/5 have taken up. The relationship GE intake and GE gain isillustrated in Figure 18. Further, Diet 39/5 contained dietary protein levels that wereeven slightly higher than the protein level that yielded best growth rates among gradedlevels of protein. Increasing the dietary protein levels are known to increase the HE infish (KAUSHIK and MEDALE, 1994), leading to higher metabolic cost of feed ingestion. The protein to energy ratio was possibly too wide in Diet 39/5 to sustain optimalgrowth. Figure 18: Body energy gain in response to GE intake of fish fed graded levelsenergy/lipid. Diamonds indicating experimental groups fed Diet 39/5. 5.8 Energy retention efficiency In the present study ERE showed a significant quadratic response to gradedlevels of dietary protein and a significant linear response to graded levels of dietaryenergy/lipid. The quadratic response of ERE to graded levels of dietary protein is in linewith findings of ScHRAMA et al. (2012), who investigated the utilization efficiencies ofDE for growth (kgDE) across different fish species using a meta-analytic approach andfound a quadratic relationship between the dietary protein content and kgDE. As kgDE andERE directly correspond to each other, their results can be assigned to the resultsobtained for ERE in the present study. In the aforementioned study, the quadratic effectof dietary protein levels on kgDE was explained by high levels of nitrogen-free extract atlow protein levels. At high protein levels, a higher demand for the formation ofammonia and for the synthesis of fatty acids from protein would occur, and thus, wouldincrease the demand for metabolic energy and decrease kgDE. In fish, the formation offatty acids and the deposition of body lipid require more ATP, i.e. metabolic energy, when fatty acids are synthesized de nOvo0fromglucose that originatesfromcarbohydrates or protein (SCHRAMA, 2012). Moreover, it has been shown that, in fish,increasing lipid levels lead to a decrease of H;E, whereas an increment of dietary proteinincreases HE (KAUSHIK and MEDALE, 1994). SARAVANAN et al. (2012) showed thatoxygen consumption of Nile tilapias is lower when the dietary DE consists mainly oflipids instead of starch. In the present study, the positive linear response of ERE toincreasing levels of dietary energy/lipid can be explained by the aforementionedarguments. 5.9 Protein to energy ratio The digestibility of protein and energy was not determined in the present study.Generally, in fish nutrition dietary energy requirements are evaluated on the basis of DEor even ME. And so, evaluation of protein to energy ratios is mostly done on the basisof DE. Many authors have used different standard energy values for the same ingredientand therefore estimations of digestible energy and protein found in literature are ofteninconsistent (EL-SAYED, 2006). For instance, VAN TRUNG et al. (2011) used standardused standard digestibility values of 80 % in their study to define the protein and energyrequirements of Nile tilapia for protein and energy, respectively. In the present, studyGE contents of diets and body carcasses were calculated on the basis of the standardvalues for combustion energy of nutrients published by the NRC (2011). Similar toScHULZ et al. (2008), values for digestible protein and digestible energy are notspecified in the present study and the protein to energy ratio is expressed as g CP MJGE. In the present study, best growth rates were obtained by fish fed Diet 36/10,which had a CP/GE ratio of 18.2 g MJ. This finding fits quite well to optimal proteinto energy ratios as observed for tilapias in other studies. The protein-to-energy ratio is apopular concept to define and evaluate the protein and energy requirements of fish,because fish require a certain amount of DE to optimally utilize dietary protein forgrowth (NRC, 2011). Many researchers have investigated the protein-to-energy ratiosfor various fish species, as well as for tilapias. FERNANDES JUNIOR et al. (2016) testedfive different levels of dietary protein at two different levels of DE on Nile tilapias withan initial weight of 148 g. They observed a positive effect of higher levels of DE ongrowth performance, i.e. protein sparing effect, at lower dietary protein levels, whereas at higher dietary protein levels, increasing the DE contents did not result in improvedgrowth. Therefore they found different optimal dietary protein to energy ratios atdifferent levels of dietary DE. At a dietary level of 13.4 MJ DE the optimal protein toenergy ratio was 21.45 g DP MJ’DE, whereas at a dietary level of 14.65 MJ DE theoptimal protein to energy ratio was 18.60 g DP MJ DE. SHIAU and HUANG (1990)found a similar protein sparing effect in tilapia, where best growth rates were obtainedat 16.2 g CP MJ"’ME at a low protein level and at 25 g CP M GE at a high proteinlevel. KAUSHIK et al. (1995) found 18 g DP MJ DE to be optimal for 8 g Nile tilapia.EL-SAYED and TESHIMA (1992) found a higher CP/GE ratio of 26.3 g CP MJ GE to beoptimal for Nile tilapia fry with an initial weight of about 12 mg. ALI et al. (2008)found, very similar to the present study, best growth rates of Nile tilapias with an initialweight of 16.53 g at a CP/GE ratio of 18.96 g CP MJ"’GE (36.76 g CP, 19.39 MJ GE),whereas wider (reduction of energy) as well as narrower (reduction of protein) CP/GEratios led to reduced growth. But a similar CP/GE ratio of 18.61 CP MJ"GE (30.88 gCP, 16.59 MJ GE) with a reduced dietary protein and energy content also led to agrowth reduction. Results obtained from previously published studies suggest that the protein toenergy ratio is a good indicator to optimally balance protein and energy levels in fishfeeds within certain range of inclusion level and nutrient density. Outside of this range(or limitation) it would not make much sense to define optimal protein to energy ratios,especially when the dietary nutrient contents are below a certain minimum. However, inthe present study, Diet 36/10 and 39/13, having similar CP/GE ratio (18.2 and 18.4 g CPMJGE, respectively), resulted in in very similar growth rates and body composition,but slightly higher FE of Diet 39/13. Further research on the effect of different nutrientdensities at similar optimal protein to energy ratios could be beneficial in tilapianutrition. 6. Conclusions In the present study, a diet containing 38.3 % CP at a dietary CP/GE ratio of18.2 g MJ"produced best growth rates. A diet containing 35.3 % CP led to a significantgrowth reduction and also to significant reduced CP intake in comparison to higherprotein inclusion levels. Dietary protein levels above 40 % led to reduced PRE. It hasbeen shown that a lipid inclusion level of 5.3 % led to a growth reduction in fingerlingNile tilapia. At this dietary lipid inclusion level fish possibly did not acquire enoughenergy to fully exploit growth potential. An increase of dietary lipid contents from 7.4% up to 16 % did not increase growth and PRE, but lead to a significant increase ofbody lipid contents. Further, increasing levels of lipid increased ERE. The present studyprovides evidence that a diet for fingerling Nile tilapia weighing 2-12 g should containabout 37-40 % CP and should have a CP/GE ratio of about 18-19 g CP MJ' GE.Further, diets for fingerling Nile tilapia should contain well above 5 %lipids. Further research on the factors that may affect food intake, the effect of dietarynutrient concentration, physiological differences of nutrient utilization across fishspecies and the effect of feed ingredients and macronutrient composition on energyutilization seems to be advisable. References ABDEL-TAWWAB, M., AHMAD, M.H., KHATTAB, Y.A.E. and SHALABY, A.M.E. (2010):Effects of dietary protein level, initial body weight, and their interaction on the growth,feed utilization, and physiological alterations of Nile tilapia, Oreochromis niloticus (L.).Aquaculture 298,267-274. AL HAFEDH, Y.S. (1999): Effects of dietary protein on growth and body composition ofNile tilapia, Oreochromis niloticus L. Aquaculture Research 30, 385-393. ALI, A., AL-OGAILY, S.M., AL-ASGAH, N.A., GODDARD, J.S. and AHMED, S.I. (2008):Effect of feeding different protein to energy (P/E) ratios on the growth performance andbody composition of Oreochromis niloticus fingerlings. Journal of Applied Ichthyology24,31-37. AZAZA,M.S., DHRAIEF, M.S. and M.M. KRAIEM (2008): Effects of water temperature ongrowth and sex ratio of juvenile Nile tilapia Oreochreochromis niloticus (Linnaeus)reared in geothermal waters in southern Tunisia. Journal of Thermal Biology 33,98-105. BEVERIDGE, M.C.M. and BAIRD, D.J. (2000): Diet, feeding and digestive physiology. In:BEVERIDGE, M.C.M., McANDREW, B.J. (Eds.): Tilapias: Biology and Exploitation.Kluwer Academic Publishers. Dordrecht. 59-87. BOUJARD, T. and MEDALE, F. (1994): Regulation of voluntary feed intake in juvenilerainbow trout fed by hand or by self-feeders with diets containing two differentprotein/energy ratios. Aquatic Living Resources 21,211-215. BRAUGE, C.,MEDALE, F. and CORRAZE, G. (1994): Effect of dietary carbohydrate levelson growth, body composition and glycaemia in rainbow trout, Oncorhynchus mykiss,reared in seawater. Aquaculture 123,109-120. BRECK,J.E. (2014): Body composition in fishes: body size matters. Aquaculture 433,40-49. CHOU, B.S. and SHIAU, S.Y. (1996): Optimal dietary lipid level for growth of juvenilehybrid tilapia, Oreochromis niloticus x Oreochromis aureus. Aquaculture 143, 185-195. CHOWDHURY, M.A.K., SIDDIQUI, S., HuA, K. and BUREAU D.P. (2013): Bioenergetics-based factorial model to determine feed requirement and waste output of tilapiasproduced under commercial conditions. Aquaculture 410-411,138-147. COWEY, C.B. (1994): Amino acid requirements of fish: a critical appraisal of presentvalues. Aquaculture 124, 1-11. DABROWSKI, K. and GUDERLEY, H. (2002): Intermediary metabolism. - In: HALVER,J.E. AND HARDY, R.W. (Eds.): Fish Nutrition. 3 Edition, Academic Press, San Diego,310-365. DE SILVA, S.S., GUNASEKERA, R.M. and ATAPATTU, D. (1989): The dietary proteinrequirements of young tilapia and an evaluation of the least cost dietary protein levels.Aquaculture 80, 271-284. DE SILVA, S.S., GUNASEKERA, R.M. AND SHIM, K.F. (1991): Interactions of varyingdietary protein and lipid levels in young red tilapia: evidence of protein sparing.Aquaculture 95, 305-318. DUMAS, A., DE LANGE, C.F.M., FRANCE, J. and BUREAU, D.P. (2007): Quantitativedescription of body composition and rates of nutrient deposition in rainbow trout(Oncorhynchus mykiss). Aquaculture 273,165-181. DUMAS, A., FRANCE, J. and BUREAU D.P. (2010): Modelling growth and bodycomposition in fish nutrition: where haveeWWebbeen andwhere aarree wegoing?Aquaculture Research 41, 161-181. DUNZ.. A.R.2andSCHLIEWEN.U.K.(2013)::Molecular phylogenyand revisedclassification of the haplotilapiine cichlid fishes formerly referred to as “Tilapia”.Molecular Phylogenetics and Evolution 68, 64-80. EINEN, O. and ROEM, A.J. (1997): Dietary protein/energy ratios for Atlantic salmon inrelation to fish size: growth, feed utilization and slaughter quality. AquacultureNutrition 3, 115-126. EKNATH, A.E., TAYAMEN, M.M., PALADA-DE VERA, M.S., DANTING,J.C., REYES R.A.,DIONISIO, E.E., CAPILI, J.B., BOLIVAR, H.L., ABELLA T.A.,CIRCA, A.V., BENTSEN, H.B.,GJERDED, B.G., GJEDREM, T. and PULLIN, R.S.V. (1993): Genetic improvement offarmed tilapias: the growth performance of eight strains of Oreochromis niloticus testedin different farm environments. Aquaculture 111,171-188. EL-SAYED, A.F.M. (2006): Tilapia Culture. CABI Publishing, Cambridge. EL-SAYED, A.F.M. and GARLING, D.L. (1988): Carbohydrate-to-lipid ratios in diets forTilapia zillii fingerlings. Aquaculture 73, 157-163. EL-SAYED, A.F.M. and TESHIMA, S. (1992): Protein and energy requirements of Niletilapia, Oreochromis niloticus, fry. Aquaculture 103,55-63. ENCARNACAO, P., DE LANGE, C., RODEHUTSCORD, M., HOEHLER, D., BUREAU, W. andBUREAU D.P. (2004): Diet digestible energy content affects lysine utilization, but notdietary lysine requirements of rainbow trout (Oncorhynchus mykiss) for maximumgrowth. Aquaculture 235, 569-586. FAO (2016): Fishery and Aquaculture Statistics. [Global Aquaculture Production 1950-2014]. -In: FAO Fisheries and Aquaculture Department. Rome, updated 2016. [online,cited May 20161 http://www.fao.org/fishery/statistics/global-aquaculture-production/query/en FERNANDES JUNIOR, A.C., FIGUEIREDO DE CARVALHO, P.L.P., PEZZATO, L.E., ALBERSKOCH, J.F., TEIXERA, C.P., CINTRA, F.T., MOTTA DAMASCENO, F., AMORIN, R.L.,PADOVANI, C.R. and BARROS, M.M. (2016): The effect of digestible protein to digestibleenergy ratio and choline supplementation on growth, hematological parameters, liversteatosis andsize-sorting stress response inNile tilapia under field condition.Aquaculture 456,83-93. FIGUEIREDO-SILVA, A.C., SARAVANAN, S., SCHRAMA, J.W., PANSERAT,S., KAUSHIK, S.and GEURDEN, I. (2013): A comparative study of the metabolic response in rainbowtrout and Nile tilapia to changes in dietary macronutrient composition. British Journal ofNutrition 109, 816-826. FITZSIMMONS, K., DICKENSON, G., BRAND, C. and DAVIS, J. (1997): Effects of reducingdietary lipid levels on growth and body composition of hybrid tilapia in an intensiverecirculating-water system. The Progressive Fish Culturist 59, 293-296. GETACHEW, T.(1989): Stomach pH, feeding rhythm and ingestion rate in Oreochromisniloticus L. (Pisces: Cichlidae) in Lake Awasa, Ethiopia. Hydrobiologia 174, 43-49. HANLEY, F. (1991): Effects of feeding supplementary diets containing varying levels oflipid on growth, food conversion, and body composition of Nile tilapia, Oreochromisniloticus (L.). Aquaculture 93, 323-334. HEMRE, G.-I. and SANDNES, K. (1999): Effect of dietary lipid level on musclecomposition in Atlantic salmon Salmo salar. Aquaculture Nutrition 5, 9-16. HUA, K. (2013): Investigating the appropriate mode of expressing lysine requirement offish through non-linear mixed model analysis and multilevel analysis. British Journal ofNutrition 109, 1013-1021. IZQUIERDO, M.S., MONTERO, D., ROBAINA, L., CABALLERO, M.J., ROSENLUND, G. andGINES, R. (2005): Alterations of fillet fatty acid profile and flesh quality in giltheadseabream (Sparus aurata) fed vegetable oils for a long term period. Recovery of fattyacid profiles by fish oil feeding. Aquaculture 250,431-444. JAUNCY, K. (1982): The effects of varying dietary protein level on the growth, foodconversion, protein utilization and body composition of juvenile tilapias (Sarotherodonmossamicus). Aquaculture 27, 43-54. JAUNCY, K. ((2000)):.1Nutritionall requirementsS..-一In: BEVERIDGE, M.C.M.andMcANDREW, B.J. (Eds.):Tilapias: Biology and Exploitation. Kluwer AcademicPublishers, Dordrecht, 327-366. JOSUPEIT, H. (2010): World supply and demand of tilapia. FAO, Rome. [online, citedDecember 2016] http://seatglobal.eu/wp-content/uploads/2011/04/Tilapia-Helga.pdf KANAZAWA, A., TESHIMA, S., SAKAMOTO,M. and AWAL, M.A. (1980): Requirements ofTilapia zillii for essential fatty acids. Bulletin of the Japanese Society of ScientificFisheries 46, 1353-1356. KAUSHIK, S.J., DOUDET, T., MEDALE, F., AGUIRRE, P. AND BLANC, D. (1995): Proteinand energy needs for maintenance of Nile tilapia (Oreochromis niloticus). Journal ofApplied Ichthyology 11,290-296. KAUSHIK, S.J. and MEDALE, F. (1994): Energy requirements, utilization and dietarysupply to salmonids. Aquaculture 124, 81-97. KAUSHIK, S.J. and SEILIEZ, I. (2010): Protein and amino acid nutrition and metabolismin fish: current knowledge and future needs. Aquaculture Research 41, 322-332. LI, Y., BORDINHON, A.M., DAVIS, D.A., ZHANG, W. and ZHU, X. (2013): Protein: energyratio in practical diets for Nile tilapia Oreochromis niloticus. Aquaculture International21,1109-1119. LIM, C.E. and WEBSTER, C.D. (2006): Nutrient requirements. - In: LIM, C.E. ANDWEBSTER, C.D. (Eds.): Tilapia: Biology, Culture and Nutrition. The Haworth Press Inc.,Binghamton, 469-501. LUPATSCH, I., DESHEV, R. and MAGEN, I. (2010): Energy and protein demands foroptimal egg production of female tilapia Oreochromis niloticus. Aquaculture Research41,763-769. MAZID, M.A., TANAKA, Y., KATAYAMA, T., RAHMAN, M.A., SIMPSON, K.L. andCHICHESTER, C.O. (1979): Growth response of Tilapia zillii fingerlings fed isocaloricdiets with variable protein levels. Aquaculture 18, 115-122. MEYER-BURGDORFF, K.-H., OSMAN, M.F. and GUNTHER, K.D. (1989): Energymetabolism in Oreochromis niloticus. Aquaculture 79, 283-291. MJOUN, K., ROSENTRATER, K.A. and BROWN, M.L. (2010): Tilapia: Profile andEconomic Importance. Iowa State University, South Dakota Cooperative ExtensionService, USA. [online, cited December 2016] ( http://openprairie.sdstate.edu/cgi/viewcontent.cgi?article=1162&context=extension _ fact ) MORRISON, W.R. (1978): Wheat lipid composition. Cereal Chemistry 55, 548-558. NG, W.K. and CHONG, C.Y. (2004): An overview of lipid nutrition with emphasis onalternative lipid sources in tilapia feeds..-In: BoLIVAR, R.B., MAIR, G.C. andFITZSIMMONS, K. (Eds.): New Dimensions on Farmed Tilapia, Proceedings 6mInternational Symposium on Tilapia in Aquaculture, Philippines, 241-248. NG, W.K., TEH, S.W., CHOWDHURY,M.A.K. and BUREAU,D.P. (2013): On-farm feedingand feed management in tilapia aquaculture in Malaysia.- In: HASAN, M.R. AND NEW,M.B. (Eds.): On-farm feeding and feed management in aquaculture. FAO Fisheries andAquaculture Technical Paper No. 583. Rome, FAO, 407-431. NRC (National Research Council) (2011): Nutrient Requirements of Fish and Shrimp.National Academic Press, Washington D.C. NOSE, T., ARAI, S., LEE, D.L. and HASHIMOTO, Y. (1974): A note on amino acidsessential for growth of young carp. Bulletin of the Japanese Society of ScientificFisheries 40. 903-908. OGUNJI, J.O. and WIRTH, M. (1999): Effect of dietary protein content and sources, ongrowth, food conversion and body composition of Tilapia Oreochromis niloticusfingerlings. Deutscher Tropentag 1999 in Berlin, Session: Sustainable TechnologyDevelopment in Animal Agriculture. OLSEN, R.E., HENDERSON, R.J. and McANDREW, B.J. (1990): The conversion of linoleicacid and linolenic acid to longer chain polyunsaturated fatty acids bby Tilapia(Oreochromis) nilotica in vivo. Fish Physiology and Biochemistry 8,261-270. PESTI, G.M., VEDENOV, D., CASON, J.A. and BILLARD, L. (2009): A comparison ofmethods to estimate nutritional requirements from experimental data. British PoultryScience 50, 16-32. RAKOCY,J.E. (2016): Cultured Aquatic Species Information Programme. Oreochromisniloticus. -In: FAO Fisheries and Aquaculture Department. Rome, updated February2005 [online, cited November 2016]. http://www.fao.org/fishery/culturedspecies/Oreochromis niloticus/en RIEHL, R. and BAENSCH, H.A. (1997): Aquarien Atlas Band 1. 11th edition, MergusVerlag, Melle. RODEHUTSCORD, M., BECKER, A., PACK, M. and PFEFFER, E. (1997): Response ofrainbow trout (Oncorhynchus mykiss) to supplements of individual essential aminoacids in a semipurified diet, including an estimate of the maintenance requirement foressential amino acids. The Journal of Nutrition 127, 1166-1175. SAMANTARAY, K. and MOHANTY, S.S. (1997): Interactions of dietary levels of proteinand energy on fingerling snakehead, Channa striata. Aquaculture 156, 241-249. SARAVANAN, S., GEURDEN, I., FIGUEIREDO-SILVA, A.C., KAUSHIK, S.J., HAIDAR, M.N.,VERRETH, J.A.J. and SCHRAMA J.W. (2012): Control of voluntary feed intake in fish: arole for dietary oxygen demand in Nile tilapia (Oreochromis niloticus) fed diets withdifferent macronutrient profiles. British Journal of Nutrition 108,1519-1529. SARGENT, J., BELL, G., McEVOY, L., TOCHER, D. and ESTEVEZ, A. (2005): Recentdevelopments in the essential fatty acid nutrition of fish. Aquaculture 177, 191-199. SCHRAMA, J.W., SARAVANAN, S., GEURDEN, I., HEINSBROEK,L.T.N., KAUSHIK, S.J. andRRETH, J.A.J. (2012): Dietary nutrient composition affectsdigestible energyutilization for growth: a study on Nile tilapia (Oreochromis niloticus) and a literaturecomparison across fish species. British Journal of Nutrition 108,277-289. SCHULZ, C., HUBER, M., OGUNJI, J. and RENNERT, B. (2008): Effects of varying dietaryprotein to lipid ratios on growth performance and body composition of juvenile pikeperch (Sander lucioperca). Aquaculture Nutrition 14, 166-173. SCHWARZER, J., MISOF, B., TAUTZ, D., and ScHLIEWEN, U.K. (2009): The root of theEast African cichlid radiations. BMC Evolutionary Biology 9:186. SHELTON, W.L. and POPMA, T.J. (2006): Biology. -In: LIM, C.E. AND WEBSTER, C.D.(Eds.): Tilapia: Biology, Culture and Nutrition. The Haworth Press Inc., Binghamton,1-50. SHEARER, K.D. (2000): Experimental design, statistical analysis and modelling ofdietary nutrient requirement studies for fish: a critical review. Aquaculture Nutrition 6,91-102. SHIAU, S.Y. and HUANG, S.L. (1989): Optimal dietary protein level for hybrid tilapia(Oreochromis niloticus x O. aureus) reared in seawater. Aquaculture 81, 119-127. SHIAU, S.Y. and HUANG, S.L. (1990): Influence of varying energy levels with twoprotein concentrations in diets for hybrid tilapia (Oreochromis niloticus x O. aureus)reared in seawater. Aquaculture 91, 143-152. SIDDIQUI, A.Q., HOWLANDER, M.S. and AHMAD,A.A. (1988): Effects of dietary proteinlevels on growth, feed conversion and protein utilization in fry and young Nile tilapia,Oreochromis niloticus. Aquaculture 70, 63-73. SIMON, O. (2008): Grundlagen der Ernahrung. - In: JEROCH, H., DROCHNER, W. andSIMON, O. (Eds.): Ernahrung landwirtschaftlicher Nutztiere. 2nd Edition, Eugen UlmerVerlag, Stuttgart, 15-63. SKLAN, D., PRAG, T. and LUPATSCH, I. (2004a): Stucture and function of the smallintestine of the tilapia Oreochromis niloticusx OreochromisCaureus(Teleostei,Cichlidae). Aquaculture Research 35, 350-357. SKLAN, D., PRAG, T. and LUPATSCH, I. (2004b): Apparent digestibility coefficients offeed ingredients and their prediction in diets for tilapia Oreochromis niloticus xOreochromis aureus (Teleostei, Cichlidae). Aquaculture Research 35, 358-364. SMITH, B.J., SMITH, S.A., TENGJAROENKUL, B. and LAWRENCE, T.A. (2000): Grossmorphology and topography of the adult intestinal tract of the tilapian fish, Oreochromisniloticus L. Cells Tissues Organs 166, 294-303. SUGITA, H., KAWASAKI, J. and DEGUCHI, Y. (1997): Production of amylase by theintestinal microflora in cultured freshwater fish. Letters in Applied Microbiology 24,105-108. SURESH, V. and BHUJEL, R.C. (2012): Tilapias.- In: LUCAS, J.S. AND SOUTHGATE, P.C.(Eds.): Aquaculture: Farming Aquatic Animals and Plants. 2"d edition, Wiley andBlackwell, New York, 338-365. TACON, A.G.J. and METIAN, M. (2008): Global overview on the use of fish meal andfish oil in industrially compounded aquafeeds: Trends and future prospects. Aquaculture285,146-158. TENGJAROENKUL, B., SMITH, B.J., CACECI, T. and SMITH, S.A. (2000): Distribution ofintestinal enzymeactivities along the intestinaltract of cultured Nile tilapia,Oreochromis niloticus L. Aquaculture 182, 317-327. TESHIMA, S., KANAZAWA, A. and UCHIYAMA, Y. (1985a): Optimum protein levels incasein-gelatin diets for Tilapia nilotica fingerlings. Memoirs of Faculty of Fisheries,Kagoshima University 34, 45-52. TESHIMA, S., KANAZAWA, A. and UCHIYAMA, Y. (1985b): Effects of dietary protein,lipid and digestible carbohydrate levels on the weight gain, feed conversion efficiency,and protein efficiency ratio of Tilapia nilotica. Memoirs of the Kagoshima University,Research Center for the South Pacific 6, 56-71. TRAN-DUY, A., SMIT, B., VAN DAM, A.A. and SCHRAMA, J.W. (2008): Effects of starchand energy levels on maximum feed intake, growth and metabolism of Nile tilapia,Oreochromis niloticus. Aquaculture 277, 213-219. VAN TRUNG, D., THI DIU, N., TAT HAO, N. and GLENCROSS, B. (2011): Development ofanutritional model to define the energy and protein requirements of tilapia,Oreochromis niloticus. Aquaculture 320, 69-75. WANG, M. and Lu, M. (2016): Tilapia polyculture: a global review. Aquacultureresearch 47, 2363-2374. WILSON, R.P. (2002): Amino acids and proteins. - In: HALVER, J.E. AND HARDY, R.W.(Eds.): Fish Nutrition. 3 Edition, Academic Press, San Diego, 144-179. WILSON, R.P. and HALVER, J.E. (1986): Protein and amino acid requirements of fishes.Annual Review of Nutrition 6.225-244. Erklarung Hiermit erklare ich, dass die vorliegende Arbeit nicht fiir andere Prufungen eingereichtworden ist und selbststandig geschrieben wurde. Samtliche Quellen einschlieBlichInternetquellen, die unverandert oder abgewandelt wiedergegeben werden, insbesondereQuellen fur Texte, Grafiken, Tabellen und Bilder, sind als solche kenntlich gemacht undmir ist bekannt, dass bei VerstoBen gegen diese Grundsatze ein Verfahren wegenTauschungsversuchs bzw. Tauschung eingeleitet wird. Datum Unterschrift
关闭-
1/71
-
2/71
还剩69页未读,是否继续阅读?
继续免费阅读全文产品配置单
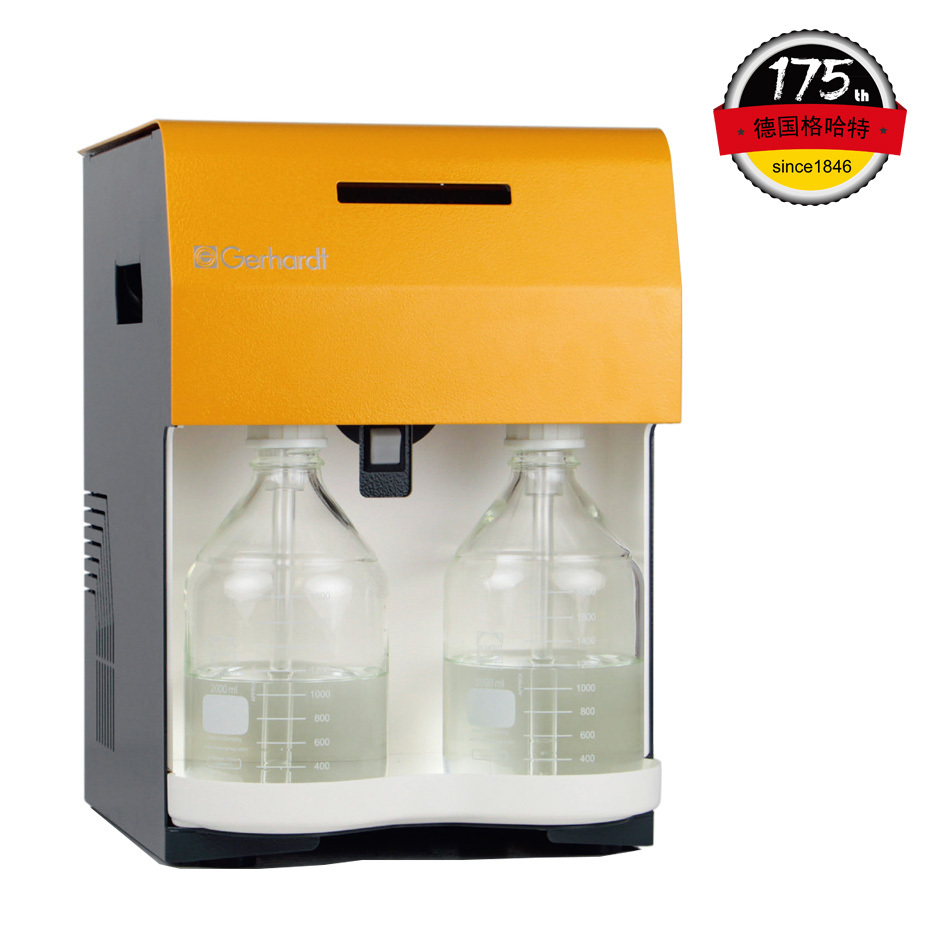
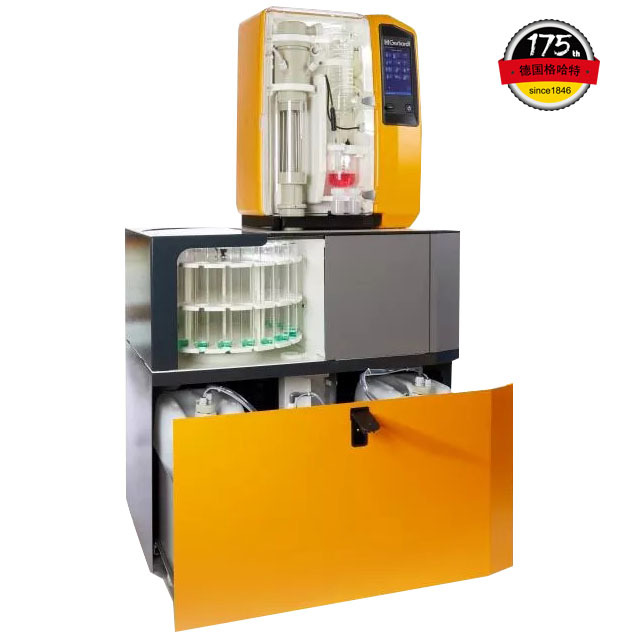
中国格哈特为您提供《尼罗罗非鱼中总脂肪、蛋白质检测方案(抽提萃取)》,该方案主要用于渔业中营养成分检测,参考标准《暂无》,《尼罗罗非鱼中总脂肪、蛋白质检测方案(抽提萃取)》用到的仪器有格哈特全自动超级总脂肪测定系统、格哈特凯氏消化系统KT8S、格哈特维克松废气废物处理涤气系统VS、格哈特带自动进样器凯氏定氮仪VAP500C、德国移液器MM。
我要纠错
相关方案
 咨询
咨询