方案详情文
智能文字提取功能测试中
隧道纳米管(TNTs)是一种纳米级的、富含肌动蛋白的、用于细胞间通讯的瞬时细胞间管。结构的复杂性和空间组织所涉及的组成部分的TNTs仍然未知。在本次研究中,STORM超分辨率成像技术被运用到结构组织的微丝和微管在细胞间的TNT在纳米尺度上。作者的研究结果揭示了不同的分布的微丝和交织结构的微管在TNT,促进TNT通信。研究背景细胞-细胞通信是通过多种机制发生的关键细胞活动,例如突触、间隙连接、突触桥和隧道纳米管(TNT)。在过去十年中,科学研究人员描述了TNTs在许多细胞类型中的重要生物学功能。此外,最近的研究还强调了TNTs在一些疾病中的重要作用,如神经退行性疾病、癌症诊断、免疫学和病毒学。虽然发现TNT参与关键的生物学和病理学过程,但TNT的结构复杂性在很大程度上仍然未知。揭示TNT相关成分的空间组织可以促进对其细胞功能以及如何调节疾病的了解。超分辨率显微镜技术超越了衍射极限,使可视化的细胞结构在前所未有的空间分辨率。在这些技术中,基于单分子定位的随机光学重建显微镜(STORM)由于其出色的空间分辨率和简单的操作而在生物学研究中具有广泛的应用。在这里,作者报告的直接观察TNTs依靠在纳米尺度上的STORM成像技术。超分辨率成像用于不同TNT中微管的不同结构和分布的可视化,并利用三维(3D)STORM成像探索TNT中微管的空间组织。此外,线粒体分布和TNT形态之间的潜在关系进行了进一步研究,这是有助于阐明线粒体在TNT的交付模式。STORM技术的这种一般方法为进一步研究TNT开辟了无数的可能性。研究结果(部分)如上所述,TNT是一种类型的肌动蛋白支持的细胞突起,其在不同大小范围内具有不同类型。为了更好地理解不同类型的TNT之间的差异,作者利用STORM技术在BS-C-1细胞中以不同的视野对不同大小的TNT中的微抗体进行成像,如图1所示,在STORM成像中采用10分钟的透化时间以记录TNT中的微物质。图1 不同视野下BS-C-1细胞间TNT中微丝的超分辨率成像(A-C)微丝的代表性全视场宽视场图像(左)和加框区域的放大图像(右)。(D-F)方框区域的相应STORM图像(左)。放大的图像(中间)显示了微丝的详细分布。红线显示STORM图像的放大图片中箭头指向区域的横截面轮廓(右侧)的高斯拟合。接下来,作者测量了来自亮视图图像的TNT的宽度,并将结果与共焦图像中最外面的微阵列之间的间隙进行比较(图1B)。作者发现,TNTs的宽度通常略大于相应的微阵列的间隙。这一结果表明,微量元素倾向于定位在TNT管腔的两侧。然后,作者应用STORM成像来可视化TNT中微物质的详细分布。图中的STORM超分辨率图像中,图1D-F显示了TNT中更清晰的微污染物分布。此外,很明显,随着最外微构件差距增大(从0.09mm到1.17mm,图1B),最外微构件的间隙增大(从0.09mm到1.17mm)。如图1D-F所示,在TNT中存在更多的微孔,并且在TNT的中空部分中出现更薄和更直的微孔。总之,这些结果表明,随着TNT的尺寸变大,其中的微泡数量增加,表明细胞通讯之间的膜附着不同。微管作为另一种重要的细胞骨架成分,存在于纳米管的胞质通道中,并构成了致密的TNT网络。作者采用STORM成像以不同的视野观察BS-C-1细胞的TNT中微管的组织(图1)。通过抗α-微管蛋白单克隆抗体和Alexa Fluor™ 647偶联的第二抗体实现微管的染色。作者观察到TNT中的微管蛋白,如图1B所示。图2A-C也显示了细胞间的喇叭状连接。作者发现微管在TNT中的分布明显地组织起来,如图所示。图2A-C。微管的分布宽度在0.29 ~ 4.58mm之间。当TNT变宽时,会出现更多的微管,其中一些微管以交织的方式沿着管壁延伸。图2 STORM超分辨率成像显示微管在不同细胞中的不同分布代表性的宽视场图像和每张图片中紧挨着宽视场图像的对应STORM图像指示具有不同直径的TNT中微管的各种组织模式。(A-C)BS-C-1细胞中TNT微管在不同视野中的超分辨率成像。放大图像显示详细信息。(D-F)三种类型癌细胞中TNT微管的超分辨率成像:食管癌细胞KYSE 150(D)、宫颈癌细胞HeLa(E)和人骨肉瘤细胞U2 OS(F)。除了BS-C-1细胞外,作者还对各种癌细胞中的细胞间微管进行了成像,包括食管癌细胞KYSE 150、宫颈癌细胞HeLa和人骨肉瘤细胞U2 OS,这些细胞通常用于研究实验室中的生理和病理过程。总之,上述结果说明了不同细胞中TNT中微管的不同组织模式。为了详细研究微管的组织模式,必须通过3D成像来观察它们。如上所述,微管倾向于在TNT中缠结。为了更清楚地了解微管在TNT中如何扭曲,进一步应用3D-STORM成像来分析微管的详细组织。超分辨率图像显示,在较小直径的TNT中,至少有三个微管相互缠绕(图3A),并且更多的微管也在具有较大直径的TNT中显示出缠结组织(图3A、3B),沿着更高分辨率的STORM图像和直观的3D成像结果,超分辨率图像显示这些微管以有序的螺旋缠绕方式缠绕在一起。图3 分别具有较小(A)和较大(B)直径的TNT中微管的3D超分辨率成像为了更好地理解通过TNT的线粒体转移,作者在这里使用STORM成像来研究TNT内线粒体的空间分布。我们首先观察了线粒体在两个相邻细胞之间的分布,并在明亮的视图图像中观察到两个细胞之间明显的管状结构,如图所示,线粒体倾向于分布在靠近细胞两侧的区域,而在TNT的中间区域没有发现明显的线粒体。然后,我们应用双色成像观察微管和线粒体在TNT同时使用共聚焦显微镜。共定位图像显示大部分线粒体集中在TNT中细胞的芽状侧上,这与图1B中所示的STORM结果一致。图4 明视图、宽视野和STORM图像研究小结综上所述,作者应用STORM超分辨成像方法来探索TNT组分在纳米尺度的结构和分布。微管和微管的不同组织模式说明了TNT形成的不同结构模式、3D-STORM成像从直观方面呈现了TNT中微管的清晰交织结构。此外,在TNTs中观察到明显的线粒体分布,表明TNTs在细胞间具有运输功能。作者的数据提供了一个新的框架,未来的研究TNT的形态和结构。随着超分辨成像技术和标记方法的快速发展,作者肯定了TNTs结构与功能之间的相关性将在未来得到快速验证。目前在国内,随机光学重建显微镜STORM已成功实现商用,有需要STORM成像技术进行实验研究的专家老师们,请文末填写问卷,即可预约获得 iSTORM 超高分辨率显微成像系统试拍服务~力显智能现已发布的超高分辨率显微成像系统 iSTORM,成功实现了光学显微镜对衍射极限的突破,使得在20纳米的分辨率尺度上从事生物大分子的单分子定位与计数、亚细胞及大分子复合物结构解析、生物大分子生物动力学等的研究成为现实,从而给生命科学、医学等领域带来重大突破。关于我们About us 宁波力显智能科技有限公司(INVIEW)是专业从事超高分辨率显微技术和产品研发的科技企业,依托复旦大学的自动控制、新一代信息技术及香港科技大学的生物、光学、图像处理等的技术,拥有光学、生物、自控、机械、信息技术等多领域交叉学科技术团队,将2014年诺贝尔化学奖技术产业化,推出了超高分辨率显微成像系统iSTORM、细胞智能监控助手赛乐微、细胞计数仪INCount等一系列产品,帮助人们以前所未有的视角观察微观世界,突破极限,见所未见。ROYAL SOCIETYOF CHEMISTRYNanoscaleAdvances CommunicationNanoscale Advances COMMUNICATIO N Check for updates Cite this: Nanoscale Adv.,2022, 4,4258 Revealing the structure and organization of intercellular tunneling nanotubes (TNTs) by STORM imagingt Received 28th June 2022Accepted 8th September 2022 Lilin Huang,+ Jiao Zhang,+ Zekai Wu, Liangliang Zhou, Bin Yu, Yingying Jing,*Danying Lin D * and Junle Qu D DOI : 10.1039/d2na00415a Tunneling nanotubes (TNTs) are nanoscale, actin-rich, transient intercellular tubes for cell-to-cell communication, which transport various cargoes between distant cells. The structural complexity and spatial organization of the involved components of TNTs remain unknown. I n this work, the STORM super-resolution imaging tech-nique was applied to elucidate the structural organization of micro-filaments and microtubules in intercellular TNTs at the nanometer scale. Our results reveal different distributions of microf i laments and intertwined structures of microtubules in TNTs, which promote the knowledge of TNT communications . Cell-cell communications are critical cellular activities which occur through diverse mechanisms, such as synapses, gap junctions,’ f i lopodial b bridges’ and tunnel i ng nanotubes (TNTs).4 The TNT structure was first described in 2004 and found to be an important pathway for cellular communication by direct intercellular connection. TNTs are defined as membrane protrusions and connect two or more cells. They are usually enriched in actin and microtubules and hover over the substrate, which can be used to transport organelles, smal l molecules and other substances.TNTs are generally divided in two categories,“thin TNTs”and “thick TNTs”. Thin TNTs have diameters in the range of 20-700 nm, while thick TNTs are wider and can extend up to 250 um in length. Over the last decade, scientific researchers have described the vital biological functions of TNTs in numerous cell types. Moreover, recent studies have also highlighted the essential roles of TNTs in some diseases, such as neurodegenerative diseases, cancer diagnosis, immunology, and virology.8-11 Although TNTs are found to be involved in critical biological and pathological Shenzhen Key Laboratory of Photonics and Biophotonics, Key Laboratory of Optoelectronic Devices and Systems of Ministry of Education and Guangdong Province, College of Physics and Optoelectronic Engineering, Shenzhen University,Shenzhen 518060, P. R. China. E-mail: dylin@szu.edu.cn; yyjing@szu.edu.cn t Electronic supplementary information (ESI ) available. See h ttps://doi .or g /10.1039/d2na00415a : These authors contributed equally to this work. processes, the structural complexity of TNTs rema i ns largely unknown. Revealing the spatial organization of the involved components of TNTs could promote the knowledge of their cellular functions and how they regulate disease. Imaging techniques are pivotal for understanding the distribution and organization of cellular structures. Several imaging methodshave been applied to visualize TNTs,including electron microscopy (EM) and multiple types of fluorescence microscopies (FM).12,13 However, the vital infor mation from EM and FM is potential l y limited due to compli cated operations in EM imaging and the restricted resolution in FM imaging. Thus, the current uncertainty on these topics calls for new methods capable of directly visualizing TNTs at the nanometer scale in situ. Recently, super-resolution microscopy techniques, which surpass the di f fraction l imit , have enabled the visualization of cellular structures at unprecedented spatia resolution.14-24Among gthese techniques,single-molecule-local i zation-based stochastic optical reconstruction micros copy (STORM) has wide applications in biological studies because of its outstanding spatial resolution and simple oper-ation.18,20,25 STORM employs photoswitchable fluorescent dyes that can be switched between fluorescent states and dark states,and a super-resolution image is built through localizations from thousands of frames of sparse fluorescent images.18,26,27 Now the STORM technique has become an attractive tool to provide insights into cellular structures and complex protein organiza tions at the molecular scale that were hitherto unattainable.28-30 Herein, we report the direct observation of TNTs by relying on the STORM imaging technique at the nanometer scale. Super resolution imaging was employed for visualization of the distinct structure and distribution of microfilaments in different TNTs and to explore the spatial organization of microtubules ir TNTs with three-dimensional (3D) STORM imaging. Moreover,the potential relationship between mitochondr i a distribution and TNT morphology was further studied, which was helpful in elucidating the delivery pattern of mitochondria in TNTs. This general approach of the STORM technique opens a myriad of possibilities for further investigation of TNTs. TNTs are regarded as thin-long membranous structures that have diameters ranging from 20 to 700 nm in thin TNTs or over 700 nm in thick TNTs, and lengths spanning up to hundreds of microns. The diffraction l i mitation of conventional microscopy constrains i ts ability to provide high-resolution structural information on internal components within TNTs. Thus, to investigate the spatial structure and organization of TNTs precisely, we here exploited STORM in our experiments to image the detailed structure of TNTs at the nanometer scale.The STORM technique employs photoswitchable dyes which can be converted between a fluorescent state and a non-fluorescent state at different wavelengths or under different chemical conditions. The stochastic blinking of the probes allows us to capture the signals of single fluorescent molecules without overlap. After multiple cycles of excitation and detec-tion, a super-resolution was generated by plotting the accu-mulation of the localizations from a sequence of images. We first evaluated the resolution of our home-built STORM system through determining the width of microtubules. As shown in Fig. S1A,t the wide-field image is blurred by di f fraction. In contrast, the reconstructed STORM image demonstrates a notable clarity improvement in resolution. We then deter-mined the resolution by measuring the ful l -width at half-maximum (FWHM) of the Gaussian profile. The results indi-cated that the resolution was 34 nm for our STORM imaging system (Fig. S1Ct), which was almost ten times higher than that of tradi t ional imaging (Fig. S1Bt). As mentioned above, the TNT was one type of actin supported cellular protrusion, which has different types ir different size ranges. To better understand the difference between TNTs of different types, we then uti l ized the STORM technique for i maging the microf i laments in TNTs of di f ferent sizes in different fields of view in BS-C-1 cells, which is a kind of common cell l ine for studying the structure and distribution of microfilaments and microtubules in cells.31-33 The microfila ments were immunolabeled with phalloidin, a toxin that binds to filamentous actin (F-act i n), coupled with Alexa FluorTM 647.Given the special structure of TNTs, we first optimized the permeabilization time as shown in Fig. S2.t We could observe thin TNTs in the confocal images with different permeabiliza-tion times. Here, confocal images S were captured with a commercial Nikon A1 plus confocal microscope with a 60×/1.4 NA oil objective. Then, to obtain a good labelling effect and avoid excessive destruction of microfilaments, we chose the permeabilization time to be 10 min and veri f ied that intracel-lular microfilaments could be labelled and imaged well with STORM imaging as shown in Fig. S3.t Thus, 10 min of per meabilization time was adopted in STORM imaging to record the microfilaments in TNTs. We could observe the obvious TNT structure of BS-C-1 cells both in the wide-field images and STORM images (Fig. 1), which connects two adjacent cells and contains different numbers of microfilaments in the vessels. The microfilaments in TNTs exhibited clear trumpet-shaped connections between cells Fig.1Super-resolution imaging o f microfilaments in TNTs between BS-C-1 cells in different f i elds of view. (A-C) Representat i ve full field-of -view wide-field images (left) of microfilaments and the enlarged images (right) of the boxed regions. (D -F ) Corresponding STORM images (left) of the boxed regions. Enlarged images (middle) show the detailed dist r ibution of microfilaments. The red l i nes show the Gaussian f i ts of cross-sect i onal profiles (right) of the arrow point i ng regions in the magnified pictures of STORM images. visualized by STORM imaging, which is consistent with what M.Benard et al. found in 2015,4 with higher resolution. To further confirm the imaged structures, we also used confocal micros-copy to capture the z-sections of the labelled microfilaments in the TNT-like structures that we have found, and ESI Movie 1t indicated that they are TNTs suspended between two cells and are not attached to the glass bottom. Next, we measured the width of TNTs from the bright-view images and compared the results with the gaps between the outermost microfilaments in confocal images (Fig. S4t). We found that the widths of TNTs are usually slightly larger than the corresponding microfilaments’ gaps. This result indicates that the microfilaments tend to localize on both sides of the TNT lumen. We then applied STORM imaging to visualize the detailed distribution of microfilaments in TNTs. The STORM super-resolution images in Fig. 1D-F showed clearer distribu-tion of microfilaments in TNTs. Moreover, i t is obvious that with the gap of the outermost microfilaments enlarging (from 0.09 um to 1.17 um, Fig. 1D-F), there are more microfilaments in TNTs and thinner and straighter microfilaments appear in the hollow portion of TNTs. Dual-color confocal imaging indi-cated that there are both actin and tubulin in thick TNTs (Fig. S5t), which is consistent with previous studies.735,36 Taken together, these results showed that, as the size of TNT becomes larger, the number of microfilaments in it increases, suggesting diverse membrane attachments between cell communications.7,37 As another crucial cytoskeleton component, microtubules exist in the cytosolic tunnel of the nanotube, and structured the dense network of TNTs. We then employed STORM imaging to observe the organization of microtubules in TNTs of BS-C-1 cells in different fields of view (Fig. 2). The staining of microtubules was realized through ant i -a-tubulin monoclonal antibody and Alexa FluorTM 647-coupled second antibody. Confocal micros copy was utilized to capture the z-sections of the labelled microtubules in TNTs, and the different layers indicated that the TNTs are suspended between two cells and are not attachec to the glass bottom (see ESI Movie 2t). We observed that the tubulin in TNTs as shown in Fig. 2A-C also exhibited trumpet shaped connections between cells.34 Then we found that the distribution of microtubules in TNTs was organized distinctly as shown in Fig. 2A-C. The distribution width of microtubules has a wide range from 0.29 um to 4.58 um. When the TNTs become wider, more microtubules appear, and some of them extend along the tube wal l in a manner of intertwining, which is similar to what Kreft’s group found in 2018. Besides the BS-C-1 cells, we also imaged the intercellulai microtubules in various cancer cells including esophageal cancer cells KYSE150, cervical cancer cells HeLa and humar osteosarcoma cells U2OS, which are commonly used to study the physiological and pathological processes in the labora-tory.39,40 The full field-of-view wide-field images in Fig. 2D-F are shown in Fig. S6.t We could observe thin and long microtubules in the TNTs of KYSE150 cells and U2OS cells as depicted in Fig. 2D and F, respectively. Their microtubules also presented entangled shapes in TNTs. However, for HeLa cells (Fig. 2E),most of the microtubules in TNTs are relatively short, and besides TNTs, we could also visualize many filopodia having no connections between cells in this type of cell. Overall, those results above i llustrated different organization patterns of microtubules i n TNTs in various cells. They also indicated that our STORM labelling and imaging method for microtubules within TNTs is effect i ve for different types of ce l ls For detailed investigation of microtubules’ organizatior patterns, i t is essential to observe them by 3D imaging. As dis cussed above, the microtubules tended to be intertwined ir Fig.22Different distributions of microtubules in different cells revealed by STORM super-resolution imaging. Representative wide-field images and the corresponding STORM images next to wide-f ield i mages in each picture indicate various organization patterns o f microtubules in TNTs with different diameters. (A -C) Super-resolution imaging of TNT microtubules in BS-C-1 cells i n different fields of view. Magnified images show the detailed information. (D-F) Super-resolution imaging of TNT microtubules in three types of cancer cells: esophageal cancer cel l s KYSE150(D), cervical cancer cells HeLa (E) and human osteosarcoma cells U2OS (F). Fig.333D super-resolution imaging of microtubules in TNTs with smaller (A) and l arger (B) diameters, respectively. The pseudo color in 3D-STORM images represent s the axial range from 400 nm below the focal plane to 400 nm above the focal plane. TNTs. To know how the microtubules twist in TNTs more clearly, 3D-STORM imaging was further applied to analyse the detailed organization of microtubules. By introducing a cylin-drical lens into the STORM system, the detected PSF of a defo-cused fluorescent molecule is deformed in different directions and degrees because of astigmatism. By analysing the ellipt i ci t y and orientation of the PSF, the axial position of the molecule can be obtained to realize 3D imaging.25 We obtained the 3D distribution of microtubules in TNTs with thin and wide diameters as shown in Fig. 3A and B, respectively. The pseudo color in Fig. 3 represents the axial range from 400 nm below the focal plane to 400 nm above the focal plane. The super-resolution image displayed at least three microtubules entan-gled with each other in the smaller-diameter TNT (Fig. 3A), and more microtubules also showed intertwined organization i n the TNT with a larger diameter (Fig. 3B), which along with the higher resolution STORM images and intuitive 3D imaging results, further confirmed what Kreft's group38 found using 3D-SIM microscopy in 2018. More significantly, the super-resolution images showed 1that these microtubules 2are entwined in an orderly spiral winding manner. Mitochondrial l transfer plays crucial1functions during various biological and pathological processes, such as oxidative metabolism, cel l signal l ing and rescuing recipient cells from bioenergetic deficit and tumorigenesis.1 Several studies have demonstrated that TNTs could conduct the transcellular transfer of mitochondria between cells.42-44 Therefore, t o better understand the mitochondria transfer through TNTs, we here used STORM imaging to study the spatial distribution of mitochondria within TNTs. We first visualized the distribution of mitochondria between two neighboring cells and observed the obvious tube structures between two cells in bright-view images as shown in Fig. 4. Interestingly, the mitochondria tended to distribute in areas which are close to both sides of the cell , whereas there were no obvious mitochondria found in the middle area of TNTs. We then applied dual-color imaging to observe the microtubules and mitochondria in TNTs simulta-neously using confocal microscopy. The colocalization image Fig. 4 Bright-view, wide-field and STORM images illustrating distri-bution patterns of mitochondria in TNTs between two BS-C-1 cells.The diverse structure of mitochondria i s visible at higher magnification. displayed that most of the mitochondria were concentrated on the bud-shaped sides of the cells in TNTs (Fig. S7t), which is consistent with the STORM result shown in Fig. 4. In summary, we applied the STORM super-resolution imaging method to explore the structure and distribution of TNT components at the nanometer scale. The various organi zation patterns of microfilaments and microtubules i ll ustratec diverse structural modes in TNT formations. In particular, the 3D-STORM imaging presented clear intertwined structures of microtubules in TNTs from an intuitive aspect. Besides, an obvious mitochondrial distribution was observed in TNTs.indicating the transportation function of TNTs between cells.Our data presented a novel framework for future studies on the TNT morphology and architecture. With the rapid development of f super-resolution iimaging t techniques a and labelling approaches, we affirmed that the correlation between structures and functions of TNTs will be verified quickly in the future. Conflicts of interest There are no conflicts to declare. Acknowledgements This work was partially supported by the National Key R&D Program of China (2021YFF0502900), the National Natural Science Foundation of China (62275165,62235007,61975131,62175166,32101112,61835009, and62127819),and the Shenzhen Basic Research Project (JCYJ20200109105411133). Notes and references 1 S. Cohen and M. E. Greenberg, Annu. Rev. Cell Dev. Biol.2008,24,183-209. 2 P. C . Schiller, G. D'Ippol i to, R. Brambilla, B. A. Roos and G. A. Howard, J. Biol. Chem., 2001, 276,14133-14138. 3 N. M. Sherer, M..J. Lehmann, L L.F. Jimenez-Soto,C. Horensavitz, M. Pypaert and W. Mothes, Nat. Cell Biol.2007,9,310-315. 4 D. Cordero Cervantes and C. Zurzolo, EMBO J., 2021, 40,e105789. 5 A. Rustom, R. Saffrich, I. Markovic, P. Walther and H.-H. Gerdes, Science, 2004, 303,1007-1010. 6 L. Taiarol, B . Formicola, S. Fagioli, G. Sierri, A. D'Aloia,M. Kravicz, A. Renda, F. Viale, R. Dal Magro, M. Ceriani and F. Re , Cancers, 2021, 13,4001. 7 M. W. Austefjord, H. H. Gerdes and X. Wang, Commun.Integr. Biol., 2014,7,e27934. 8 S . Zhu, G. S. Victoria, L. Marzo, R. Ghosh and C. Zurzolo,Prion, 2015, 9, 125-135. 9 V. S. Venkatesh and E. Lou, Cancer Rep.,2019,2,e1185. 10 R. J. J. Jansens, A. Tishchenko and H. W. Favoreel , J. Virol.,2020,94,e02120-19. 11 X.-T. Wang, H. Sun, N.-H. Chen and Y.-H. Yuan, Pharmacol.Res.,2021, 170,105541. 12 A. Sartori-Rupp, D. Cordero Cervantes, A. Pepe, K. Gousset,E. Delage, S. Corroyer-Dulmont, C. Schmitt, J. Krijnse-Locker and C. Zurzolo, Nat. Commun.,2019,10,342. 13 S. Abounit, E. Delage and C. Zurzolo, Curr. Protoc. Cell Biol.,2015,67,12.10.1-12.10.21. 14 S. W. Hel l and J. Wichmann, Opt. Lett.,1994,19,780-782. 15 M. G. L. Gustafsson, J. Microsc., 2000, 198,82-87. 16 M. G. L. Gustafsson, Proc. Natl. Acad. Sci. U. S. A., 2005,102,13081-13086. 17 E. Betzig, G. H. patterson and R. Sougrate, Science, 2006,313,1642-1645. 18 M. J. Rust, M. Bates and X. Zhuang, Nat. Methods, 2006, 3,793-795. 19 A. Sharonov and R. M. Hochstrasser, Proc. Natl. Acad. Sci. U.S. A.,2006, 103,18911-18916. 20 M. Heilemann, S. van de Linde, M. Schuttpelz, R. Kasper,B. Seefeldt, A. Mukherjee, P. Tinnefeld and M. Sauer,Angew. Chem., Int. Ed., 2008,47,6172-6176. 21 B. Huang, W. Wang, M. Bates and X. Zhuang, Science, 2008,319,810-813. 22 T. Dertinger, R. Colyer, G. Iyer, S. Weiss and J. Enderlein,Proc. Natl. Acad. Sci. U. S. A., 2009,106,22287-22292. 23 P. Dedecker, G. C. H. Mo, T. Dertinger and J. Zhang, Proc.Natl. Acad. Sci. U. S. A., 2012, 109,10909-10914. 24 J . Vangindertael, R. Camacho, W. Sempels, H. Mizuno,P. Dedecker and K. P. F. Janssen, Methods Appl. Fluoresc.,2018,6,022003. 25 M. Bates, S. A. Jones and X. Zhuang, Cold Spring Harb.Protoc.,2013,2013,498-520. 26 G . T. Dempsey, M. Bates and W. E. Kowtoniuk, J. Am. Chem.Soc., 2009,131,18192-18193. 27 G. T. Dempsey, J . C. Vaughan, K. H. Chen, M. Bates and X. W. Zhuang, Nat. Methods, 2011,8,1027. 28 A. Dani, B. Huang, J. Bergan, C. Dulac and X. Zhuang,Neuron, 2010, 68,843-856. 29 M. Klevanski, F. Herrmannsdoerfer, S. Sass ,V. Venkataramani, M. Heilemann and T. Kuner, Nat.Commun., 2020,11,1552. 30 J . Q. Xu, H. Q. Ma, H. B. Ma, W. J iang, C. A. Mela,M. H. Duan, S. M. Zhao, C. X. Gao, E. R. Hahm 1,S. M. Lardo, K. Troy, M. Sun, R. Pai, D. B. Stolz, L. Zhang S. Singh, R. E. Brand, D. J. Hartman, J . Hu, S. J. Hainer and Y. Liu, Nat. Commun., 2020,11,1899. 31 C. E. Park, Y. Cho, I . Cho, H. Jung, B. Kim,J. H. Shin, S. Choi S. K. Kwon, Y. K. Hahn and J. B. Chang, ACS Nano, 2020, 14,14999-15010. 32 I. Verdeny-Vilanova, F. Wehnekamp,N. Mohan, A. Sandova Alvarez, J. S. Borbely, J. J. Otterstrom, D. C. Lamb and M. Lakadamyali, J. Cell Sci., 2017,130,1904-1916. 33 T. E. Hoornweg, E. M. Bouma, D. P. I. van de Pol I. A. Rodenhuis-Zybert and J. M. Smit, PLoS Neglected Trop.Dis., 2020, 14, e0008469. 34 M. Benard, D. Schapman, A.Lebon, B. Monterroso,M. Bellenger, F. Le Foll, J. Pasquier, H. Vaudry, D. Vaudry and L. Galas, Biol. Cell, 2015, 107,419-425. 35 B. Onfelt, S . Nedvetzki, R. K. Benninger, M. A. Purbhoo S. Sowinski, A. N. Hume, M. C. Seabra, M. A. Neil,P. M. French and D. M. Davis, J. Immunol., 2006, 177,8476-8483. 36 S. Souriant, L. Balboa, M. Dupont, K. Pingris, D. Kviatcovsky C. Cougoule, C. Lastrucci, A. Bah, R. Gasser, R. Poincloux,B. Raynaud-Messina, T. Al Saati, S. Inwentarz, S. Poggi E. J. Morana, P. Gonzalez-Montaner, M. Corti, B. Lagane,I. Vergne,, C. Allers, D. Kaushal, M. J.Kuroda M. D. C. Sasiain, O. Neyrolles, I. Maridonneau-Parini ,G. Lugo-Villarino and C. Verol l et, Cell Rep., 2019, 26,3586-3599. 37 L. Marzo, K. Gousset and C. Zurzolo, Front. Physiol., 2012,372. 38 N. Resnik, T. Prezelj, G. M. R. De Luca, E. Manders,R. Polishchuk, P. Veranic and M. E. Kreft , Sci. Rep., 20188,17133. 39 K. Gousset, L. Marzo, P. H. Commere and C . Zurzolo, J. Cell Sci., 2013,126,4424-4435. 40 R. Mi t tal, E. Karhu, J. S. Wang, S. Delgado, R. Zukerman J . Mittal and V. M. Jhaveri , J. Cell. Physiol., 2019, 234,1130-1146. 41 D. Valenti, R. A. Vacca, L. Moro and A. Atlante, I nt. J. Mol Sci., 2021, 22,8312. 42 S. d. Abounit and C. Zurzolo, J. Cell Sci., 2012, 125,1089-1098. 43 X. Wang and H. H. Gerdes, Cell Death Differ., 2015, 22,1181-1191. 44 M. Dupont, S. Souriant, L. Balboa, T. P. Vu Manh , K. Pingris S. Rousset, C. Cougoule, Y. Rombouts, R. Poincloux, M. Ben Neji, C. Allers, D. Kaushal, M. J. Kuroda, S. Benet J. Martinez-Picado, N. Izquierdo-Useros, M. D. C . Sasiain I. Maridonneau-Parini, O. Neyrolles,C . Verollet and G. Lugo-Villarino, eLife, 2020, 9, e52535.
关闭-
1/5
-
2/5
还剩3页未读,是否继续阅读?
继续免费阅读全文产品配置单

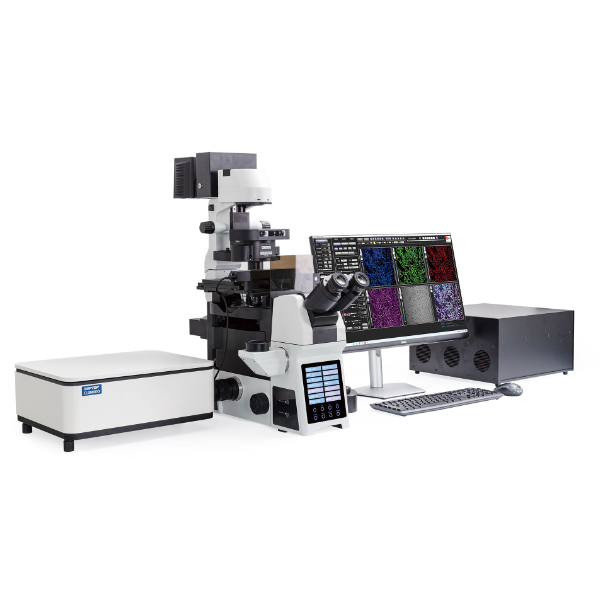
宁波力显智能科技有限公司为您提供《用STORM成像揭示细胞间隧道纳米管(TNTs)的结构和组织》,该方案主要用于其他中超分辨率显微镜检测,参考标准《暂无》,《用STORM成像揭示细胞间隧道纳米管(TNTs)的结构和组织》用到的仪器有超高分辨显微镜iSTORM、力显智能科技INVIEW激光共聚焦超分辨STORM原理显微镜iSTORM。
我要纠错
推荐专场
相关方案
 咨询
咨询