方案详情文
智能文字提取功能测试中
手性色谱高度依赖于柱和检测器,柱最近有了许多改进。手性检测器已经得到了一定程度的研究;然而,很少有研究对检测器响应进行并排比较[1,2]。本研究旨在直接比较两种商业手性检测器(偏振仪和圆二色性(CD)检测器)的精度、线性和检测极限,以评估它们在手性筛选中的有用性。我们的实验室有三台偏振仪可用于研究,但只有一台商用CD检测器。。对CD光谱及其与旋光计的关系进行了全面的综述[3],因此只强调了与液相色谱检测器相关的概念。1.1 The Detectors: Polarimeters 1.1.1 Polarimeter-1 (PLR-1) 1.1.2 Polarimeter-2 (PLR-2) 1.1.3 Optical Rotary Dispersion (ORD) Detector1.2 The Detectors: Circular Dichroism (CD)在本实验中得出的结论,根据四个探测器的整体性能,四个探测器的排列顺序如下:CD、偏光计-2/偏振计-1;ORDAn evaluation of four commercial HPLC chiral detectors: A comparison of three polarimeters and a circular dichroism detector. by Laila Kott, W. Brian Holzheuer, Megan M. Wong and Gregory K. Webster Analytica l Research & Development Pfizer Global Research and Development 2800 Plymouth Road Ann Arbor, MI 48105 Keywords: Chiral HPLC detectors, circular dichroism detector, comparison of commercial polarimeters, ORD *Corresponding author. Tel: +1 734 622 4925; fax: +1 734 622 7711. Email address:Laila.Kott@pfizer.com Journal ofPharmaceutical and Biomedical Analysis December 2005 ABSTRACT With increasing frequency, new drug candidates being introduced into pharmaceutical drug pipelines are chiral. Often only one enantiomer exhibits the desired biological activity and the other enantiomer may exhibit undesired side effects, thereby making chiral purity an important parameter. The introduction of chiral analysis adds additional complications in drug development. The pharmaceut i cal industry is constantly striving to streamline processes and improve efficiencies in an effort to move molecules to market quickly. In order to simplify the process of chiral method development, chiral screening can be set up, however a successful chiral screen depends on optimizing two factors: the column and the detector. The following work i nvestigated the second factor and evaluated two types of commercially available chiral detectors for thei r possible use in chiral method development and screening: polarimeters and circular dichroism (CD) detectors.Linearity, precision, and the l imit of detection (LD) of six compounds (trans-stilbene oxide, ethyl chrysanthemate, propranolol, 1-methyl-2-tetralone, naproxen, methyl methionine) on four commercial detectors (3 polarimeters and 1 CD detector) were determined experimentally and the l imit of quantitation (LQ) calculated from the experimental LD. Trans-stilbene oxide worked well across all the detectors, showing good l inearity, precision and low detection limits. However the other five compounds proved to be more discriminating and showed that the c i rcular dichroism detector performed better as a detector for chiral screens, over the polarimeters. 1. Introduction Chiral chromatography is highly dependent on the column, which has seen many recent improvements, and the detector. Chiral detectors have been studied to some extent;however, few studies have done side-by-side comparisons detector responses[1,2]. This study aimed to directly compare t he precision, l i nearity, and limit of detection of two types of commercial chiral detectors, polarimeters and circular dichroism (CD) detectors,to assess their usefulness for chiral screening purposes. Three polarimeters were available to our laboratory for the study, however, there was only one commercially available CD detector.. Thorough reviews of CD spectroscopy and how i t relates to that of polarimeters i s well documented [3], therefore only the concepts as there relate to liquid chromatography detectors are highlighted. 1.1 The Detectors: Polarimeters 1.1.1 Polarimeter-1 (PLR-1) Normal light waves vibrate in many planes; however plane polarized light i s generated when normal light is passed through an optical polarizing filter. This effect results in a light beam emerging that vibrates in a single plane (linearly polarized). A compound is optically active if l inearly polarized light is rotated when passing through it.The degree of rotation is dependent on both the concentration of a chira l compound and its molecular structure. Every optically active substance has its own specific rotation (degree of rotation in polarized l ight) as defined by Biots law: Where, a =specific rotation; l= optical path length in dm; a =wavelength; T=temperature; a =optica l rotation, c = concentration i n g/mL. The specific rotation of the molecule, not the absorption characteristics, is what determines the signal strength using the polarimeter. The Polarimeter-1 uses a diode laser at 670 nm as the l ight source. The vendor has chosen this wavelength as i t is in the flat region of the plain curve (section of curve where there is little change in [a], see section 1.1.2 below), a region with l ittle optical interferences. Experimentally, we have found that the polarimeter is the chiral detector most susceptible to scatter, possibly due to use of this long wavelength. Figure 1 shows a schematic of the optics in the polarimeter. 1.1.2 Polarimeter-2 (PLR-2) The Polarimeter-2 detector is similar in design and function to the Polarimeter-1,with the exception of a light emitting diode (LED) at 426 nm being the light source and having a second polarizing filter present i n-line after the sample. The choice of the blue wavelength is based on the plain curve, which is a graphic depiction of Drude’s equation: where A; i s a molecular constant and A; is a constant wavelength [4]. The equation shows the normal behaviour of optical rotation dispersion (the dependence of rotational strength of optically active molecules on the wavelength of light used for the measurements) in the absence of chromophores or in spectral regions that are distant from absorption bands.The equation also points out that t he angle of rotation, as a function of wavelength, is greatest at shorter wavelengths (see Figure 2). Therefore, to optimize the chiral response in a molecule, lower source wavelengths yield stronger responses. However, at lower wavelengths right- and left-handed circularly polarized light propagate at different velocities and are absorbed by molecules to a different extent. (This phenomenon is known as circular dichroism; see below). When this happens, it causes a deviation from Drude's equation, known as the “Cotton effect". Figure 2 [5] shows how the plain optical rotation dispersion curve i s affected by the Cotton effect. Figure 2 also highlights the area where there is maximized specific rotation ([a]) and minimized Cotton effects, which is in the range of 400 to 460 nm. Therefore Polarimeter-2optimizes these effects by using blue light from a light emitting diode (LED) as the light source. 1.1.3 Optical Rotary Dispersion (ORD) Detector The ORD detector is simi l ar in design and function to the Polarimeter-1; however the l ight source for this detector is a Xe-Hg l amp, which i s readily available and utilizes the strong l ine emissions of Hg at 365 nm, which can be t uned to cover a spectral range o f 350 to 900 nm, if required. This detector utilizes the lowest wavelength of the polarimeters (365 nm vs. 426and 670 nm) and therefore one would expect t hat this detector would give the strongest signal, based on Drude’s equation. However, the analog signals collected from t hese detectors were dependent on the gain set for each detector. Since the gain settings of the three detectors are not comparable, one cannot test Drude's equation with our data set. Circularly polarized l i ght: The two beams of l i nearly polarized l ight that are of equal amplitude and are a quarter wave out of phase. 1.2 The Detectors: Circular Dichroism (CD) When an optically active compound preferentially absorbs right or left circularly polarized light, the difference between the right and left absorbances [A(r)- A(1)] (often a very small value) i s recorded as the CD signal. As with UV absorbance, the CD signal is wavelength dependent. From the above discussion of the Cotton effect (section 1.1.2) a molecule should have a chromophore with absorption in the range of 200 to 420 nm to have strong CD signal . For the general screening in this study, 230 nm was chosen, as this was the lowest wavelength that would show little interference from the solvents used in the study. (UV cut off for solvents used: n-heptane, 220 nm; acetonitrile, 200 nm;water, 190 nm; ethanol, 210 nm; methanol, 220 nm). The wavelength was kept as low as possible as some compounds were specifically chosen to have weak chromophores. It is important to note that 230 nm was not the optimal wavelength for al l the samples tested,however i t did suffice to yield a signal for each compound. Figure 3 shows the basic components of the CD detector. 2.。Experimental The compounds studied were chosen based on presence or absence of chromophore and whether the compounds require normal or reverse phase chromatographic methods. A Perkin Elmer high performance l iquid chromatography (HPLC) system was used for the assays with the ORD (Jasco Inc., Gurnee, IL), CD (Jasco Inc., Gurnee, IL) and Polarimeter-2 (IBZ Chiralyzer from Resolution Systems,Holland, MI), which included a Series 200 pump, Series 200 autosampler, a Series 200peltier column oven and a PE Nelson 600 series LINK box. The chiral detectors were connected to an NCI 900 box and the data was acquired and processed through TotalChrom@ operating software. Polarimeter-1(Advanced Laser Polarimeter, PDR Chiral Inc, Jupiter, FL) was connected to a Shimadzu VP HPLC system including an SCL-10A system controller, FCU-10AL proportioning valves,DGU-14A degassers, an LC-10AD pump, SIL-10AD autosampler,CTO-10AC column oven and an SPD-10A UV/visible detector. This system was controlled by Shimadu Client/Server software. A 7 pL of~1.5mg/mL stock solution was used for the precision experiments,however l inearity was determined by injecting 2, 3, 4, 5 and 6 pL of~0.5 mg/mL stock solution and 7, 10, 13, 17 and 20 uL of~1.5mg/mL stock solution. All concentrations are that of the racemic mixture, not the individual enantiomers. The compound structures are compiled i n Figure 4. 2.1 Trans-stilbene oxide (TSO) TSO (racemic mix, Fluka Chemie, Switzerland) was a chromophoric compound analyzed by normal phase chira l chromatography. The mobile phase was composed of 90:10 (v/v) heptane (J.T. Baker, Phi l lipsburg, NJ):ethanol (HPLC grade, Sigma-Aldrich,St.Louis, MO); run isocratically for 20 minutes, using a Chiralcel OJ column (4.6x 250mm) at 1 mL/min and a column temperature 27C. Samples were prepared in isopropyl alcohol (Sigma ). 2.2 Ethyl chrysanthemate Ethyl chrysanthemate (mixture of isomers, Aldrich, St. Louis, MO) is a weak to non-chromophoric compound analyzed by normal phase chiral chromatography. The mobile phase was composed of 100% heptane; run isocratically for 30 minutes using a Regis Whelko O1 column (4.6 x250 mm) at 0.5 mL/min and a column temperature of 27°C. Samples were prepared i n isopropyl alcohol (Sigma). 2.3 Propranolol (±)Propranolol (Aldrich, St. Louis,MO) was a chromophoric compound analyzed by polar organic chiral chromatography. The mobile phase was composed of 55:45(v/v)methanol (Sigma-Aldrich):acetonitrile (Sigma-Aldrich) with 0.2% (v/v) triethylamine (J.T.Baker) and 0.3% (v/v) acetic acid (Aldrich); run isocratically for 30 minutes using a Chirobiotic T column (4.6 x 250 mm) at 1.5 mL/min, and a column temperature of 27°℃.Samples were prepared in isopropyl alcohol (Sigma ). 2.4 2-methyl-1-tetralone 2-methyl-1-tetralone (racemic mix, Aldrich) was a chromophoric compound analyzed by reverse phase chiral chromatography. The mobile phase was composed of 60:40 (v/v) water:acetonitrile; run isocratically for 40 minutes using a Chiralpak AD-RH column (4.6 x 150 mm) at 0.5 mL/min, and a column temperature of 20℃. Samples were prepared i n isopropyl alcohol (Sigma). 2.5 Naproxen Naproxen was a chromophoric compound analyzed by reverse phase chiral chromatography. (R)-Naproxen was received from Toronto Research Chemical (North York,ON, Canada) and the (S)-Naproxen was received from the Caymon Chemical Co.(Ann Arbor, MI). The mobile phase was composed of 75:25 (v/v) water:methanol (Mallinckrodt, Phillipsburg, NJ) with 0.1% (v/v) diethylamine (Fluka) and 0.2% (v/v)acetic acid (Aldrich 99.9%); run isocratically for 40 minutes using a Chirobiotic R column (4.6 x 250 mm) at 0.8 mL/min, and a column temperature of 27°C. Samples were prepared in isopropy l alcohol (Sigma). 2.6 a-Methyl-DL-methionine Methyl-dl- methionine (Sigma) was a compound with a weak chromophore analyzed by reverse phase chiral chromatography. The mobile phase was composed of 80:20 (v/v) water:methanol with 0.1% (v/v) diethylamine and 0.2% (v/v) acetic acid (J.T. Baker); run isocratically for 15 minutes using a Chirobiotic T column (4.6 x250mm) at 0.8 mL/min, and a column temperature of 27°C. Samples were prepared in isopropyl alcohol (Sigma ). 3. Results and discussion 3.1. Precision System precision was determined using six consecutive injections of the t arget concentration of the analyte and the comparing the percent relative standard deviations (%RSD) of the area counts.The target racemate concentration was ~0.5 mg/mL, which was adjusted based upon detector sensitivity. A compilation of the precision data is found in Table 1. The CD detector yielded the best precision across all compounds studied (a range of 0.30 to 8.46 %RSD) and for 7 out the ten experiments, showed a percent relative deviation (%RSD) of less than 5. Ethyl chrysanthemate, propranolol and naproxen at the 0.5 mg/mL level showed good precision, which led to the precision being repeated at ~10x lower concentrations to better define the capabilities of the detector. TSO was consistently showing better responses with the CD detector, therefore to truly probe the capabilities of the detector, al l experiments with TSO and the CD detector used the standard concentration range of 0.05 to 0.15 mg/mL, ten-fold lower than for the other compounds. For concentrations ~0.05 to 0.08 mg/mL, TSO, naproxen and enantiomer 2of propranolol showed system precision values of less than 5%RSD. Polarimeter-2 showed a slightly better response over Polarimeter-1 (PLR-2: 0.77to 32.39%, PLR-1 range: 1.35 to 24.99%), with the ORD showing the worst precision data (range: 1.54 to 43.35%). The United States Pharmacopeia (USP) outlines system suitability for precision of replicate i njections for HPLC as five i njections for a %RSD of ≤2.0% and six replicates for %RSD of ≥2.0%[6]. In general, for most pharmaceutical HPLC assay procedures a %RSD of ≤2.0% is the benchmark for chromatographic precision. This being the case,only t he CD detector performed as per accepted HPLC detector specifications. In general the polarimeter responses were low at the concentrations studied, which affected the precision %RSD and made them less useful as quantitative HPLC detectors. 3.2. Linearity Linearity was determined by making triplicate injections at each concentration,followed by a regression analysis. The correlation coefficient (r) was used to assess linearity. To better investigate the capabilities of the different types of detectors, linearity was run on what would be considered a standard concentration range expected i n a typical drug substance batch (0.5 to 1.5 mg/mL), as well as on an approximately ten-fold lower concentration set to assess the lower working range of each detector. A ten-fold dilution proved to be an appropriate cut off for determining t he lower l inear range for the detectors, as some compounds (ethyl chrysanthemate, naproxen, methy l methionine)could not be detected at this level, while others (TSO) still showed good linearity. Methyl methionine could not be reliably detected by the polarimeters at the 0.5 to 1.5 mg/mL level; therefore the concentration range was increased to range from ~ 2 to 6mg/mL,So that linearity and the l imits of detection and quant i tation could be determined. Table 2summarizes the linearity data for the higher concentration ranges and Table 3 summarizes the lower concentration linearity data. Across the standard (higher) concentration range, the responses from ethyl chrysanthemate (enantiomer 1) and naproxen were off-scale at the CD wavelength of 230nm. Since the wavelength was not optimized for any of the study compounds, the linear response may be further i mproved upon optimizing the choice of wavelength. As stated earlier, the intended f inal use for the chiral detectors was for general screening and 230nm was chosen as a constant wavelength for this investigation, as this was the lowest wavelength that would show little i nterference from t he solvents used (i.e. more compounds are UV active at lower wavelengths). It is evident that 230 nm is not optimal for naproxen and propranolol as both enantiomers show a positive response, nor for 2-methyl-1-tetralone as both enantiomers show a negative response (Figure 5). The responses of these compounds at 230 nm are only a snapshot of the whole CD spectrum.The predominant use of CD spectroscopy to date gave general information about the environment of the chiral center, and the determination of secondary structure in l arger molecules, such as the location of ketone groups, the degree of coiling in protein helices and the type of substitution in amino acids [7]. Many factors can contribute to the observed responses in Figure 5 but when a CD wavelength is optimized, enantiomers yield one positive and one negative signal. Since the scope of this study was to test the feasibility of the detectors for general screening, further investigations into the CD responses were not pursued. For the compounds that did remain on-scale (TSO, propranolol , 2-methyl-1-tetralone and methyl methionine), the CD detector showed the most linear response overall (range of r: 0.9847 to 9997). Polarimeter-1 showed the next best l inear response (range: r= 0.9189 to 0.9999),followed by Polarimeter-2 (range: r=0.6373 to 0.9910) and ORD (range: r= 0.8166 to 0.9887) which showed approximately the same l inear responses across the compounds.The correlation coefficients determined for the polarimeter detectors were comparably lower than the CD detector slipping into the 0.8 range for the non-chromophoric compounds and even as low as 0.64 in the case of methyl methionine. The response of the polarimeters was lesser (i.e. much lower peak heights) and noisier, than the CD detector responses, making integration more difficult and less consistent between data sets. The lower concentration range data highlighted the greater sensitivity of the CD detector, which yielded linear responses for al l of the compounds i nvestigated. All the polarimeters showed linear responses for TSO. 3.3. Limit of Detection (LD) The third method of assessment of the four chiral detectors was the determination of the l imit of detection. This was done both experimentally and mathematically. The LD was determined mathematically by the formula [8]: Where s = standard deviation of the sample repeats, S = the slope of the calibration curve.When it was possible the calculated LD was tested by injecting samples at the calculated concentration, to test the reliability of the calculated value. The LD data is summarized in Table 4. Across the entire compound set, the CD detector showed the lowest measured detection l imits, ranging from 4.65 ug/mL to 0.098 mg/mL . The l imits of detection for the non-chromophoric compounds ethyl chrysanthemate and methyl methionine were on the high end of the range (0.23 mg/mL for ethyl chrysanthemate enantiomers and 0.049mg/mL and 0.098 mg/mL for methyl methionine), however they were stil l lower than those determined by the polarimeter detectors, whose responses are independent of presence of chromophores in the molecule. For most compounds the calculated LD was the same order of magnitude as the observed. For TSO and naproxen, the calculated values were lower than any concentration tested, however the signals were stil l strong at the lowest concentrations injected, thereby suggesting t hat the calculated LD values may be realistic. Polarimeter-2 showed the next best l imit of detection, ranging from 0.058mg/mL to 2.069 mg/mL. Because of its large signal responses, Polarimeter-2 tended to show more scatter at the lower concentrations. Due to this, Polarimeter-2 is considered a sensitive detector but not precise. The lack of precision, however, does not deter its use of this detector for screening purposes. Polarimeter-1 and the ORD ranked third and fourth in sensitivity, respectively (PLR-1 range: 0.053 mg/mL to 2.298 mg/mL; ORD range: 0.044 to 5.586 mg/mL). 3.4. Limit of Quantitation (LQ) The LQ can also be determined mathematically from the previously determined LD values. The International Conference on Harmonization (ICH) guidelines define LD based on signal to noise (S/N) as 3 x S/N and LQ as 10 x S/N [8]. Therefore: and LQ is : Using this relationship, the LQ values in Table 5 were calculated from the calculated LD values in Table 4. Table 5 shows t hat the standard concentration range used (0.5 to 1.5 mg/mL) was appropriate for TSO, most 2-methyl-1-tetralone analyses and all CD analyses (highlighted with boldface type), with the exception of methyl methionine, as the standard concentration range i s close to the calculated LQ’s for one of the enantiomers.Methyl methionine and other individual results that have calculated LQ's within the standard concentration range are italicized. These data correlate well with the low concentration l inearity data (~0.05 to 0.15 mg/mL) in Table 3, as most of the bold marked analyses in Table 5 resulted in detectable l inearity data across the lower concentration range. 3.5. Achiral Use Use of chiral detection for achiral liquid chromatographic separations has been reported in the literature [9]. Initial studies using these detectors in our laboratory did not yield adequate sensitivity for pharmaceutical enantiomeric purity determinations.Investigations in this chiral detector application are on going. 4..Conclusion Two types of chiral detectors were tested and compared to determine their usefulness for chiral method development and screening; polarimeters and CD detectors.Of greatest initial importance, especially for screening work, is the l imit of detection, for if a racemic mixture of enantiomers is not available, screening may have to be done on drug substances with only a small amount of the chiral impurity. The CD detector showed the lowest detection limits across all the compounds and modes of chromatography (normal, reverse, polar organic). Since CD detection depends on the difference i n absorption of circularly polarized l ight , and polarimeters are less reliant on the presence of chromophores, compounds with weak chromophores were included in the study, with the intent to truly test the universality of the detectors. Contrary to what had been expected, the CD detector worked well for weakly chromophoric compounds and resulted in similar detection limits as compounds with strong chromophores.Of the polarimeters tested, Polarimeter-2 showed the best detection l imits, although there was much scatter at the lower concentrations. For the precision experiments, the CD detector showed the lowest percent relative standard deviation values at the target concentration of~0.5 mg/mL and was consistently precise for TSO, ethyl chrysanthemate, propranolol, and naproxen at ~0.05 mg/mL. Of the polarimeters, Polarimeter-2 showed slightly better precision over Polarimeter-1, with the ORD detector showing the worst precision. The CD detector also showed the best linearity for all compounds, albeit the wavelength used was not optimized for each analyte. The sensitivity of this detector is underscored by the signal; in some cases being so strong at the higher concentration range that the peaks were off-scale and that the data was linear even after a ten-fold dilution of the standards. Gradients worked well on the CD, Polarimeter-1 and ORD polarimeters; however,Polarimeter-2 had more trouble with gradients (data not shown). To be able to use a gradient, the detector needs to be zeroed at the mid-point of the gradient, followed by adjusting t he sensitivity such that the ear l y and late portions of the gradient remained on scale. This makes Polarimeter-2 a little more cumbersome for gradient screens,unless the same gradient is used wi t h many different columns. Blank runs can be programmed in a sequence for changing the gradient and re-zeroing the system. As with a refractive index detector, Polarimeter-2 is best used with isocratic elution runs. Polarimeter-2 had the best control o f all of the detectors over signal gain. When the detector is set at the most sensitive setting, the peak area counts are ~100-fold larger than the other three detectors, making the noise higher, but also making it easier to discern and quantify peaks. Overall the CD detector has shown to be a general but sensitive chiral detector for chira l method development and screening.. In most cases once chiral separation has been established methods are developed using more conventional detection techniques (i.e.UV), however the CD which is equipped with UV detection as well, could possibly be used more universally for chiral analyses as its response is both l inear and sensitive. Of the polarimeters t he Polarimeter-2 and Polarimeter-1 performed about the same, but came in a distant second to the CD. Polarimeter-2 could prove more useful i f the control of the instrument was better interfaced with a computer for control l ing the sensitivity and zeroing the instrument on changing mobile phases. Based on the overall performance of the four detectors, four detectors are ranked in the following order: CD; Polarimeter-2/Polarimeter-1; ORD Acknowledgements The authors are grateful to Jasco Instruments for allowing use of their instruments. References [1] D.R. Bobbit and S.W. Linder, Trends in Analytical Chemistry. 20(3) (2001)111-123. (and review articles cited within) [2] C. Roussel, N. Vanthuyne, M. Serradeil-Albalat and J.-C. Vallejos, Journal of Chromatography A. 995 (2003) 79-85. [3] N. Berova, K. Nakanishi and R.W. Woody (editors), Circular Dichroism:Principles and Applications, 2"d Ed., Wiley-VCH, New York, 2000. [4] G. Snatzke, Angewandte Chemie International Edition in English. 7(1) (1968) 14-25. [5] IBZ Messtechnik website: http ://www.ibz m e sste chn ik.de/ne w s [6] USP 28 published by the United States Pharmacopeial Convention Inc., Phi l adelphia,PA,2005. [7] D.A. Skoog, Principles of Instrumental Analysis, 3 Ed., Saunders College Publishing, U.S.A, 1985. [8] Validation of analytical procedures: Methodology Q2B (1996) from the International Conference on Harmonization of Technical Requirements for the Registration of Pharmaceuticals for Human Use. [9] M.R. Hadley and G.D. Jonas, Enantiomer. 5(3-4) (2000) 357-368. Table 1: Summary of system precision data for the four commercial chiral detectors studied. [ND= not detected] TSO Ethyl Propranolol 2-methyl-1- Naproxen Methyl chrysanthe- tetralone methionine mate Polarimeter-1 Concentration (mg/mL) 0.5423 0.5018 0.5339 0.5461 0.5296 5.746 %RSD Enantiomer 1 1.55 11.22 16.75 18.56 8.26 12.60 %RSD Enantiomer 2 1.35 24.99 10.64 9.19 12.98 6.02 Polarimeter-2 Concentration (mg/mL) 0.5453 0.4914 0.5425 0.4864 0.5184 2.069 %RSD Enantiomer 1 0.90 11.29 12.61 8.76 11.39 28.86 %RSD Enantiomer 2 0.77 23.72 21.92 5.24 11.11 32.39 ORD Concentration (mg/mL) 0.5204 0.4768 0.5223 0.5522 0.5167 2.3002 %RSD Enantiomer 1 2.09 7.72 13.54 11.27 31.58 ND %RSD Enantiomer 2 1.54 16.21 17.00 19.89 43.35 ND CD Concentration (mg/mL) 0.0536 0.5104 0.5299 0.6207 0.5241 0.5311 %RSD Enantiomer 1 0.30 2.23 1.20 2.99 0.45 8.18 %RSD Enantiomer 2 1.03 1.50 2.05 5.10 0.41 8.46 Concentration (mg/mL) 0.0796 0.0825 0.0725 %RSD Enantiomer 1 14.21 13.11 0.85 %RSD Enantiomer 2 5.65 3.77 0.75 Table 2: High concentration linearity data. TSO Ethyl Propranolol 2-methyl- Naproxen Methyl chrysanthe- 1-tetralone methionine mate Polarimeter-1 Concentration 0.5423- 0.5249-1.4338 0.5339-1.5254 0.1677- 0.5296- 2.2984- range (mg/mL) 1.5494 1.5604 1.513 5.7460 Enantiomer 1 Correlation 0.9995 Response not linear 0.9801 0.9413 0.9780 0.9409 coefficient (r) Enantiomer 2 Correlation 0.9999 Response not linear 0.9767 0.9527 0.9189 0.9429 coefficient (r) Polarimeter-2 Concentration 0.5453- 0.4914-1.40400.1580-1.3175 0.4864- 0.1527- 2.0689- range (mg/mL) 1.5580 1.3896 1.4810 5.9110 Enantiomer 1 Correlation 0.9910 0.8977 0.9738 0.9880 0.9725 0.8650 coefficient (r) Enantiomer 2 Correlation 0.9862 0.9239 0.8692 0.9378 0.9461 0.6373 coefficient (r) Concentration 0.5204- ORD 0.5522- 0.5167- 2.3002- 0.4768-1.36220.5223-1.4922 range (mg/mL) 1.4868 1.5777 1.4762 6.5720 Enantiomer 1 Correlation 0.9858 0.8567 0.9021 0.9916 0.9346 0.8831 coefficient (r) Enantiomer 2 Correlation 0.9887 0.8658 0.9516 0.9662 0.8977 0.8166 coefficient (r) CD Concentration 0.0487- 0.5104-1.45820.5299-1.5140 0.6207- 0.5241- 0.5311- range (mg/mL) 0.1461 1.7734 1.4973 1.5174 Enantiomer 1 Off-scale @ Correlation 0.9997 0.7291 0.9947 0.9847 Off-scale @ 0.75 mg/mL 0.9939 coefficient (r) mg/mL Enantiomer 2 Correlation 0.9888 0.9878 0.9919 0.9912 Off-scale @ 0.75 mg/mL 0.9812 coefficient (r) Table 3:Low concentration linearity data. [ND = not detected] TSO chrysanthe- Propranolol 2-methyl- l-tetralone Naproxen Methyl methionine mate Polarimeter-1 Concentration range (mg/mL) 0.05378- 0.16134 ND 0.12805- 0.15366 ND ND ND Enantiomer 1 Correlation 0.9695 ND 0.9181 ND ND ND coefficient (r) Enantiomer 2 Correlation 0.9806 ND 0.8542 ND ND ND coefficient (r) Polarimeter-2 Concentration range (mg/mL) 0.0578- 0.1734 ND ND 0.1440- 0.2160 ND ND Enantiomer 1 Correlation 0.9825 ND ND 0.8291 ND ND coefficient (r) Enantiomer 2 Correlation 0.9892 ND ND 0.7900 ND ND coefficient (r) ORD Concentration 0.04376- ND ND 0.0543- ND ND range (mg/mL) 0.13128 0.1629 Enantiomer 1 Correlation 0.9382 ND ND 0.9138 ND ND coefficient (r) Enantiomer 2 Correlation 0.9207 ND ND 0.8685 ND ND coefficient (r) CD Concentration 0.00487- 0.06274- 0.05108- 0.02358- 0.02207- 0.04914- range (mg/mL) 0.01461 0.18822 0.15324 0.23584 0.06621 0.14742 Enantiomer 1 Correlation 0.9992 0.9893 0.9946 0.9834 0.9990 0.8897 coefficient (r) Enantiomer 2 Correlation 0.9967 0.9907 0.9959 0.9919 0.9932 ND coefficient (r) Table 4: Limits of detection for the six study compounds on the four chiral detectors.[Units are in mg/mL unless otherwise noted] TSO Ethyl Propranolol 2-methyl- Naproxen Methyl chrysanthe- 1-tetralone methionine mate Polarimeter-1 Enantiomer 1 LD 6.72 0.978 0.147 0.363 0.166 1.056 calculated Ag/mL Enantiomer 1 LD measured 0.053 0.502 0.154 0.546 0.126 2.298 Enantiomer 2 LD calculated 0.031 0.670 0.082 0.285 0.397 0.361 Enantiomer 2 LD measured 0.053 0.502 0.154 0.546 0.126 2.298 Polarimeter-2 Enantiomer 1 LD calculated 1.07 ug/mL 0.355 0.201 0.116 0.245 3.368 Enantiomer 1 LD measured 0.058 0.491 0.543 0.144 0.153 2.069 Enantiomer 2 LD calculated 0.015 0.231 0.298 0.150 0.259 4.773 Enantiomer 2LD measured 0.058 0.491 0.543 0.144 0.153 2.069 ORD Enantiomer 1 LD calculated 0.059 0.610 0.328 0.049 0.267 2.053 Enantiomer 1LD measured 0.044 0.477 0.522 0.054 0.517 5.586 Enantiomer 2 LD calculated 0.071 0.660 0.137 0.088 0.525 1.695 Enantiomer 2LD 0.044 0.477 0.522 0.054 0.517 5.586 measured CD Enantiomer 1 LD calculated 0.13ug/mL 11.80 ug/mL 5.26 ug/mL 0.021 2.76 pg/mL 0.028 Enantiomer 1 LD measured 4.87 ug/mL 0.023 4.65 pg/mL 0.024 0.022 0.049 Enantiomer 2 LD calculated 0.27 Ag/mL 0.027 8.95 ug/mL 0.019 4.29 ug/mL 0.421 Enantiomer 2 LD measured 4.87 ug/mL 0.023 4.65 pg/mL 0.024 0.022 0.098 Table 5: Limits of quantitation for the six study compounds on the four chiral detectors.[Units are in mg/mL unless otherwise noted] TSO Ethyl Propranolol 22-methyl- Naproxen Methyl chrysanthe- l-tetralone methionine mate Polarimeter-1 Enantiomer 1 LQ 0.022 3.259 0.490 1.209 0.553 3.519 calculated Enantiomer 2 LQ calculated 0.103 2.232 0.273 0.948 1.324 2.102 Polarimeter-2 Enantiomer 1 LQ calculated 3.57 ug/mL 1.183 0.670 0.387 0.816 11.227 Enantiomer 2 LQ calculated 0.048 0.768 0.994 0.500 0.864 15.910 ORD Enantiomer 1 LQ calculated 0.195 2.035 1.095 0.163 0.892 6.845 Enantiomer 2 LQ calculated 0.236 2.201 0.457 0.295 1.749 5.649 CD Enantiomer 1 LQ calculated 0.45 ug/mL 0.039 0.018 0.069 9.20 pg/mL 0.094 Enantiomer 2 LQ calculated 0.89 ug/mL 0.089 0.030 0.065 14.30 pg/mL 1.405 List of Figure Legends Figure 1: Optical processes in the polarimeter Figure 2: Graphical depiction of the plain curve and with Cotton effects [5] Figure 3: Optical components of a CD detector Figure 4: Structures of compounds used in detector study. Figure 5: CD chromatograms of naproxen and 2-methyl-1-tetralone at 230 nm showing that the signal is not optimized.
关闭-
1/23
-
2/23
还剩21页未读,是否继续阅读?
继续免费阅读全文产品配置单
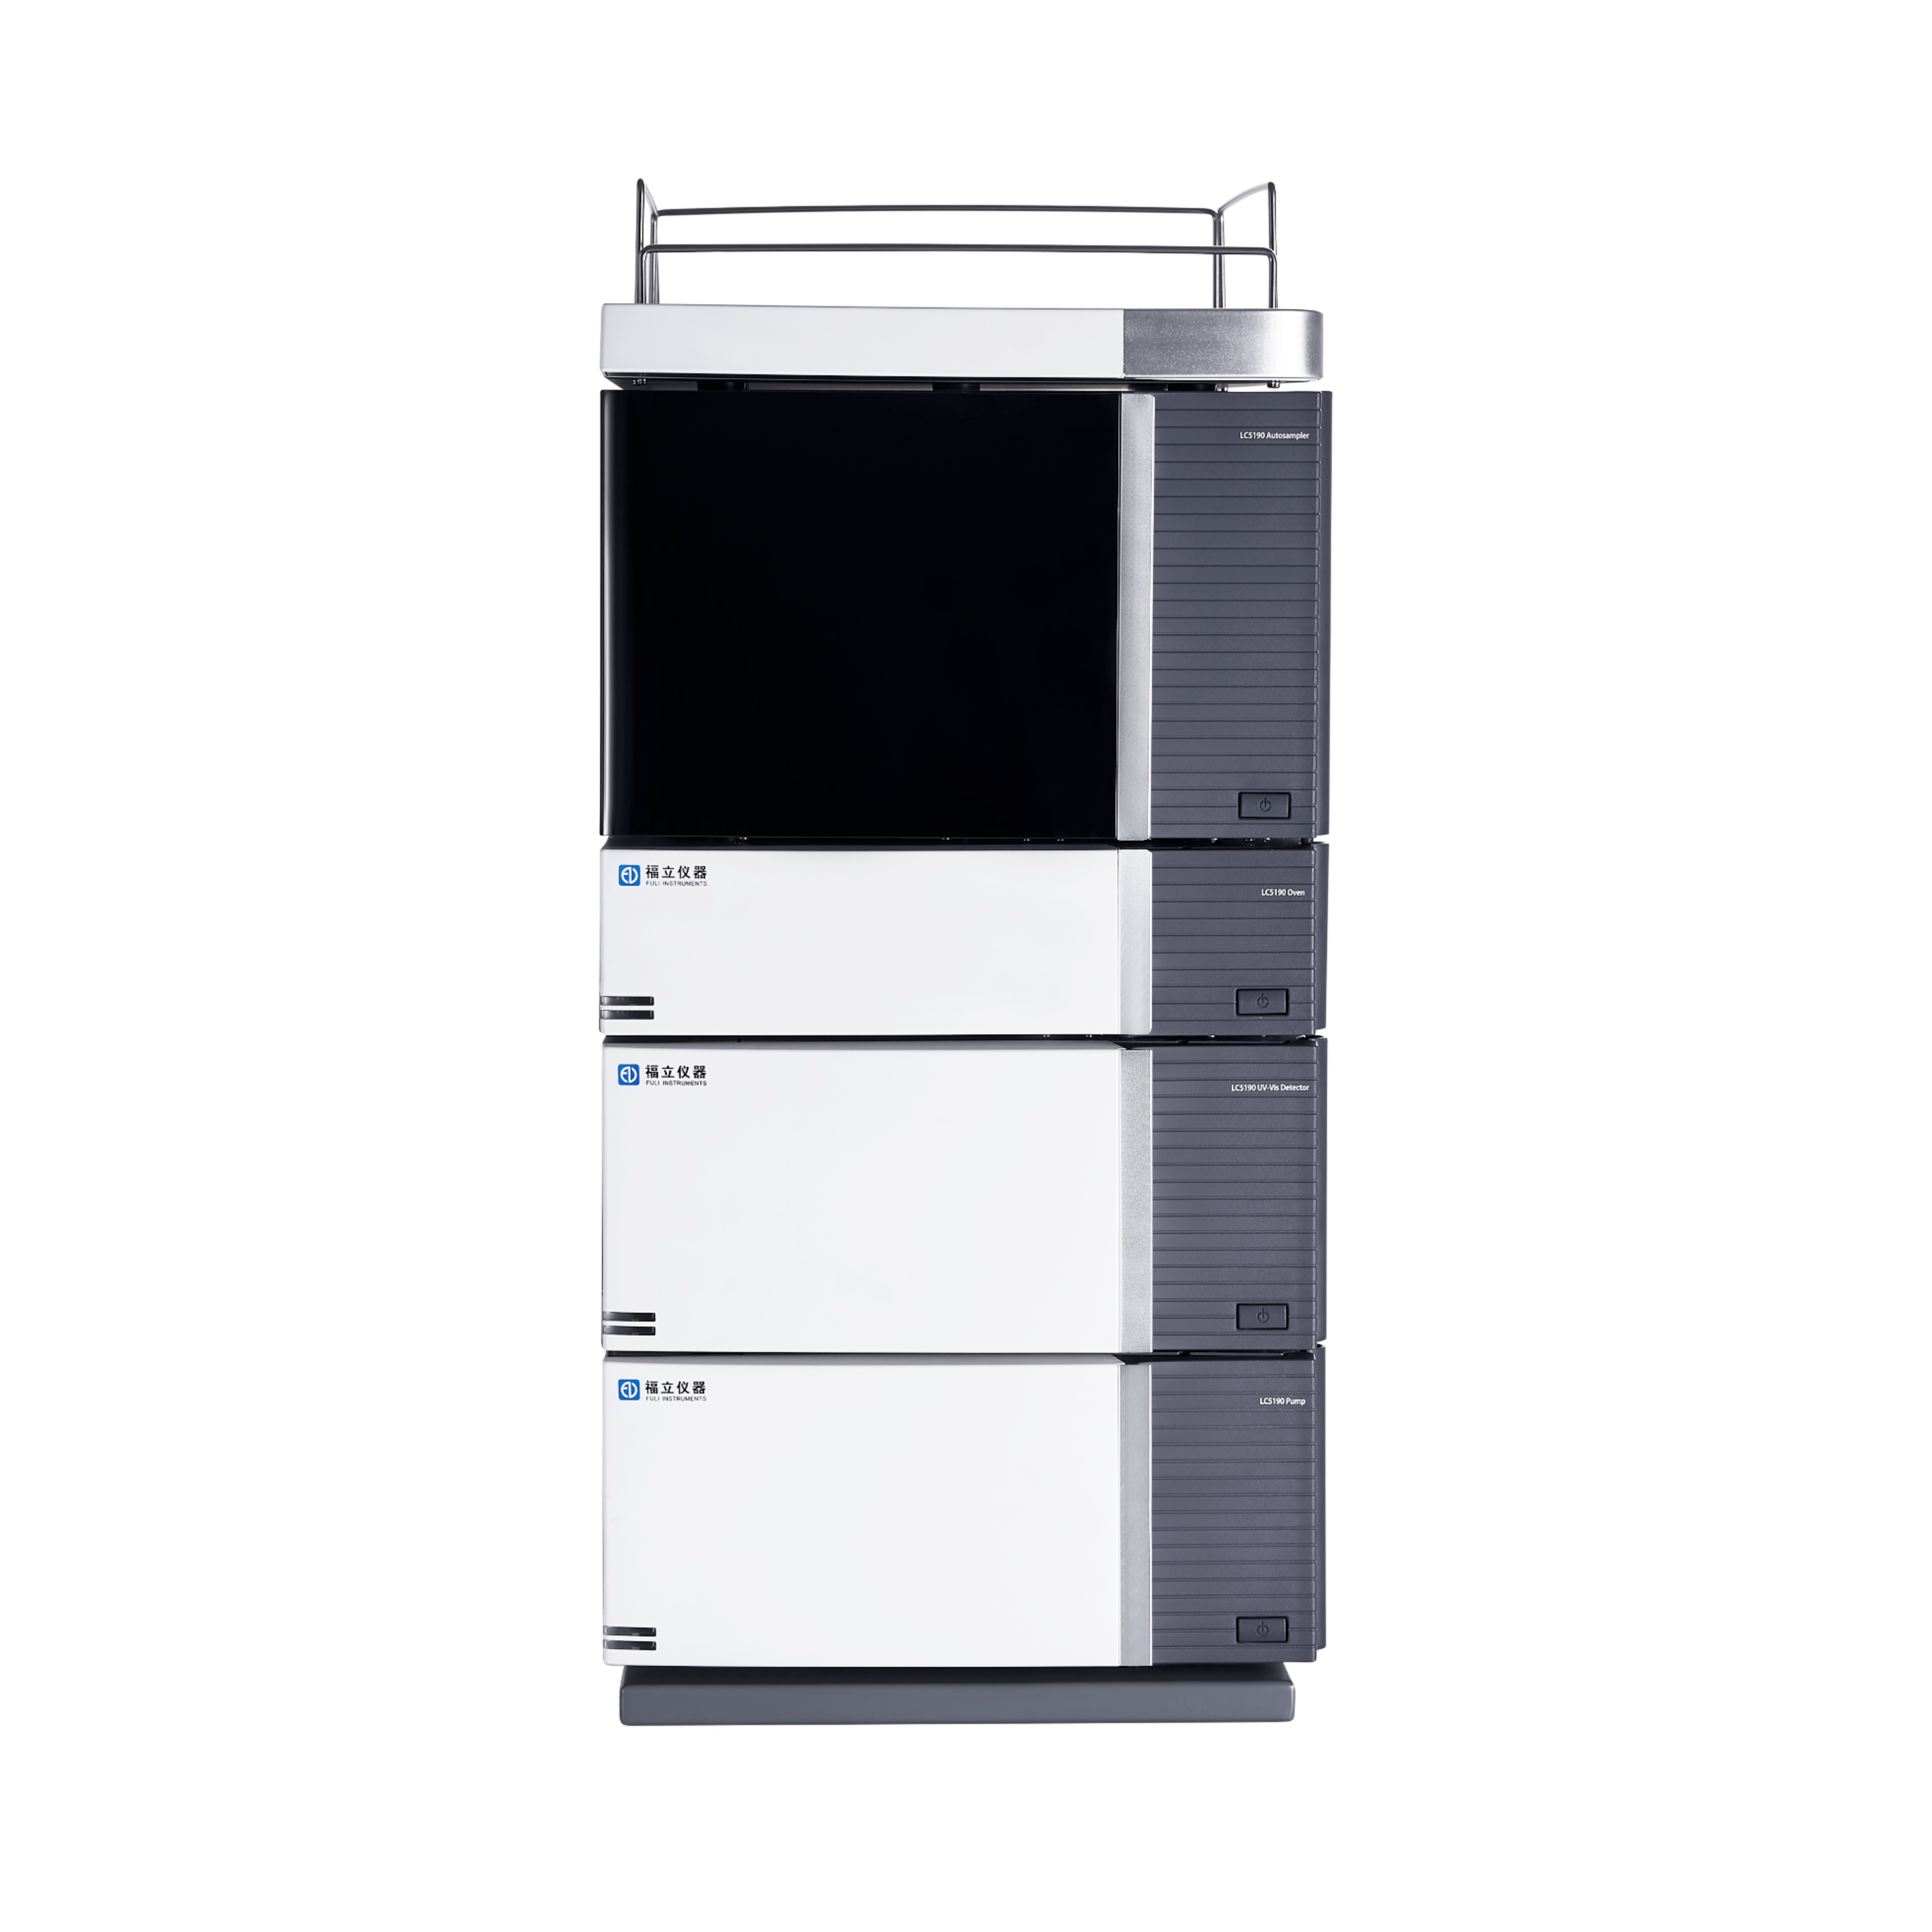
佳士科商贸有限公司为您提供《四种商用高效液相色谱手性检测器的评价:三种偏振仪和圆二色谱检测器的比较》,该方案主要用于其他中手性检测器对比、比较检测,参考标准《暂无》,《四种商用高效液相色谱手性检测器的评价:三种偏振仪和圆二色谱检测器的比较》用到的仪器有JASCO高效色谱仪LC-4000、JASCO圆偏振荧光光谱仪CPL-300、JASCOFP-8000系列荧光光谱仪、JASCO圆二色光谱仪CD J-1500。
我要纠错
推荐专场
相关方案
 咨询
咨询