方案详情文
智能文字提取功能测试中
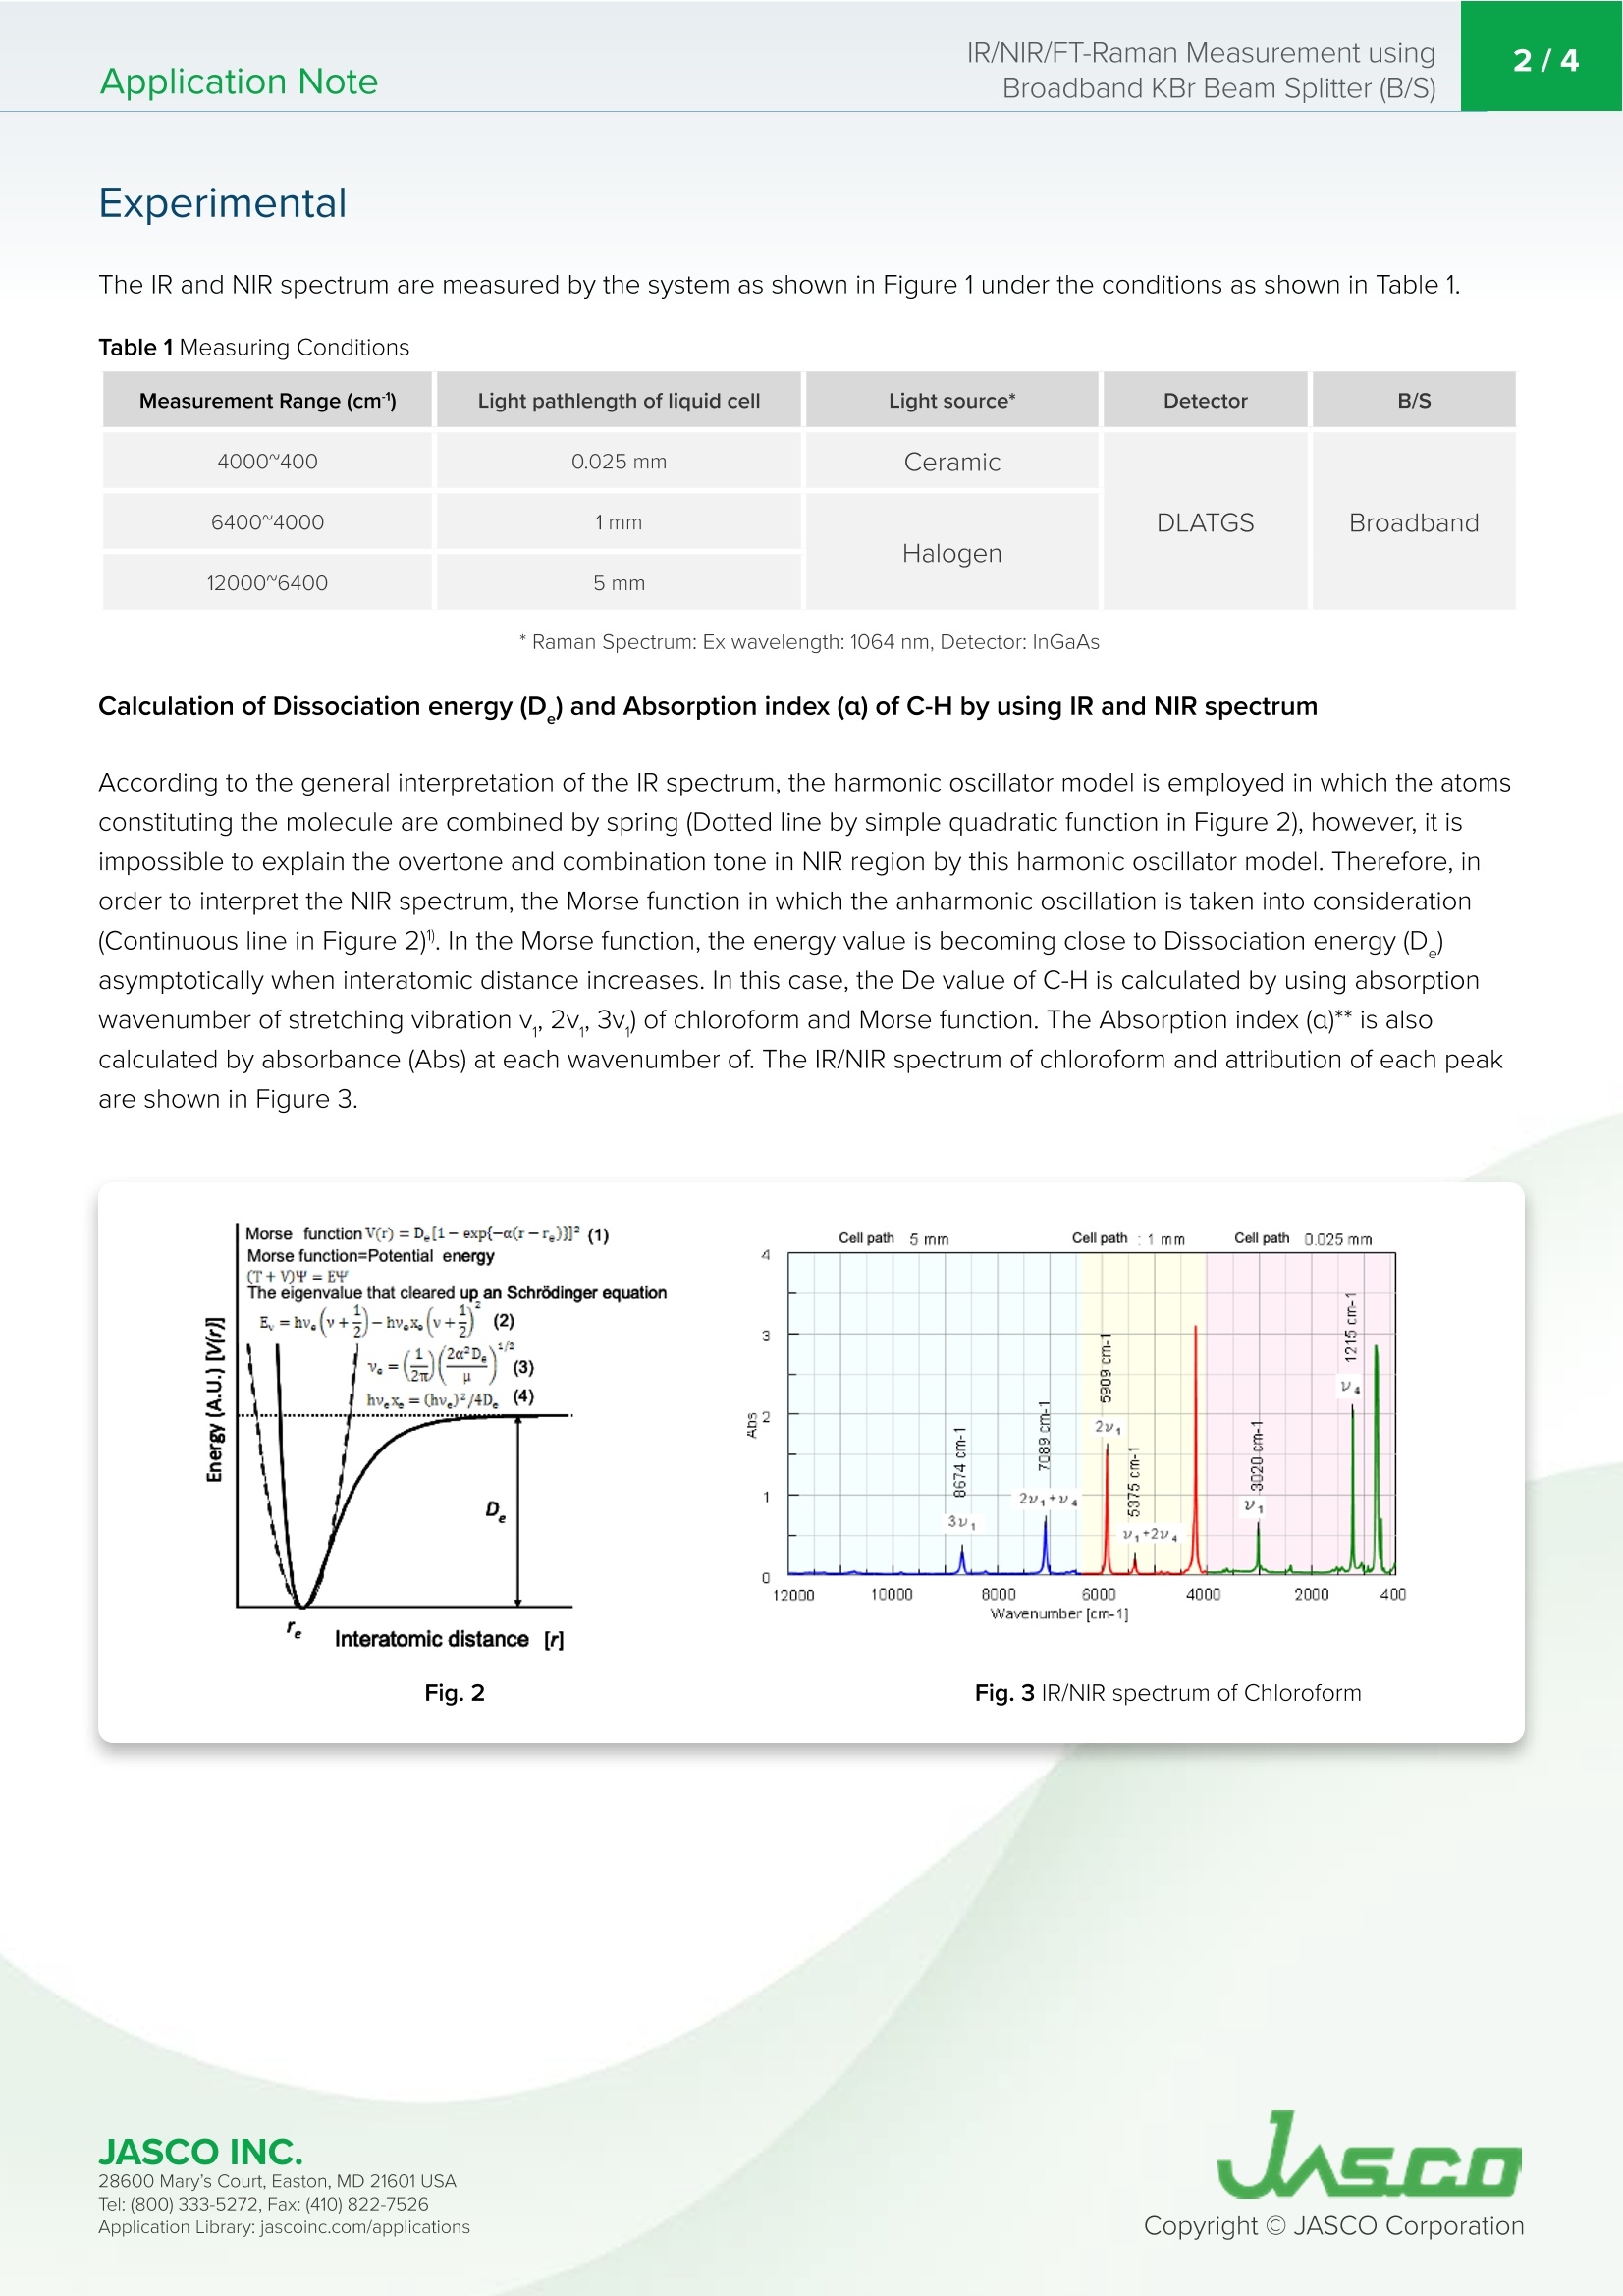
肝素红外光谱(MIR或NIR)和拉曼光谱广泛用于聚合物、食品、医药和半导体行业的定性和定量分析;通过这些技术的结合,可以获得更多关于样品物理性质的信息。例如,如果将MIR和NIR光谱相结合,则可以获得以下信息。•分子离解能(De)•红外和近红外区域的吸收指数(α)•光学常数(n,k)这些值可以为化学反应的预测或各种装置的设计提供重要的感知。此外,如果将IR和拉曼光谱相结合,则可以获得以下信息。•关于分子振动的补充信息•通过在低波数范围内测量获得的晶格振动信息(拉曼光谱特有)•与重原子结合时的分子振动信息该应用数据显示了通过使用这种宽带KBr B/S测量IR/NIR/Raman光谱来感知Chloroform的基本物理性质。Application Note260-TR-0228 IR/NIR/FT-Raman Measurement usingBroadband KBr Beam Splitter (B/S)2/4Application Note IR/NIR/FT-Raman Measurement using Broadband KBr Beam Spl i tter (B/S) Introduction Hepar i ns Infrared (MIR or NIR) and Raman spectroscopy are widely used for qualitative and quantitative analysis for polymer, food, medicine and semiconductor industries; with the combination of these techniques, it i s possible to obtain more information about physical properties of the sample. For example, if MIR and NIR spectroscopy are combined, the following information can be obtained. · Dissociation energy of molecule (D) Fig.1 System mounted with broadband KBr B/S (For IR/NIR/FT-Raman) ·Absorption index i n the IR and NIR region (a) · Optical constant (n, k) These values can provide the important perception for prediction of the chemical reaction or design of various devices.Additionally, if IR and Raman spectroscopy are combined, the following information can be obtained. ·Complementa r y information on molecular vibration · Information on lattice vibration by measurement in low wavenumber range (specific to Raman spectroscopy) · Information on molecular vibration when combined with heavy atom FTIR i nstrument can measure the IR/Near IR/Far I R spectrum by selecting the prope r light source, detector, and B/S, and if the FT-Raman system is used, Raman spectrum can also be obtained. The measurement range covered by general B/S used in FTIR i s from 7800 to 375 cm, while the newly developed broadband KBr B/S covers the range f rom 12000to 375 cm, enabling the measurement of IR/NIR/Raman spectrum without replacing the B/S. This application data shows the perception of the basic physical property of the chloroform by measur i ng the IR/NIR/Raman spectrum using such broadband KBr B/S. Keyword s Experimental The I R and NIR spec t rum are measured by the system as shown i n F i gure 1 under the conditions as shown i n Table 1. Table 1 Measur i ng Condi ti o n s Measurement Range (cm) Light pathlength of liquid cell Light source* Detector B/S 4000~400 0.025mm Ceramic Broadband 6400~4000 1mm DLATGS 12000~6400 5mm Halogen * Ram an Spect ru m : Ex wav e le ng t h: 1064 nm , D e t e c t o r : In G aAs Calculation of Dissociation energy (D) and Absorption index (a) of C-H by using IR and NIR spectrum According to the general interpretation of the IR spectrum, the harmonic oscillator model is employed in which t he atoms constit u t i ng the molecule are combi n ed by spring (Dotted line by simple quadratic funct i on in Figure 2), however, it is impossible to explain the overtone and combination tone in NIR region by this harmonic oscillator model. T herefore, i n ord e r to interpret the NIR spectrum, the Morse function in which the anharmonic oscillation is taken i nto consideration (Continuous line in Figure 2). In the Morse function, the energy value is becoming close to Dissociation energy (D)asymptotically when interatomic distance increases. In this case, the De value of C-H is calculated by using absorption wavenumber of stretching vibration v,, 2v, 3v,) of chloroform and Morse function. T he Absorption index (a)** is also calculated by absorbance (Abs) at each wavenumber of. The IR/NIR spectrum of chloroform and attr i bution of each peak are shown in F i gure 3. Fig.2 Fig.3 I R/NIR spectrum of Chloroform 28600 Mary's Cour t , E asto n, MD 21601US A T el : (800) 333-5272, Fa x : (410) 822-7526A ppli c a tio n Lib r ary: jasc o i n c.com /appli c ati o ns The dissociation energy (D) of C-H i n chloroform i s calculated to be 460 +/- 7 kJ/mol f rom equat i on 2, equation 4, and value of absorption wavenumber of stretching vibration of C-H (v,,2v,3v,)2. The absorption index a of n1, 2v ,, 3v is calculated from measured spectra to be 219, 15.5, and 0.56 respectively as shown in Table 2. From those results, for general organic substances, it i s estimated t hat the sample with high concentration can be quantitated,such as about several 10 times if 2v, is used and about several 100 times if 3v, i s used. Therefore,in NIR range, it is possible to measure the samples i n non-destructive method, without dilution which is required for I R measurement . Table 2 Absorbance index and assignme n t of Chloroform Wavenumber (cm) Assignment Abs a** 3020 V (C-H stretching vibration) 0.55 219 1215 V (C-H bending vibration) 2.02 806 5375 V+2V 0.19 1.88 5909 2V, 1.55 15.5 7089 2v,+V 0.65 1.30 8674 3v, 0.28 0.56 ** a: Absorbance if t he l i gh t pa t h i s 1 cm fo r t h is e x p er ime n t Figure 4 shows the I R spectru m (Vertical axis: %T) a n d FT -Raman spectrum (Vertical axis: Int .). The peak intensity ratio in IR spectrum between v and v of C-H i s abou t 3.68 f rom Tab l e 2. Regarding t his, s i nce the intensi t y ratio in Raman spectrum is about 1/4, it i s confirmed tha t the peak intensities o f IR and Raman spectrum are complementary. In general , when the change of the dipole moment in the molecular vibrat i on is larger (asymmet r ic v i bration mode), t h e intensity of peak i n I R spectrum appears higher , while the stronger peak in Raman spectrum i s detected when the change of the polarizability is larger (symmetr i c vibration mode). Therefore , the change of the dipole momen t for n1 of C-H is considered to be larger than t he one of v(the change of polarizability i s smaller). The vibration of molecule combined with t he heavy atom like C -Cl can be considered to be detected i n the range l ess than 400 cm1 f rom Raman spectrum. It is important to select IR or FT -Raman depending on t he vibration mode even i f the structure of molecu l e is s i mple like Chloroform. Fig.4 IR and F T -Raman spectrum of C h lo r ofor m (Vert i cal scale: A.U. due to showing %T and I n t., Horizontal scale: [cm'] fo r wavenumber and Raman s h if t .) Result This application data shows one of the topics in vibrational spectroscopy taking the Chloroform for example, using broadband KBr B/S. Besides, i t can be considered that as well as t he general qualitative and quantitative analysis, the broadband KBr B/S can be applied to t he 2D corre l ated spec t roscopy based on chemical reaction analysis by t ime -course measurement us i ng 3 measurement methods. By usi n g broadband KBr B/S which does not require replacement,the measurement mode can be switched without breaking vacuum or interrupting N, purge. This broadband B/S wi ll expand the potential to wi d er application f i elds. 1. Kenneth W. Busch, et ,al, Appl. Spectrosc. 54,1321(2000) 2.Chemical Handbook, the revised third edition JASCO IN C. 28600 Mary's Cour t , E asto n, MD 21601US A T el : (800) 333-5272, Fa x : (410) 822-7526A ppli c a tio n Lib r ary: jasc o i n c.com /appli c ati o ns
关闭-
1/4
-
2/4
还剩2页未读,是否继续阅读?
继续免费阅读全文产品配置单
佳士科商贸有限公司为您提供《使用宽带KBr分束器(B/S)进行IR/NIR/FT拉曼测量》,该方案主要用于其他中宽带KBr、拉曼、红外、近红外检测,参考标准《暂无》,《使用宽带KBr分束器(B/S)进行IR/NIR/FT拉曼测量》用到的仪器有JASCONRS5000/7000共聚焦激光拉曼光谱仪、JASCO傅立叶变换红外光谱仪FT/IR-6000。
我要纠错


相关方案
 咨询
咨询