

方案详情文
智能文字提取功能测试中
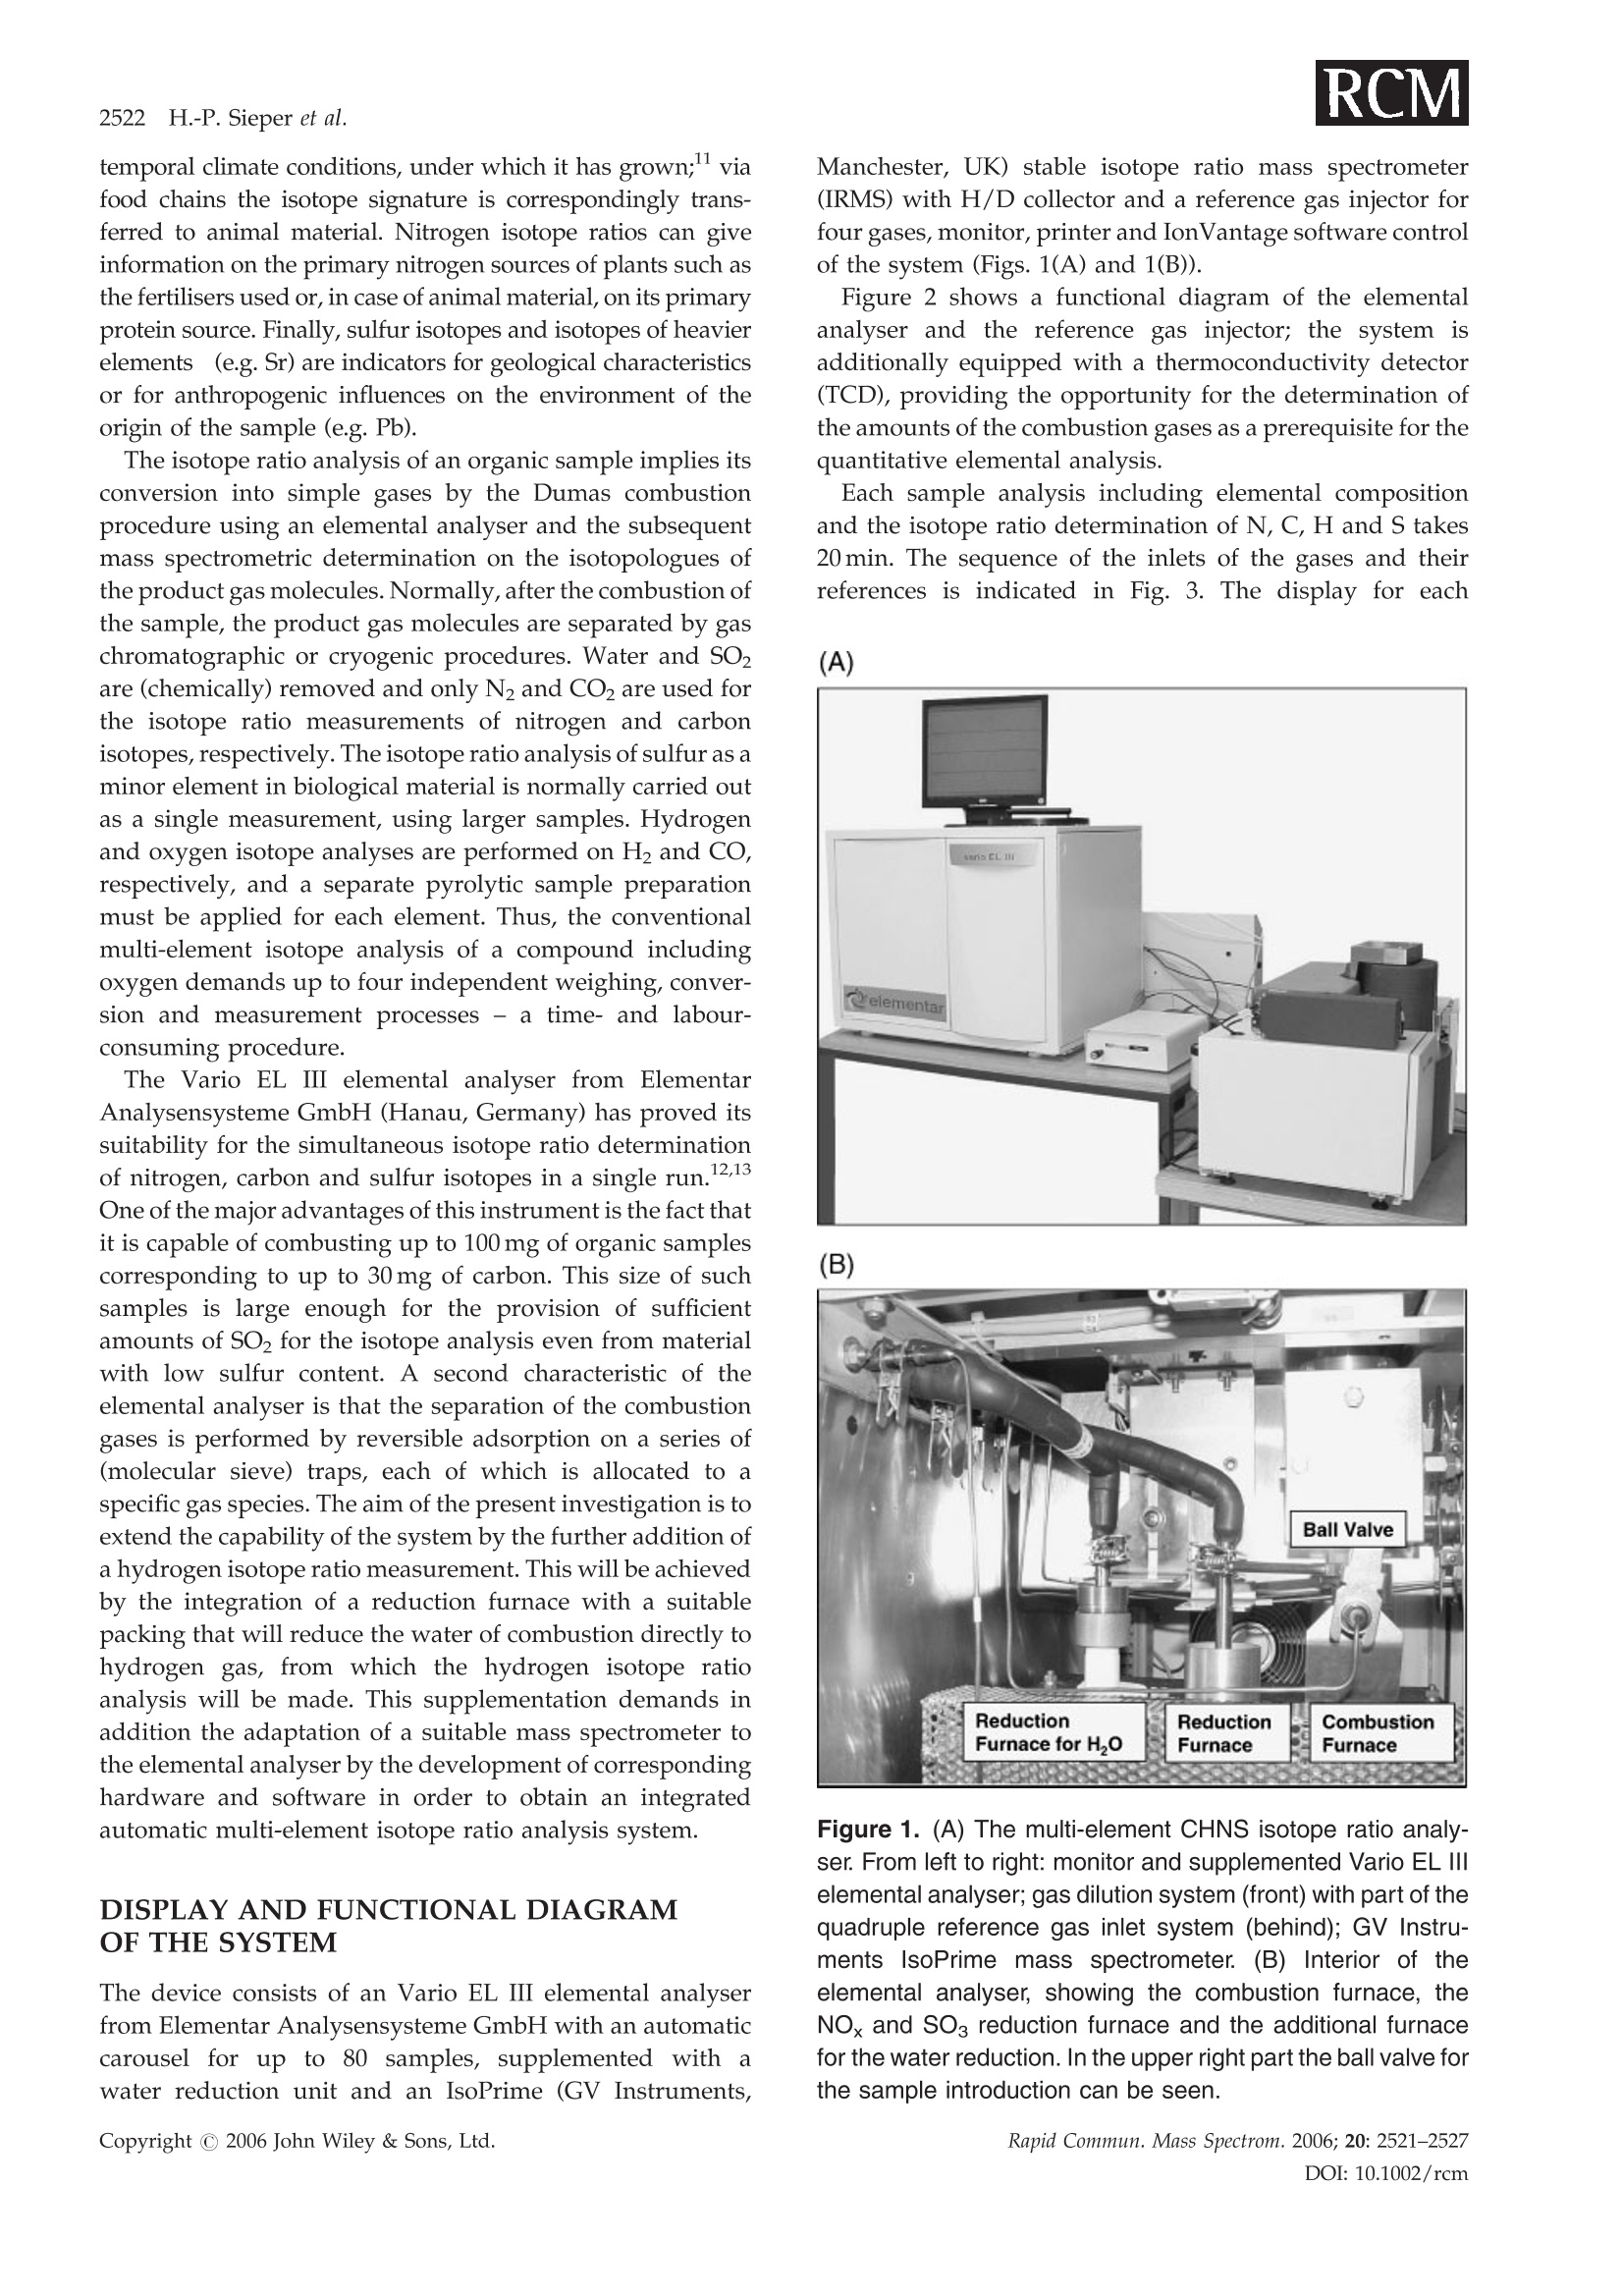
RAPID COMMUNICATIONS IN MASS SPECTROMETRYRapid Commun. Mass Spectrom. 2006; 20: 2521-2527Published online in Wiley InterScience (www.interscience.wiley.com) DOI: 10.1002/rcm.2619 H.-P. Sieper et al.2522 A measuring system for the fast simultaneous isotoperatio and elemental analysis of carbon, hydrogen,nitrogen and sulfur in food commodities and otherbiological material Hans-Peter Sieper, Hans-Joachim Kupka, Tony Williams?, Andreas Rossmann,Susanne Rummel, Nicole Tanz and Hanns-Ludwig Schmidt* 'Elementar Analysensysteme GmbH, Donaustrasse 7, D-63452 Hanau, Germany ‘GV Instruments, Crewe Road, Manchester M23 9BE, UK isolab GmbH, Woelkestrasse 9/1, D-85301 Schweitenkirchen, Germany Received 18 April 2006; Revised 30 May 2006; Accepted 19 June 2006 The isotope ratio of each of the light elements preserves individual information on the origin andhistory of organic natural compounds. Therefore, a multi-element isotope ratio analysis is the mostefficient means for the origin and authenticity assignment of food, and also for the solution of variousproblems in ecology, archaeology and criminology. Due to the extraordinary relative abundances ofthe elements hydrogen, carbon, nitrogen and sulfur in some biological material and to the need forindividual sample preparations for H and S, their isotope ratio determination currently requires atleast three independent procedures and approximately 1 h of work. We present here a system for theintegrated elemental and isotope ratio analysis of all four elements in one sample within 20 min. Thesystem consists of an elemental analyser coupled to an isotope ratio mass spectrometer with an inletsystem for four reference gases (N2, CO2, H2 and SO2). The combustion gases are separated byreversible adsorption and determined by a thermoconductivity detector; H2O is reduced to H. Theanalyser is able to combust samples with up to 100 mg of organic material, sufficient to analysesamples with even unusual elemental ratios, in one run. A comparison of the isotope ratios ofsamples of water, fruit juices, cheese and ethanol from wine, analysed by the four-element analyserand by classical methods and systems, respectively,yielded excellent agreements. The sensitivity ofthe device for the isotope ratio measurement of C and N corresponds to that of other systems. It is lessby a factor of four for H and by a factor of two for S, and the error ranges are identical to those of othersystems. Copyright C 2006 John Wiley & Sons, Ltd. Isotope ratio measurements have become the most importantandI most frequently applied method for originandauthenticity determinations of food commodities,1-3 frag-rances or flavourings, and other natural products. Theyhave also been indispensable for the treatment and under-standing of environmental and ecological questions, in foodweb and nutrition studies,8in archaeology, and in forensicsciences. All of these investigations demonstrate that it isadvantageous, perhaps even obligatory, to perform theanalyses, whenever possible, as a multi-element or multi-compound/multi-element isotope ratio determination. Asthe isotope ratio of each of the bioelements is individuallycorrelated to the conditions of biosynthesis and secondarytreatments of natural compounds, a multi-element isotopeanalysis will provide the greatest amount of independent ( *Correspondence to: H.-L S chmidt, Pr ielhofweg 2, D - 84036 Landshut, Germany. ) ( E-mail: hlschmidt@web.de Contract/grant sponsor: A r beitsgemeinschaft industrieller For-schungsvereinigungen 'Otto von Guericke’e.V.; contract/grantnumber: PRO INNO II, KU 0 035801 RK 4. ) information for the characterisation and assignment of originof the material in question. The source of adsorbed water and of bound oxygen andhydrogen in the biological material under investigation isalways water; therefore, the corresponding isotope ratiosreflect the isotopic signature of the local precipitation of theproduction area and so may be correlated to its latitude or itsdistance from the ocean. In some cases, the isotope ratio data ofthe tissue water of an unknown biological sample may beindicative of its geographic origin but often the isotopecharacteristics of this water can be modulated by secondaryexternal influences. Therefore, it would be better and morereliable to measure the isotope ratios of the organically boundhydrogen or oxygen, which preserve the original information,and integrate it over a longer period. The carbon isotope ratioplant material is determined primarily by the photosynthesistype of the plant in question (C3-, C4-metabolism andcrassulacean acid metabolism (CAM)), but also by local and temporal climate conditions, under which it has grown;viafood chains the isotope signature is correspondingly trans-ferred to animal material. Nitrogen isotope ratios can giveinformation on the primary nitrogen sources of plants such asthe fertilisers used or, in case of animal material, on its primaryprotein source. Finally, sulfur isotopes and isotopes of heavierelements ((e.g. Sr) are indicators for geological characteristicsor for anthropogenic influences on the environment of theorigin of the sample (e.g. Pb). The isotope ratio analysis of an organic sample implies itsconversion into simple gases by the Dumas combustionprocedure using an elemental analyser and the subsequentmass spectrometric determination on the isotopologues ofthe product gas molecules.Normally, after the combustion ofthe sample, the product gas molecules are separated by gaschromatographic or cryogenic procedures. Water and SO2are (chemically) removed and only N2 and CO2 are used forthe isotope ratio measurements of nitrogen and carbonisotopes, respectively. The isotope ratio analysis of sulfur as aminor element in biological material is normally carried outas a single measurement, using larger samples. Hydrogenand oxygen isotope analyses are performed on H2 and CO,respectively, and a separate pyrolytic sample preparationmust be applied for each element. Thus, the conventionalmulti-element isotope analysis of a compound includingoxygen demands up to four independent weighing, conver-sion and measurement processes - a time- and labour-consuming procedure. The Vario EL II elemental analyser from ElementarAnalysensysteme GmbH (Hanau, Germany) has proved itssuitability for the simultaneous isotope ratio determinationof nitrogen, carbon and sulfur isotopes in a single run.1213One of the major advantages of this instrument is the fact thatit is capable of combusting up to 100 mg of organic samplescorresponding to up to 30 mg of carbon. This size of suchsamples is large enough for the provision of sufficientamounts of SO2 for the isotope analysis even from materialwith low sulfur content. A second characteristic of theelemental analyser is that the separation of the combustiongases is performed by reversible adsorption on a series of(molecular sieve) traps, each of which is allocated to aspecific gas species. The aim of the present investigation is toextend the capability of the system by the further addition ofa hydrogen isotope ratio measurement. This will be achievedby the integration of a reduction furnace with a suitablepacking that will reduce the water of combustion directly tohydrogen gas, from which the hydrogen isotope ratioanalysis will be made. This supplementation demands inaddition the adaptation of a suitable mass spectrometer tothe elemental analyser by the development of correspondinghardware and software in order to obtain an integratedautomatic multi-element isotope ratio analysis system. DISPLAY AND FUNCTIONAL DIAGRAMOF THE SYSTEM The device consists of an Vario EL III elemental analyserfrom Elementar Analysensysteme GmbH with an automaticcarousel for up to 80 samples, supplemented with iwater reduction unit and an IsoPrime (GV Instruments, Manchester, UK) stable isotope ratio mass spectrometer(IRMS) with H/D collector and a reference gas injector forfour gases, monitor, printer and Ion Vantage software controlof the system (Figs. 1(A) and 1(B)). Figure 2 shows a functional diagram of the elementalanalyser and the reference gas injector; the system isadditionally equipped with a thermoconductivity detector(TCD), providing the opportunity for the determination ofthe amounts of the combustion gases as a prerequisite for thequantitative elemental analysis. Each sample analysis including elemental compositionand the isotope ratio determination of N, C, H and S takes20 min. The sequence of the inlets of the gases and theirreferences is indicated in Fig. 3. The display for each (A) (B) Figure 1. (A) The multi-element CHNS isotope ratio analy-ser. From left to right: monitor and supplemented Vario EL IIIelemental analyser; gas dilution system (front) with part of thequadruple reference gas inlet system (behind); GV Instru-ments IsoPrime mass spectrometer. (B) Interior of theelemental analyser, showing the combustion furnace, theNOx and SOs reduction furnace and the additional furnacefor the water reduction. In the upper right part the ball valve forthe sample introduction can be seen. Figure 2. Functional diagram and running mode of the supplemented Vario EL III elementalanalyser for the simultaneous elemental analysis and isotope ratio mass spectrometry ofhydrogen, nitrogen, carbon and sulfur in a single sample (sample size up to 100mg).MV= magnetic valve, TCD= thermoconductivity detector, IRMS=isotope ratio mass spec-trometer (GV Instruments IsoPrime). By means of a ball valve the sample (in a tin capsule) isdropped into the combustion tube (WOs at 1150C). The gases pass through a reduction tube(Cu at 850℃) for the reduction of NOx and SOs, then through three traps with specificadsorbers for the condensation of SO2, H2O and CO2, respectively. N2 is immediatelytransferred to the IRMS followed, after heating of the corresponding trap, by CO2. The watertrap is then heated and the water passed (by-pass via MV9/MV8) through the H20 converter(Mg at 600℃). Finally, SO2 is liberated and transported (short-cut MV3/MV2) to the IRMS. 06:16:24 Figure 3. Display of the mass traces (from bottom to top) of the four gases for the isotope ratiodetermination of a sample of cheese protein (casein) with N, C, H and S. The measurementsequence is for N2: reference-sample, for CO2: sample-reference, for H2: reference- sampleand for SO2: sample - reference. The scales for each measuring gas are relative to thecorresponding maximum=100%, the numbers on the tops of the peaks indicate the time afterstart of the run. The total time for one run, yielding the information of elemental content and isotoperatio for four elements, is 20 min. The printout provides elemental content in % and isotope ratios in%o relative to international standards. Table 1. Water reduction: memory effects and reproducibility(sample size 6uL) Sample SH[%o]v-sMow Drinking water, Hanau -73.7 -58.6 -56.9 -57.7 SLAP (theoretical-428.0%o) -352.8 -414.9 -418.6 -420.4 -419.4 Drinking water, Hanau -127.2 -57.7 -57.3 -57.4 SLAP: Standard Light Antarctic Precipitation. individual gas is relative to the individual maximumconcentration=100%. The equipment and the catalysts for the sample oxidation(WOs-granulate) and for the reduction of NOx and SOs(Cu at850℃) are well established (Application Sheet from Ele-mentar Analysensysteme) and need no further comments.The reduction of water for the hydrogen isotope analysis hasformerly been performed with U, a quite good butdangerous reductant. Although Ni, Zn and more recentlyCr are most commonly used for reduction,we checked thesuitability of other metals.W, Mn, Fe and Mo were notsatisfactory, as these metals are rapidly inactivated byforming surface layers of their oxides. The reduction of thecombustion water with Mg at 600℃ was quantitative andallowed a large sample throughput due to the 100%availability and conversion of the metal. As with othermetals, memory effects were observed (Table 1). These wereobviously due not to an intermediate binding of water to thereductant, but rather to the glass surfaces. As only the runsafter a change between samples with quite large deuteriumdifferences were affected, we decided to use Mg in ourdevice. Table 2. Comparison of results from conventional (conv.)method (HT pyrolysis for 8H) and simultaneous CHNSanalysis of Ca-citrate (for detection of citric acid addition tofruit juices) Sample 8H [%o]v-sMow 813c [%o]v-PDB Synthetic mixture of conv. -68.7 -16.86 cane and beet sugars CHNS -64.2±3.8 -17.06±0.04 ■synthetic from conv. -84.3 -24.92 beet sugar CHNS -79.9 -25.22±0.15 ■synthetic from conv. -79.5 -24.86 beet sugar CHNS -78.3±2.5 -24.91±0.08 D synthetic/ conv. -46.8 -24.47 natural mixture -41.5±3.9 -24.38±0.04 ● synthetic/ conv. -50.3 -24.42 natural mixture CHNS -45.6±3.5 -24.33±0.09 natural from orange conv. -17.0 -23.99 CHNS -15.2±3.6 -23.87±0.06 ■/● are blind duplicates. COMPARISON OF CHNS ANALYSERRESULTS WITH THOSE FROMCONVENTIONAL ANALYSES In order to check the trueness and reliability of the dataobtained with the new system, samples were measuredwhich had independently been analysed before usingconventional methods and in other instruments. Hydrogensamples had been measured by a standard high-temperature(HT) pyrolysis technique by Dr C. Schlicht, BayerischesLandesamt fir Gesundheit und Lebensmittelsicherheit(LGL), OberschleiSheim, Germany, on a Thermo-FinniganXP plus IRMS. These data are given in Tables 2 and 3. Citric acid for the adulteration of fruit juices is prepared byfermentations of sugars with microorganisms. The use ofinexpensive sugars from cane or high fructose corn syrup(C4-plant origin) can easily be detected by the 81C-value,whereas C3-sugar as source can only be found via themeasurement of the deuterium content of the non-exchanging methylene groups. This measurement wasoriginally performed by the esterification of the acid andtheH-NMR analysis of the ester, a very laborious procedure Table 3. Comparison of data from conventional (conv.) method (HT pyrolysis for 8H) and simultaneous CHNS analysis. Caseinfrom cheese of different Alpinevalleys in Italy. Conventional values by Dr. C. Schlicht, Bayerisches Landesamt fur Gesundheit und Sample 8N[%]AIR 83C [%]V-PDB 8H[%]y-sMow 834S [%o]v-cDT Asiago conv. 4.77 -19.25 -105.9 5.51 CHNS 4.91±0.03 -19.43±0.02 -106.4±1.5 5.35±0.04 Fontina conv. 4.68 -22.89 -121.6 4.51 CHNS 4.93±0.06 -23.20±0.04 -123.4±0.5 4.23±0.17 Montasio conv. 4.81 -18.55 -104.7 4.53 CHNS 4.89±0.15 -18.59±0.16 -105.2±1.1 3.15±0.15 Nostr. Castf. conv. 4.43 -22.10 -122.2 7.04 CHNS 4.75±0.14 -22.13±0.05 -113.3±0.8 6.63±0.18 Spressa conv. 4.48 -21.78 -119.6 5.47 CHNS 4.66±0.05 -21.83±0.06 -116.4±0.7 5.65±0.11 Toma conv. 5.27 -21.07 -119.6 3.80 CHNS 5.64±0.31 -21.05±0.04 -111.6±1.3 4.27±0.15 Vezzena conv. 4.21 -22.13 -110.9 5.21 CHNS 4.55±0.17 -22.01十011 -113.8±0.9 5.16±0.05 8H [%o]v-sMow conventional Figure 4. Comparison of 8H-values of water and organicsamples obtained by conventional analysis (high-temperaturepyrolysis) and with the CHNS isotope analyser. requiring very large samples. The same result can be moreeasily obtained by the conventional HT pyrolytic deuteriumanalysis of Ca-citrate.We have compared data of Ca-citratesamples from classical analyses (8C by combustion,8H byHT pyrolysis) with those simultaneously produced by ourmulti-element CHNS analyser and found excellent agree-ment (Table 2). Quite good agreement between results by theanalyser and by conventional measurements was alsoobtained for all four elements in casein as the basis for theorigin assignment of cheese from different Alpine valleys in[taly (Table3). For samples with relatively high S content likehuman hair, an individualH-determination by HT pyrolysiswas more advantageous than that by the integrated waterreduction. A comparison of all the conventionally measuredH-abundances of water and organic compounds and thatacquired to date using the CHNS analyser is shown in Fig. 4.The correlation between the results from the two methods isquite convincing,and the differences between the data fromthe two modes are within the normal error range fordeuterium analyses. APPLICATIONS OF THE CHNS ANALYSERFOR THE ANALYSIS OF UNKNOWNSAMPLES The advantage of the automated multi-element isotopeanalysis is that data from all elements are simultaneously Figure 5. 8H-and 834S-values of fruit juice pulps obtainedby simultaneous isotope analysis with the CHNS analyser.Values are from Table 4. available, providing the opportunity to select the mostefficient combination for the solution of a given questioneven in cases where the other data are of minor value for anorigin assignment. The 8 C-values of the fruit juice pulpsamples shown in Table 4 are in line with the origin ofthese samples from C3- or CAM-plants excluding theaddition of sugars from a sourceof the other group but notsufficient for excluding adulteration with sugars from thesame group. Similarly, the 8N-values of the samplescannot be used for an origin assignment because there areinsufficient references available in this case. However, acombination of the 8H-and 8+S-values as indicators forlocal climate and soil characteristics (Fig. 5) is indicative ofsuch an origin assignment because the values are in goodagreement with results from a data bank establishedwithin a European research project ('PURE JUICE') onorigin and authenticity investigations on fruit juices.Similarly, satisfactory results have been obtained with theorigin identification of Emmenthaler and other PDO(protected denomination of origin) cheese samples fromdifferent European countries by comparison with datafrom Pillonel et a1.20,21 A promising result has also been obtained in the origininvestigation of wine and fruit (juices) via the fermentationproduct ethanol. Traditionally, this investigation is per-formed by a combination of a 8 C-value determination byconventional combustion-IRMS analysis with a positional Table 4. CHNS simultaneous stable isotope analysis of fruit juice pulp from different countries Sample 8N[%o]AIR 83C [%]v-PDB 8H[%o]v-SMow 834S[%o]v-cpT Pineapple/Indonesia 1.17±0.17 -13.69±0.25 -63.4±1.8 4.84±0.10 Grapefruit/Israel 6.11±0.02 -25.69±0.13 -28.3±0.9 7.82±0.25 Pineapple/Vietnam 4.89±0.03 -13.27±0.07 -60.0±1.8 5.79±0.25 Orange/Mexico 5.77±0.03 -25.96±0.11 -37.2±1.1 3.99±0.11 Orange/Spain 5.57±0.03 -25.38±0.11 -45.3±0.8 6.16±0.25 Orange/Italy 5.54±0.11 -24.80±0.12 -48.2±1.2 5.73±0.08 Orange/Brazil 6.09±0.09 -25.75±0.25 -44.5±1.3 8.02±0.35 deuterium analysis by nuclear magnetic resonance (NMR)spectroscopy. The latter demands large amounts of sample,long measuring times and very expensive instrumentation.We have combined the 13C-analysis in our CHNS analyserwith the simultaneous (average) 2H-determination on theraw ethanol (distillate, >92% alcohol as used for the NMRanalyses). Figure 6(A) shows that the average 8H-valuesare in satisfactory agreement with the NMR data and Fig. 6(B) that the isotope data of the ethanol from samples ofdifferent European areas form clusters permitting theorigin assignment of most of them. This indicates thatNMR analysis is not absolutely necessary for wine originanalysis but that in many cases the average 8H-values,simultaneously and gratuitously obtained together with the8C-values by IRMS, will be sufficient or useful for apreliminary check. A -29 -28 -27 -26 -25 -24 -23 -22 ◆apple ■ wine A 2004e wine Bulgaria sugar added + wine D 2003O wine D 2004 ▲ wine Italy◇wine Moldova sugar added 口wine Moldova ×wine Spain Figure 6. (A) Comparison of the average 8H-values of ethanol from wine and fermented applejuice samples from different European countries with their positional NMR data (ppm). (D/H)r-values (CHs-group) lower curve, (D/H)u-values (-CH2-group) upper curve. Samples and NMRdata are by courtesy of Dr. N. Christoph, Bayerisches Landesamt fur Gesundheit und Lebens-mittelsicherheit, Wurzburg, Germany. As the average of the ppm-values (for correspondingcalculation see Schmidt et al.) would not imply the abundance of the hydrogen of the OH-group,it cannot be absolutely compared with the 8H-values. The latter are, however, a valuable originindicator. (B) Geographical origin clusters of ethanol from fermented apple juice and wine fromdifferent European countries by simultaneous 8H and 81c measurement with the CHnsanalyser. Table 5. Sensitivity (minimum element amount needed) and recommended sample sizes in routine multi-element isotope ratioanalysis. Values in parentheses are for HT pyrolytic analysis of hydrogen and for special sulfur isotope ratio analysis, respectively Parameters N C H S Minimum amount [ug] 100 100 200(50) 20(10) Recommended working amount [ug] 300-500 1500-8000 300-800(80-120) 30-100 Error range (8-units) 0.2 0.1 3.0 0.3 Minimum rel. ratio to C 0.05 0.1 0.005 CONCLUSIONS Multi-element isotope ratio mass spectrometry is the mostsuitable analytical method for the authenticity check andorigin assignment of food commodities and many otherorganic products, and for the investigation of food chain,nutrition and environmental questions. The combination of amultifunctional elemental analyser, supplemented with aunit for water reduction, and a suitable mass spectrometer,provided a potent device for the simultaneous elementalanalysis and isotope ratio determination of H, C, N and S. Acomplete determination of the elemental content and theisotope ratio of the four elements can be performed on asole sample within 20 min. The capacity of the elementalanalyser permits the combustion of organic samples up to100 mg, providing the possibility to analyse material withvery low elementall concentrations5cand extraordinaryelemental ratios. The sensitivity (minimum amounts needed) of the systemfor the isotope ratio measurement of C and N is identical tothat of any conventional system. Compared with the directhigh-temperature pyrolysis determination of 8 H-values, thesensitivity of the system is less by a factor of 4, and theminimum amount of sulfur needed for an isotope analysis isabout twice that reported for classical systems.2 Thecharacterisation and recommendations for the samples sizeneeded in the practical routine analysis with the multi-element isotope ratio analyser are given in Table 5. These results indicate that routine simultaneous isotoperatio analyses of a maximum of four elements will be possiblewith 10-15mg crude plant dry matter (very low sulfurcontent), 2-6 mg of a protein and 4-5mg organic acidsor carbohydrates. The amounts of sample needed for theanalysis of material with extreme element ratios will bechecked in the future. The values given in the tablesare means of three individual measurements. The standarddeviations for the measurements of 8H-values is <3.0%,for 8 C-values 0.1%o, for8N-values 0.2%o,and for 84S-values0.3%o; these are identical to those obtained with othersystems. A detailed discussion of the obtained results inregard to the origin assignment of the investigated samples isinappropriate in the present context but will be the topic ofspecial reports on the application of the system, not only forfood origin and authenticity determination, but also forinvestigations on questions in archaeology and forensicchemistry. Acknowledgement This investigation was supported by the Arbeitsgemeinschaftindustrieller Forschungsvereinigungen 'Otto von Guericke’e.V. (AiF) in the framework of the program 'PRO INNO I'of the German Bundesministerium fir Wirtschaft und Arbeit. ( REFERENCES ) 1. Rossmann A. Food Rev. Int. 2001;17: 347. ( 2. Camin F , Wietzerbin K, Blanch-Cortez A, Haberhauer G,Lees M , Versini G . J. Agric. Food Chem.2004; 52: 6592. ) 3. Schmidt H-L, Rossmann A, Stockigt D, Christoph N. Chem.Unserer Zeit. 2005; 39: 90. 4. Schmidt H-L, Werner RA, Rossmann A, MosandlA, SchreierP. In Flavorings, Production, Composition, Applications, Regu-lations ( 2nd edn), Ziegler E, Ziegler H (eds).Wiley-VCH:Weinheim,in press. 5. Hedges REM, Thompson JMA, Hull BD. Rapid Commun.Mass Spectrom. 2005;19: 3187. 6. Schwertl M,Auerswald K, Schaufele R, Schnyder H. Agricul.Ecosys. Environ. 2005; 109: 153. 7. Gannes LZ, Del Rio CM, Koch P. Comp. Biochem. Physiol.1998;119A: 725. 8. Petzke KJ, Boeing H, Metges CC. Rapid Commun. MassSpectrom. 2005; 19: 1392. 9. McCullagh JSO, Tripp JA, Hedges REM. Rapid Commun.Mass Spectrom. 2005; 19:3227. 10. Beyser J, Pitz K, Horn P, Holzl S, Rauch E. Kriminalistik 2003;57:443. 11. Farqhuar GD, Ehleringer JR, Hubick KT. Annu. Rev. PlantPhysiol. Plant Mol.Biol. 1989; 40: 503. 12. Rossmann A, Rummel S, Kupka H-J. Deutsche Molkereizeit-schrift (dmz) 2003; 21: 18. 13. Kupka H-J, Sieper H-P, Rossmann A. Proc. 2nd Int. Symp.Isotopomers (ISI 2003) Stresa, Italy, Guillou C, Ryder J (eds).European Committee Joint Research Centre: Ispra, Varese,Italy, 2004; 90. 14. Schmidt H-L. In Anwendung von Isotopen in der OrganischenChemie und Biochemie, Bd. II, Messung von radioaktiven undstabilen Isotopen, Simon H (ed). 1974;301. 15. Gehre M, Hoefling R, Kowski P. Isot. Environ. Health Stud.1996;32: 335. 16. Gehre M, Hoefling R, Kowski P,Strauch G. Anal. Chem. 1996;68:4414. 17. Gonzales J, Jamin E, Remaud G, Martin YL, Martin GG,Martin ML. J. Agric. Food Chem. 1998;46: 2200. 18. Jamin E, Martin F, Santamaria-Fernandez R, Lees M. J. Agric.Food Chem. 2005;53:5130. 19. Rossmann A, Rummel S, Kupka H-J. Proc. 2nd Int. Symp.Isotopomers (IS 2003), Stresa, Italy. Guillou C, Ryder J (eds).European Committee Joint Research Centre: Ispra, Varese,Italy, 2004; 123. 20. Pillonel L, Butikofer U, Rossmann A, Tabacchi R, Bosser JO.Mitteil. Lebensm. Hyg.2004; 95: 489. 21. Pillonel L, Badertscher R, Casey M, Meyer J, Rossmann A,Schlichtherle-Cerny H, Tabacchi R, Bosset JO. Int. Dairy J.2005;15:547. 22. Giesemann A, Jager H-J, Norman AL, Krouse HR, BrandWA. Anal. Chem. 1994; 66:2816. Copyright C John Wiley & Sons, Ltd. Rapid Commun. Mass Spectrom. opyright C John Wiley & Sons, Ltd.DOI: rcm The isotope ratio of each of the light elements preserves individual information on the origin and history of organic natural compounds. Therefore, a multi-element isotope ratio analysis is the most efficient means for the origin and authenticity assignment of food, and also for the solution of various problems in ecology, archaeology and criminology. Due to the extraordinary relative abundances of the elements hydrogen, carbon, nitrogen and sulfur in some biological material and to the need for individual sample preparations for H and S, their isotope ratio determination currently requires at least three independent procedures and approximately 1 h of work. We present here a system for the integrated elemental and isotope ratio analysis of all four elements in one sample within 20 min. The system consists of an elemental analyser coupled to an isotope ratio mass spectrometer with an inlet system for four reference gases (N2, CO2, H2 and SO2). The combustion gases are separated by reversible adsorption and determined by a thermoconductivity detector; H2O is reduced to H2. The analyser is able to combust samples with up to 100mg of organic material, sufficient to analyse samples with even unusual elemental ratios, in one run. A comparison of the isotope ratios of samples of water, fruit juices, cheese and ethanol from wine, analysed by the four-element analyser and by classical methods and systems, respectively, yielded excellent agreements. The sensitivity of the device for the isotope ratio measurement of C andNcorresponds to that of other systems. It is less by a factor of four forHand by a factor of two for S, and the error ranges are identical to those of other system
关闭-
1/7
-
2/7
还剩5页未读,是否继续阅读?
继续免费阅读全文产品配置单
艾力蒙塔贸易(上海)有限公司为您提供《稳定同位素样品中EA-IRMS的CHNS稳定同位素比分析检测方案(有机元素分析)》,该方案主要用于其他中理化分析检测,参考标准《暂无》,《稳定同位素样品中EA-IRMS的CHNS稳定同位素比分析检测方案(有机元素分析)》用到的仪器有 vario isotope cube 同位素元素分析仪。
我要纠错
相关方案
 咨询
咨询