方案详情文
智能文字提取功能测试中
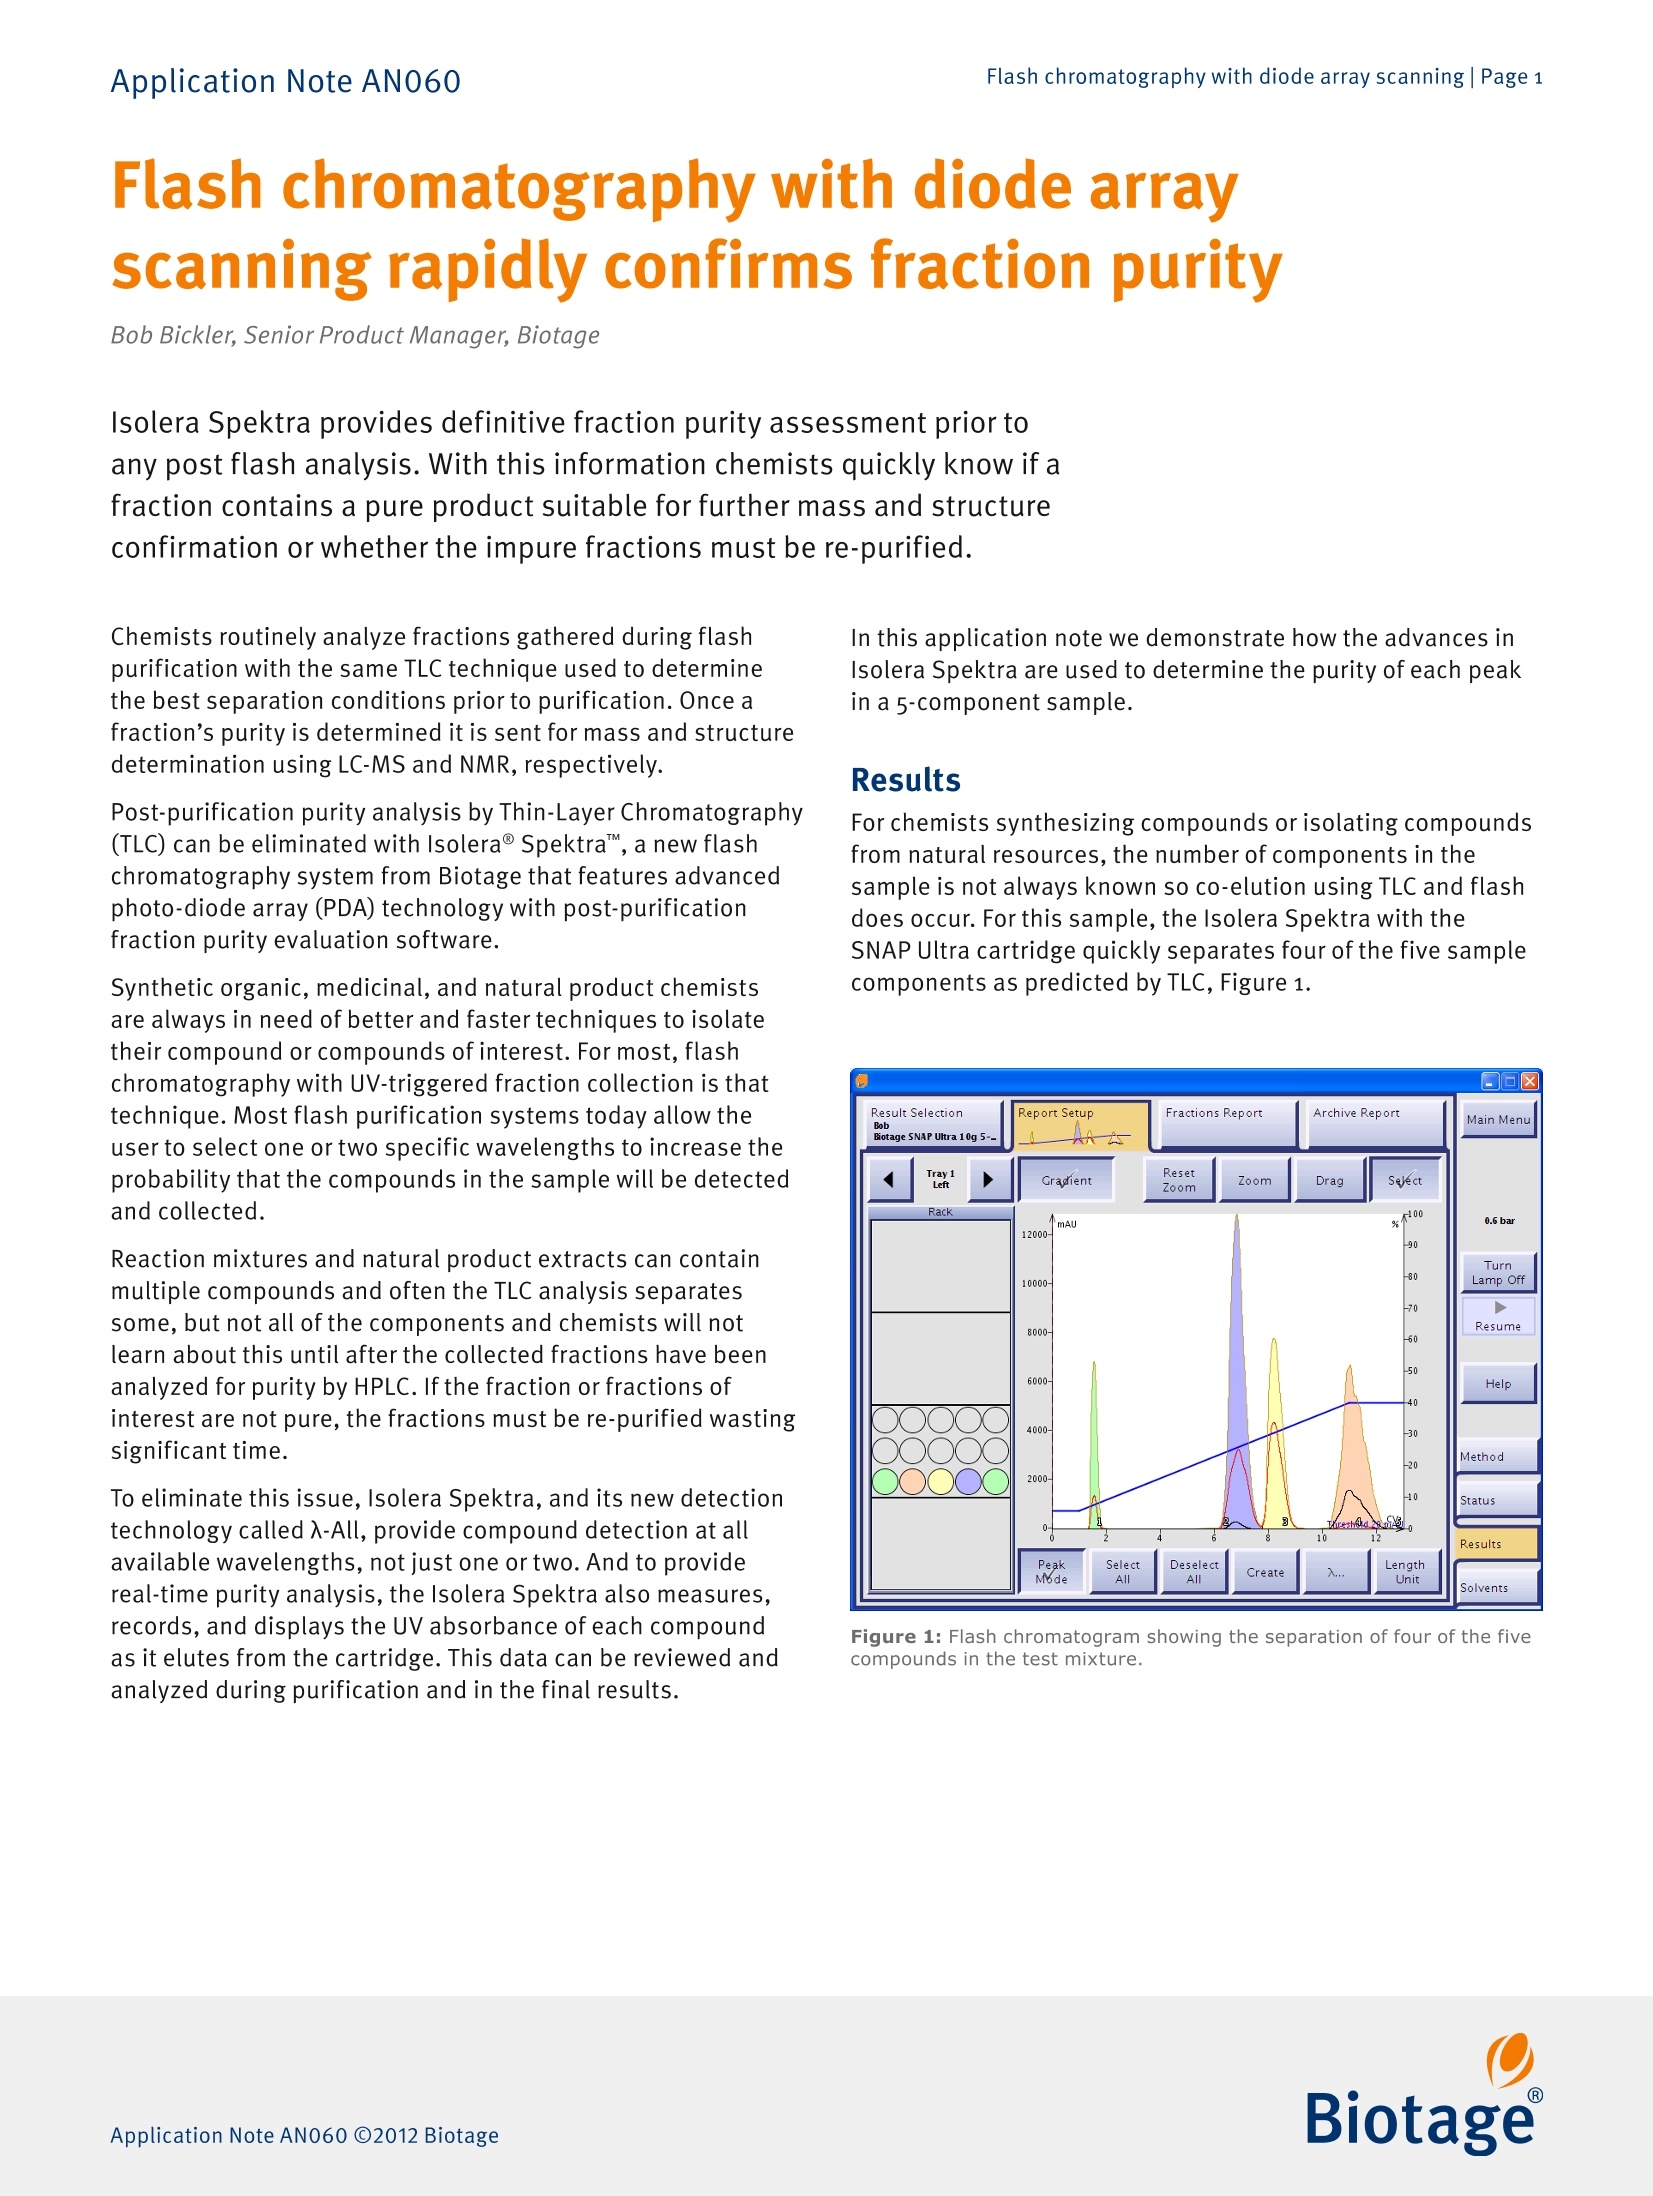
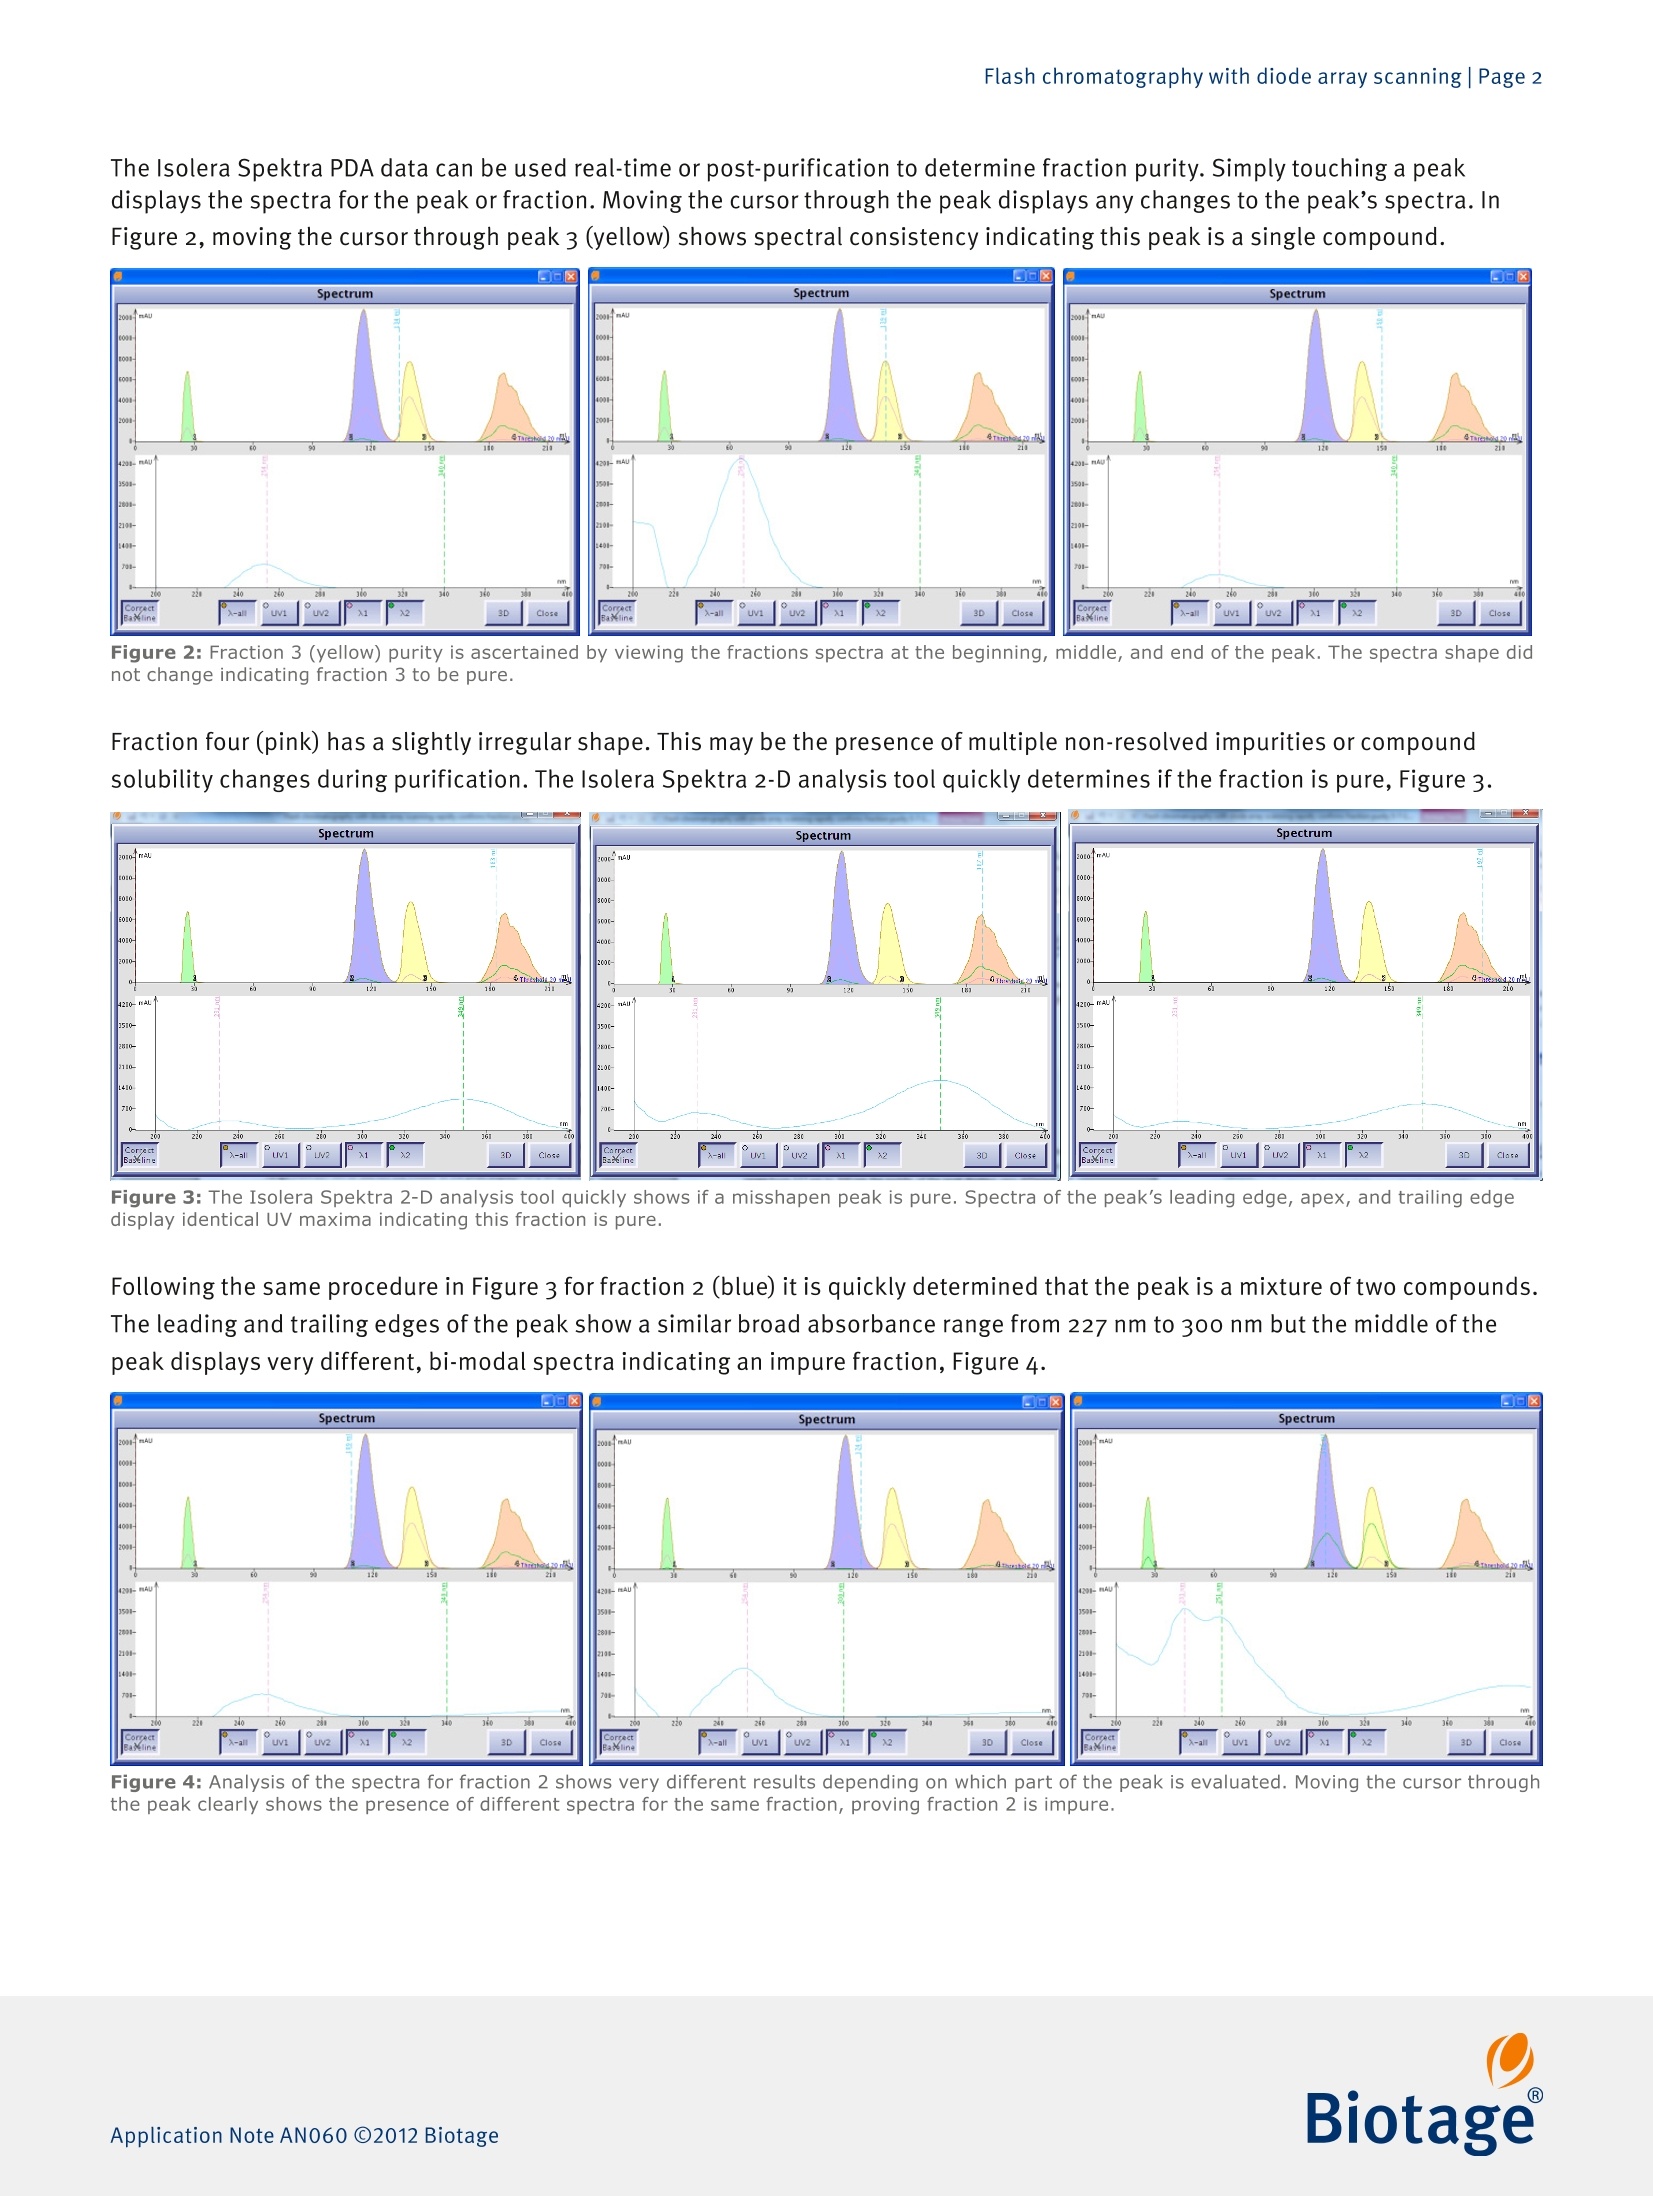
Flash chromatography with diode array scanning| Page 1Application Note AN060 Flash chromatography with diode arrayscanning rapidly confirms fraction purity Bob Bickler, Senior Product Manager, Biotage Isolera Spektra provides definitive fraction purity assessment prior toany post flash analysis. With this information chemists quickly know if afraction contains a pure product suitable for further mass and structureconfirmation or whether the impure fractions must be re-purified. Chemists routinely analyze fractions gathered during flashpurification with the same TLC technique used to determinethe best separation conditions prior to purification. Once afraction’s purity is determined it is sent for mass and structuredetermination using LC-MS and NMR, respectively. Post-purification purity analysis by Thin-Layer Chromatography(TLC) can be eliminated with Isolera@ Spektra , a new flashchromatography system from Biotage that features advancedphoto-diode array (PDA) technology with post-purificationfraction purity evaluation software. Synthetic organic, medicinal, and natural product chemistsare always in need of better and faster techniques to isolatetheir compound or compounds of interest. For most, flashchromatography with UV-triggered fraction collection is thattechnique. Most flash purification systems today allow theuser to select one or two specific wavelengths to increase theprobability that the compounds in the sample will be detectedand collected. Reaction mixtures and natural product extracts can containmultiple compounds and often the TLC analysis separatessome, but not all of the components and chemists will notlearn about this until after the collected fractions have beenanalyzed for purity by HPLC. If the fraction or fractions ofinterest are not pure, the fractions must be re-purified wastingsignificant time. To eliminate this issue, Isolera Spektra, and its new detectiontechnology called 入-All, provide compound detection at allavailable wavelengths, not just one or two. And to providereal-time purity analysis,the Isolera Spektra also measures,records, and displays the UV absorbance of each compoundas it elutes from the cartridge. This data can be reviewed andanalyzed during purification and in the final results. In this application note we demonstrate how the advances inIsolera Spektra are used to determine the purity of each peakin a 5-component sample. Results For chemists synthesizing compounds orisolating compoundsfrom natural resources, the number of components in thesample is not always known so co-elution using TLC and flashdoes occur. For this sample, the Isolera Spektra with theSNAP Ultra cartridge quickly separates four of the five samplecomponents as predicted by TLC, Figure 1. Figure 1: Flash chromatogram showing the separation of four of the fivecompounds in the test mixture. The Isolera Spektra PDA data can be used real-time or post-purification to determine fraction purity. Simply touching a peakdisplays the spectra for the peak or fraction. Moving the cursor through the peak displays any changes to the peak’s spectra.InFigure 2, moving the cursor through peak 3 (yellow) shows spectral consistency indicating this peak is a single compound. Figure 4: Analysis of the spectra for fraction 2 shows very different results depending on which part of the peak is evaluated. Moving the cursor throughthe peak clearly shows the presence of different spectra for the same fraction, proving fraction 2 is impure. When viewed in 3-D the blue fraction’s impurity is also notice-able as a slight shoulder on the right side of the peak (thegreen line at 251 nm) while the shape of the 3-D peak behindit at 233 nm (pink line) is symmetrical. These differences alsoindicate that the fraction is impure. Figure 5: A 3-D graphical analysis provides supporting evidence offraction purity or impurity. In the case of fraction 2, the peak shape at251 nm (green line) is clearly asymmetric while other wavelengths at thesame retention have symmetrical peaks. Conclusion Isolera Spektra provides definitive fraction purity assessmentin both 2-D and 3-D prior to any post flash analysis. With thisinformation chemists quickly know if a fraction contains a pureproduct suitable for further mass and structure confirmationor whether the impure fractions must be re-purified. Thisknowledge improves synthesis throughput and avoids anyembarrassment of submitting impure fractions for analyticalevaluation. Experimental details Components · Naphthalene e 2-Nitroaniline ·Butyl paraben ·Methyl paraben °4-Nitroaniline Sample preparation Dissolve each compound in acetone at a concentration ofo.1g/mL. Method development TLC at 20% Ethyl acetate in Hexane Compound Rf Naphthalene 0.84 2-Nitroaniline 0.32 Butyl paraben 0.32 Methyl paraben 0.24 4-Nitroaniline 0.11 Equipment used Flash system: Isolera Spektra Four equipped with a 200-400 nm UV detector Flash cartridge: Biotage@ SNAP Ultra 10 g Flow-rate: 12 mL/min Solvents: A: Hexanes B: Ethyl acetateEquilibration: 5% B at 50 mL/min for 3 CV (51 mL)Gradient: 5% B for 1 CV (17 mL) 5% to 40% B in 10 CV (170 mL) 40% B for 2 CV (34 mL) Detection: 入-All with baseline correction, 200-400 nmThreshold: 20 mAUTLC: Biotage KP-SIL NORTH AMERICAJAPANMain Office: +46 18 565900Main Office: +1 704 6544900Tel:+81 3 5627 3123Fax:+46 18 591922Toll Free: +1 800 4464752Fax: +81 3 5627 3121Order Tel: +46 18565710Fax: +1 704 6544917jp_order@biotage.comOrder Fax: +4618565705Order Tel: +17046544900order@biotage.comOrder Fax: +1 434 296 8217ordermailbox@biotage.com BiotageApplication Note ANOBiotage BiotageApplication Note ANOBiotage
关闭-
1/3
-
2/3
还剩1页未读,是否继续阅读?
继续免费阅读全文产品配置单
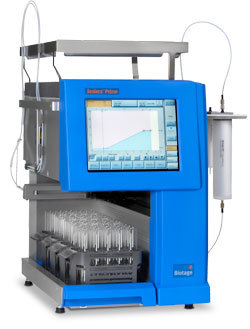
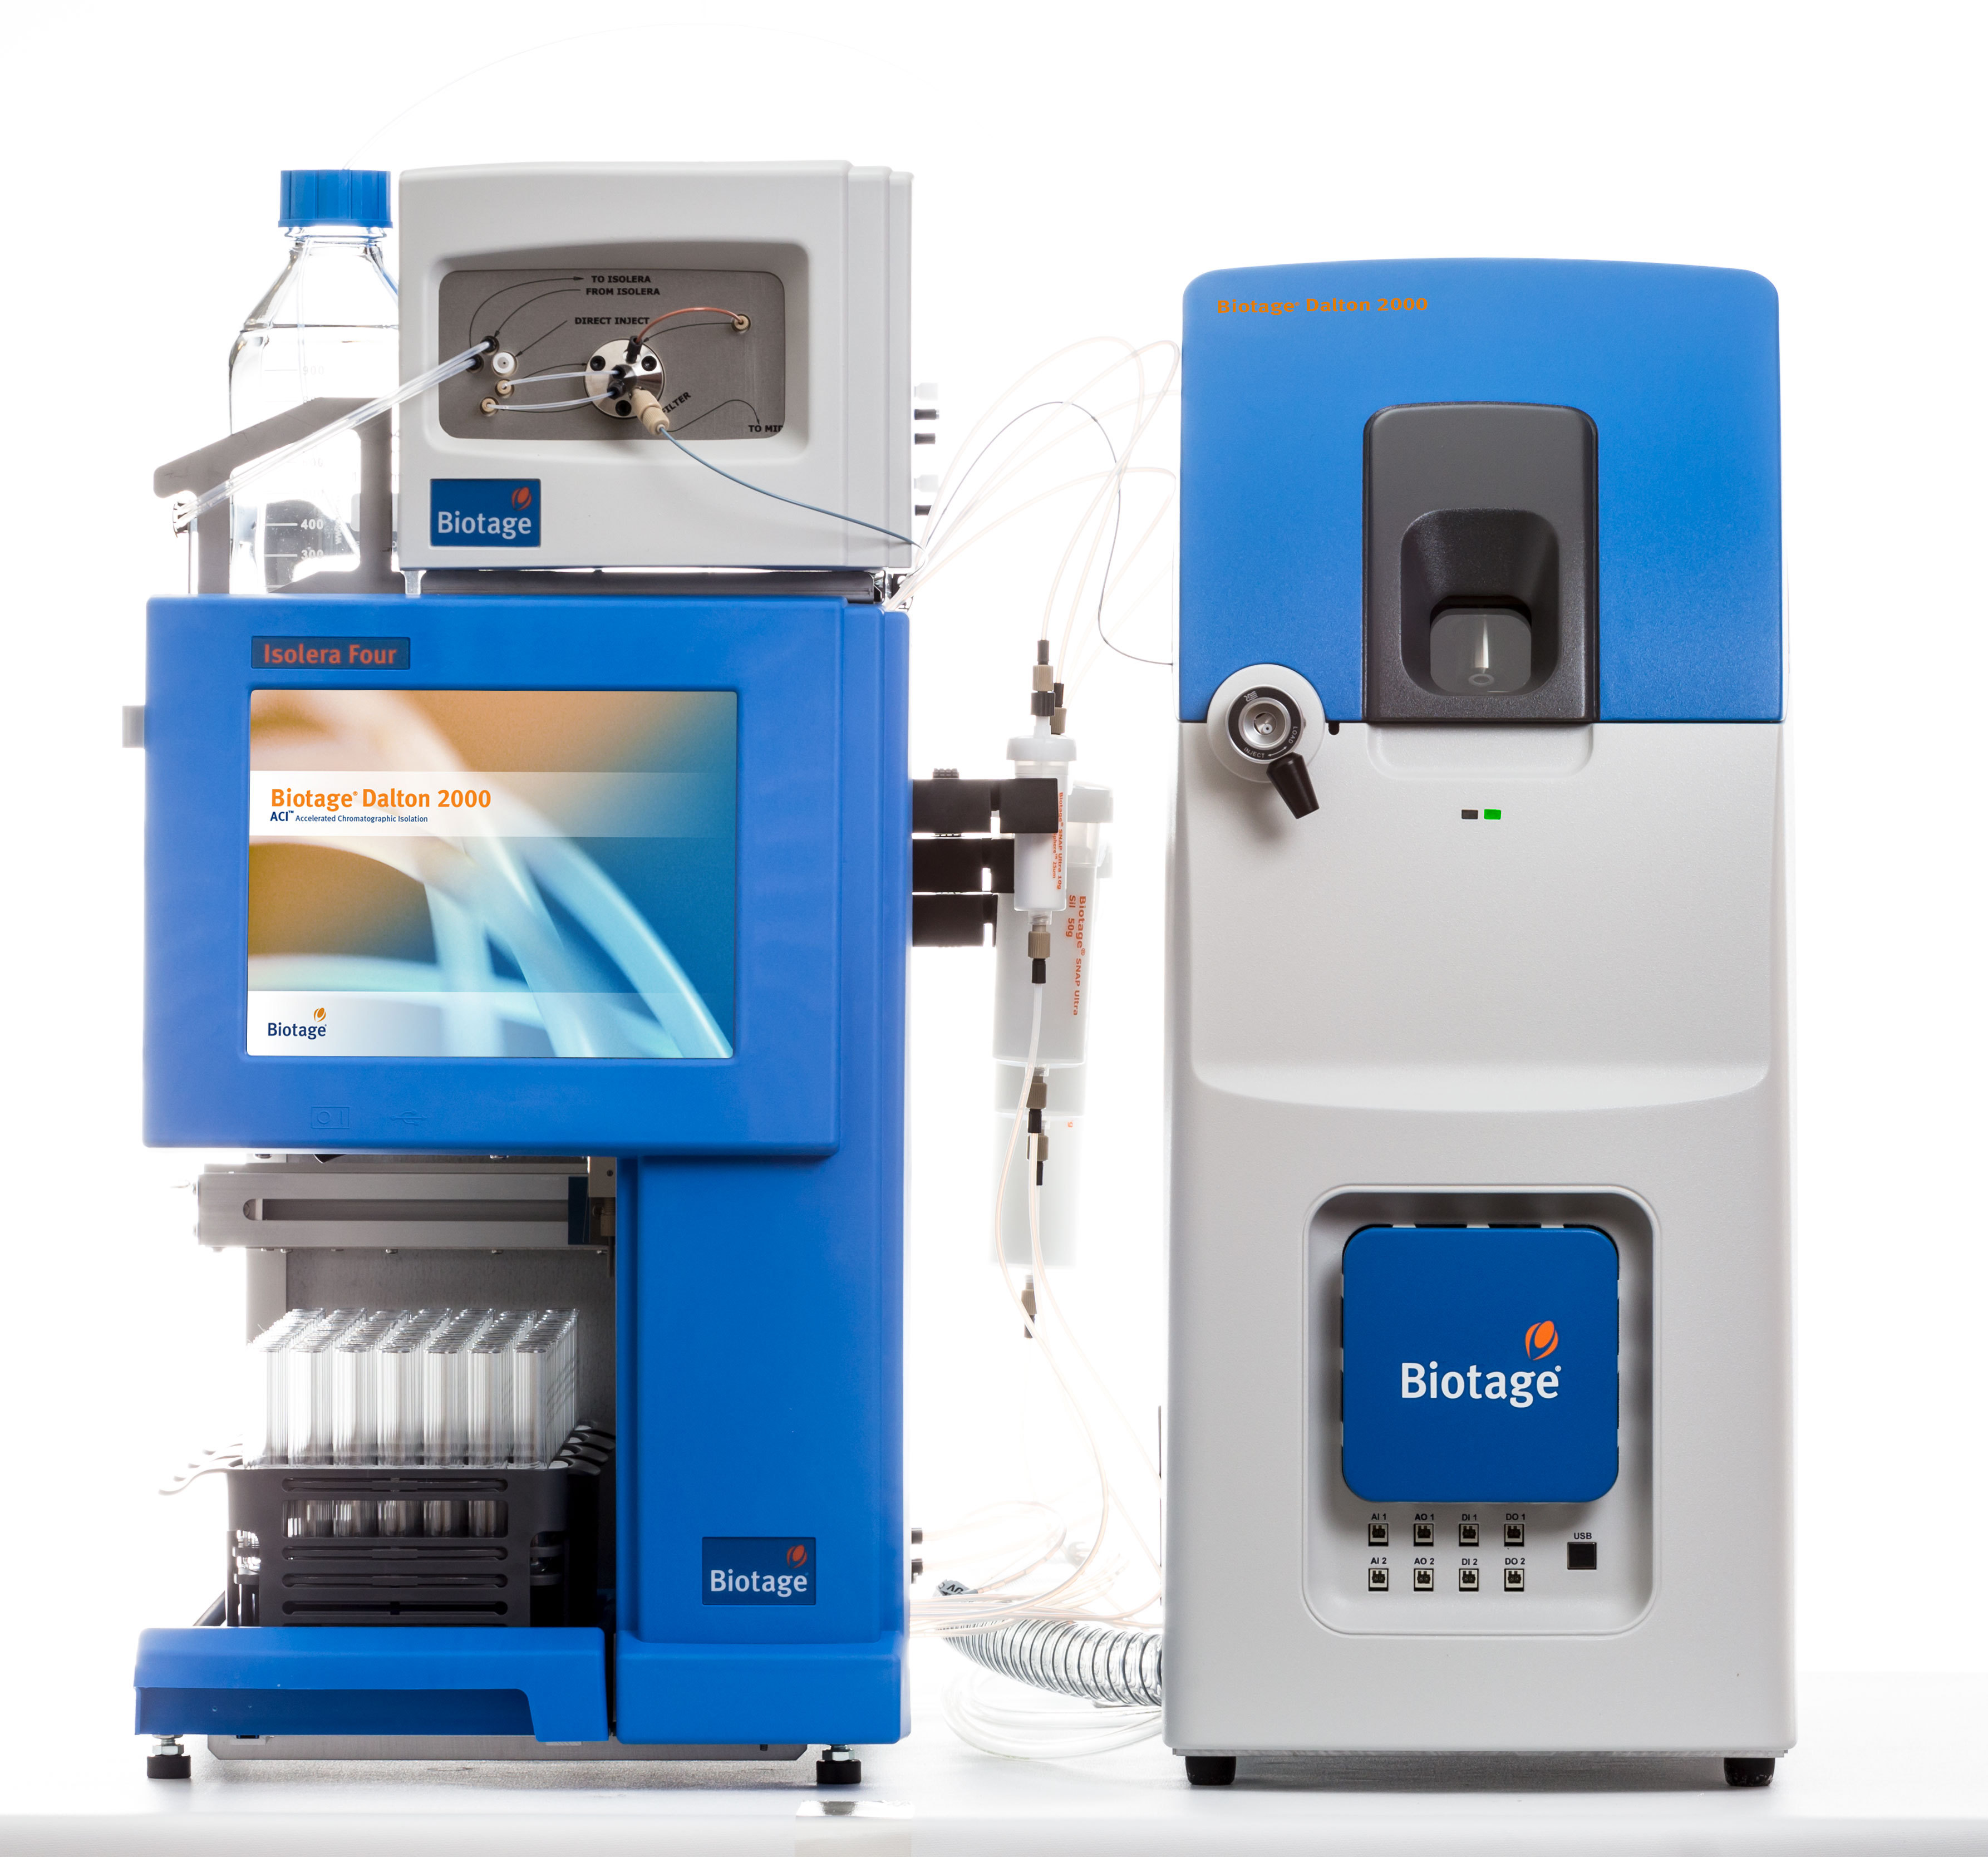
拜泰齐贸易(上海)有限公司为您提供《制备液相色谱中在线3D谱图检测方案 》,该方案主要用于其他中在线3D谱图检测,参考标准《暂无》,《制备液相色谱中在线3D谱图检测方案 》用到的仪器有Biotage Isolera Prime快速制备液相色谱、Biotage Isolera Dalton 2000制备液相、Biotage Isolera One 快速色谱仪。
我要纠错
相关方案


 咨询
咨询