

方案详情文
智能文字提取功能测试中
DEVELOPMENT OF FINE PARTICULATE EMISSION FACTORS ANDSPECIATION PROFILES FOR OIL-AND GAS-FIRED COMBUSTIONSYSTEMS FINAL REPORT When citing this document, please use the following citation: England, G.C., “Development of Fine Particulate Emission Factors and Speciation Profiles forOil and Gas-fired Combustion Systems, Final Report, 2004.” DEVELOPMENT OF FINE PARTICULATE EMISSION FACTORS ANDSPECIATION PROFILES FOR OIL-AND GAS-FIRED COMBUSTIONSYSTEMS FINAL REPORT Prepared by: Glenn C. England GE Energy and Environmental Research Corporation 18 Mason Irvine, CA 92618 Prepared for: National Petroleum Technology Office National Energy Technology Laboratory United States Department of Energy (DOE Contract No.DE-FC26-00BC15327) Gas Research Institute California Energy Commission-Public Interest Energy Research (PIER) New York State Energy Research and Development Authority (GRI contract No.8362) American Petroleum Institute(API Contract No. 00-0000-4303) Draft (Revision 0): July 22, 2004Final (Revision 1.0): October 20, 2004 LEGAL NOTICES United States Department of Energy: This report was prepared as an account of work sponsored by an agency of the United StatesGovernment. Neither the United States Government nor any agency thereof, nor any of theiremployees, makes any warranty, express or implied, or assumes any legal liability orresponsibility for the accuracy,completeness, or usefulness of any information, apparatus,product, or process disclosed, or represents that its use would not infringe privately owned rights.Reference herein to any specific commercial product, process, or service by trade name,trademark, manufacturer, or otherwise does not necessarily constitute or imply its endorsement,recommendation, or favoring by the United States Government or any agency thereof. The viewsand opinions of authors expressed herein do not necessarily state or reflect those of the UnitedStates Government or any agency thereof. Gas Research Institute: This report was prepared by GE Energy and Environmental Research Corporation (GE EER) asan account of contracted work sponsored by the Gas Research Institute (GRI). Neither GE EER,GRI, members of these companies, nor any person acting on their behalf: a. Makes any warranty or representation, expressed or implied, with respect to the accuracy,completeness, or usefulness of the information contained in this report, or that the use of anyapparatus, methods, or process disclosed in this report may not infringe upon privately ownedrights; or b. Assumes any liability with respect to the use of, or for damages resulting from the use of, anyinformation, apparatus, method, or process disclosed in this report. California Energy Commission: This report was prepared as a result of work sponsored by the California Energy Commission(Commission). It does not necessarily represent the views of the Commission, its employees, orthe State of California. The Commission, the State of California, its employees,contractors, andsubcontractors make no warranty, express or implied, and assume no legal liability for theinformation in this report; nor does any party represent that the use of this information will notinfringe upon privately owned rights. This report has not been approved or disapproved by theCommission nor has the Commission passed upon the accuracy or adequacy of the informationin this report. New York State Energy Research and Development Authority: This report was prepared by GE Energy and Environmental Research Corporation in the courseof performing work contracted for and sponsored by the New York State Energy Research andDevelopment Authority (NYSERDA). The opinions expressed in this report do not necessarilyreflect those ofNYSERDA or the State of New York, and reference to any specific product,service, process, or method does not constitute an implied or expressed recommendation orendorsement of it. Further, NYSERDA and the State ofNew York make no warranties orrepresentations, expressed or implied, as to the fitness for particular purpose or merchantabilityof any product, apparatus, or service, or the usefulness, completeness, or accuracy of anyprocesses, methods, or other information contained, described, disclosed,or referred to in this report. NYSERDA, the State of New York, and the contractor make no representation that theuse of any product, apparatus,process, method, or other information will not infringe privatelyowned rights and will assume no liability for any loss, injury, or damage resulting from, oroccurring in connection with, the use of information contained, described, disclosed, or referredto in this report. American Petroleum Institute (API): API publications necessarily address problems of a general nature. With respect to particularcircumstances, local state and federal laws and regulations should be reviewed. API is not undertaking to meet the duties of employers, manufacturers, or suppliers to warn andproperly train and equip their employees, and others exposed, concerning health and safety risksand precautions, nor undertaking their obligations under local, state, or federal laws. Nothingcontained in any API publication is to be construed as granting any right, by implication orotherwise, for the manufacture, sale, or use of any method, apparatus, or product covered byletters patent. Neither should anything contained in the publication be construed as insuringanyone against liability for infringement of letters patent. GE Energy This report was prepared by GE Energy & Environmental Research Corporation (as part of GEEnergy and GE, collectively hereinafter“GE Energy”) as an account of sponsored work. GEEnergy, nor any of their employees, makes any warranty, express or implied or otherwise, orassumes any legal liability or responsibility of the accuracy, completeness, or usefulness of anyinformation, apparatus, processes, systems, products, methodology or the like disclosed herein,or represents that its use would not infringe privately owned rights. Reference herein to anyspecific commercial product process or service by trade name, trademark, manufacturer, orotherwise does not necessarily constitute or imply an endorsement, recommendation, or favoringby GE Energy. The views and opinions of the authors expressed herein do not necessarily stateor reflect those of GE Energy. This report has not been approved or disapproved, endorsed orotherwise certified by GE Energy nor has GE Energy passed upon the accuracy or adequacy ofthe information in this report. This report presents field test results obtained on seven individual units measured at one or moreoperating conditions with different sources of emissions using an experimental dilutionmeasurement technique. The test results are not necessarily representative of the emissions fromthe source category, or the typical operation of the specific source tested, and should beinterpreted as preliminary measurements from the specific source at the measured operatingconditions. Also, the test results should be qualified by carefully considering the limited numberof tests, background levels and other data quality issues detailed in this report. Although the report includes preliminary emission factors generated from these test results, itmust be recognized that these emission factors were developed using the experimental dilutionmeasurement technique, not regulatory approved test methods. Emission factors developed withthe regulatory approved test methods may be substantially different for specific pollutants. Thus,GE Energy does not support or recommend the use of these emission factors for regulatorypurposes, permitting or commercial use. The data in this report may be useful for future refinement and validation of the experimental dilution method for specific applications so that itmay be applied in future tests to develop more robust emission factors. The dilution sampling and ambient air methods used in this test to characterize stack emissionswere previously applied on stationary combustion sources for research purposes. They are notcurrently approved by any regulatory agency for demonstrating compliance with existingregulatory limits or standards. Further tests are needed to properly validate these methods forstationary combustion sources, especially for extremely low pollutant concentrationscharacteristic of gas-fired sources. The emission factors developed from these tests are source-specific for the time and conditionsof this tests (see tables below); therefore, they do not necessarily represent emission factors fortypical operation of these specific sources or the general population of similar sources. Theemission factors are not representative of combustion turbines, combined cycle plants, ductburners or Diesel particle filters. These emission factors are considered for information only insupport of the dilution test method for measurement of fine particulate matter, and the testmethods described herein continue to be in the developmental phase. No conclusions may bedrawn from use of the dilution test method for pollutants other than fine particulate matter. SITE ALPHA OPERATING CONDITIONS(a) Run 1 Run 2 Run 3 Run 4 Heat input, % of capacity 85 90 87 91 NOx/CO Controls None None None None Values are based on average heat input values calculated over the 6-hour test run period. SITE BRAVO OPERATING CONDITIONS (a) Run 1 Run 2 Run 3 Run 4 GT (Load)(%) 100 100 93 85 Duct Burner ON ON PARTIAL(b) OFF SCR ON ON ON ON Oxidation Catalyst ON ON ON ON Power Augmentation Yes Yes Yes Yes Values are based on average heat input values calculated over the 6-hour test run period. Duct burner was firing during part (~30 min.) ofthe test run and shutoff during the remainder of the test run. SITE CHARLIE OPERATING CONDITIONS (a) Run 1 Run 2 Run 3 Run 4 Heat input, % of capacity 100 98 96 95 SCR ON ON ON ON Values are based on average heat input values calculated over the 6-hour test run period. SITE DELTA OPERATING CONDITIONS() Run G1 Run G2 Run G3 Run G4 Run O1 Run O2 Run O3 Run 04 Heat input, % of capacity 37 28 35 39 75 82 80 76 Fuel NG NG NG NG No.6Oil No.6 Oil No.6 Oil No.6 Oil NOx/CO Controls None None None None None None None None Values are based on average heat input values calculated over the 6-hour test run period. NG= natural gas SITE ECHO OPERATING CONDITIONS (a) Hi-Run 1 Hi-Run 2 Hi-Run 3 Hi-Run 4 Lo-Run 1 Lo Run 2 Lo-Run 3 GT (Load) (%) 100 98 100 100 59 59 59 Duct Burner OFF OFF OFF OFF OFF OFF OFF SCR ON ON ON ON ON ON ON Oxidation Catalyst ON ON ON ON ON ON ON (a)Values are based on average megawatt values calculated over the 6-hour test run period . SITE FOXTROT OPERATING CONDITIONS(a) 50-DPF-Run 1 50-DPF-Run 2 50-DPF-Run 3 75-DPF-Run1 75-DPF-Run 2 75-DPF-Run3 Engine Load,%of capacity 50 50 50 75 75 75 Fuel ULSDO ULSDO ULSDO ULSDO ULSDO ULSDO Diesel Particulate Filter Yes Yes Yes Yes Yes Yes Values are based on average heat input values calculated over the 6-hour test run period. LSDO=low sulfur Diesel oil; ULSDO=ultra-low sulfur Diesel oil. SITE GOLF OPERATING CONDITIONS (a) Run 1 Run 2 Run 3 GT (Load)(%) 99 99 99 Duct Burner ON ON ON SCR ON ON ON Oxidation Catalyst ON ON ON (a)Values are based on average megawatt values calculated over the 6-hour test run period. ACKNOWLEDGEMENTS The following people are recognized for their contributions of time and expertise during thisstudy and in the preparation of this report: GE ENERGY AND ENVIRONMENTAL RESEARCH CORPORATION PROJECT TEAM MEMBERS Glenn England, Project Manager Stephanie Wien, Project Engineer Dr. Oliver M.C. Chang, Project Engineer Prof.Judith Chow,Desert Research Institute Prof. John Watson, Desert Research Institute Prof. Barbara Zielinska, Desert Research Institute Prof. Lynn Hildemann, Stanford University Prof. Philip Hopke, Clarkson University Prof. Glen Cass, Georgia Institute of Technology AD HOC COMMITTEE MEMBERS Dr. Karl Loos, Shell Global Solutions Prof. James Schauer, University of Wisconsin-Madison Dr. Praveen Amar, NESCAUM Thomas Logan, U.S.EPA Ron Myers, U.S. EPA Karen Magliano, California Air Resources Board PROJECT SPONSORS Kathy Stirling, U.S. Department of Energy Marla Mueller, California Energy Commission Dr. Paul Drayton, Gas Research Institute Karin Ritter, American Petroleum Institute Barry Liebowitz, New York State Energy Research and Development Authority Janet Joseph, New York State Energy Research and Development Authority FOREWORD In 1997, the United States Environmental Protection Agency (EPA) promulgated new NationalAmbient Air Quality Standards (NAAQS) for particulate matter (PM), including for the first timeparticles with aerodynamic diameter smaller than 2.5 micrometers (um) referred to as PM2.5.PM2.5 in the atmosphere also contributes to reduced atmospheric visibility, which is the subjectof existing rules for siting emission sources near Class 1 areas and new Regional Haze rules.There are few existing data regarding emissions and characteristics of fine aerosols from oil, gasand power generation industry combustion sources, and the information that is available isgenerally outdated and/or incomplete. Traditional stationary source air emission samplingmethods tend to underestimate or overestimate the contribution of the source to ambient aerosolsbecause they do not properly account for primary aerosol formation, which occurs after the gasesleave the stack. These deficiencies in the current methods can have significant impacts onregulatory decision-making. The current program was jointly funded by the U.S. Department ofEnergy National Energy Technology Laboratory (DOE/NETL), California Energy Commission(CEC), Gas Research Institute (GRI), New York State Energy Research and DevelopmentAuthority (NYSERDA) and the American Petroleum Institute (API) to provide improvedmeasurement methods and reliable source emissions data for use in assessing the contribution of·1oil, gas and power generation industry combustion sources to ambient PM2.5 concentrations.More accurate and complete emissions data generated using the methods developed in thisprogram will enable more accurate source apportionment and source receptor analysis for PM2.5NAAQS implementation and streamline the environmental assessment of oil, gas and powerproduction facilities. The goals of this program were to: ● Develop improved dilution sampling technology and test methods for PM2.5 massemissions and speciation measurements, and compare results obtained with dilution andtraditional stationary source sampling methods. ●DDevelop emission factors and speciation profiles for emissions of fine particulate matter,especially organic aerosols, for use in source receptor and source apportionment analysis; ● Identify and characterize PM2.5 precursor compound emissions that can be used insource receptor and source apportionment analysis; and This report is part of a series of progress, topical and final reports presenting the findings of theprogram. TABLE OF CONTENTS LEGAL NOTICES..e... .....IV ACKNOWLEDGEMENTS. .VIIL FOREWORD...... ....IX LIST OF FIGURES ....XII LIST OF TABLES..... .XIV EXECUTIVE SUMMARY. FINDINGS.... 3 PM2.5 Emission Characteristics ... 3 Dilution Sampling Method Readiness . 4 RECOMMENDATIONS.. 5 1. INTRODUCTIONN. 8 Project Overview ..... Report Organization...... 2. DILUTION METHOD DEVELOPMENT. Background........ Overview of Stationary Source Dilution Sampling Systems... Mobile Source Dilution Systems ..... Recent Designs for Stationary Source Sampling ........ Methods and Procedures...... Design Assessment Experiments.... Compact Sampler Design ...... Dilution Sampler Size and Portability ... Instrumentation and controls..... Compact Sampler and Dilution Method Performance... Mixing Performance (Radial Profiles And Cold Flow Characterization).... Pilot Combustor Tests...... Field Comparison Tests ..... Measurement Background-PM2.5.... PM2.5 Method Detection Limit (MDL) and Lower Quantification Limit (LQL).. Measurement Background-PM2.5 Species and Precursors... Sample Collection and Analysis Issues ... Elemental and organic carbon..... Ultrafine particle characterization... Laser photometer. Dilution Method.. Effect of Dilution Conditions: Relative Humidity.. Effect of Dilution Conditions: Temperature.. .Effect of Dilution Conditions: Dilution Ratio ...... Accuracy and Precision of PM2.5 Measurements.l.. Testing Cost....... Equipment Costs.. Overall Test Costs..... 333的的的 3. PM2.5 EMISSION FACTORS AND SPECIATION PROFILES PM2.5 Emission Factor Development......... Treatment of Results Below Detection Limits..... Uncertainty and Representativeness .. Emission Factor Quality ...... Data Sources and Categories ..... PM2.5 Emission Factors ... Gas-Fired Boilers ...... .Gas-Fired Process Heaters ... Oil-Fired Boilers..... Gas-Fired Internal Combustion Combined Cycle and Cogeneration Plants Diesel Engine... PM2.5 Precursor Emission Factors... Gas-Fired Boiler PM2.5 Precursors... Gas-Fired Process Heater PM2.5 Precursors .. Combined Cycle/Cogeneration Unit PM2.5 Precursors .... .Oil-Fired Boiler PM2.5 Precursors.. PM2.5 Speciation Profiles ....... 乃乃 888Gas-Fired Boiler PM2.5 Speciation Profile.. Gas-Fired Heater Speciation Profile ...... .....91 Gas-Fired Internal Combustion Combined Cycle/Cogeneration Plant Speciation Profile91 .Oil-Fired Boiler Speciation Profile...... ..94 Diesel Engine Speciation Profile.... 4. FINDINGS AND RECOMMENDATIONS. PM2.5 Emission Characteristics ..... ..S Dilution Method Readiness.... ...100 Equipment.........100 . Procedures and Methodology ... ...102 Data Quality ....... ..102 Recommendations for Future Work.... ...103 Dilution Method Improvements and Validation:….. ...103 Emission Factors and Speciation Profiles..... ...104 REFERENCES ..... 105 APPENDIX A LIST OF ABBREVIATIONS.l.. 113 APPENDIXB SI CONVERSION FACTORS.... 116 LIST OF FIGURES Figure 1-1. Project approach....... .......10 Figure0 2.-1.. Typical Constant Volume Dilution Sampler for Mobile Source Testing (U.S. EPA,1994)....... .......15 Figure2-2. Effect ofDilution Sampler Residence Time on Particulate Number Concentrationand Size for a Diesel Engine (Kittelson, 1998)...... Figure 2-3. CalTech Dilution Sampler (Hildemann et al., 1989).)· w Figure 2-4. Dilution Sampler Particle Losses (from Hildemann et al., 1989). Figure 2-5. DRI Dilution Sampler (Chow et al, 2004). Figure 2-6. U.S. EPA Dilution Sampler (Dayton and Bursey, 2001). Figure 2-7. CANMET Dilution Sampler Version 3 (Lee et al., 2003). Figure 2-8. PAPRICAN Dilution Sampler (O'Connor, 2003).. B 22 22 Figure 2-9. Compact Dilution Sampler.......2 Figure 2-10. Size Comparison of Method 5 Train (left) and Compact Dilution Sampler (right).32 Figure 2-11. PM2.5 Mass for Compact and DRI Dilution Samplers for No. 6 Fuel OilCombustion in Pilot-Scale Furnace (Chang and England, 2004b)....... .......34 Figure 2-12. Comparison of DRI and Compact Dilution Sampler PM2.5 Results for a DieselEngine with Diesel Particulate Filter (Hernandez et al.,2004)...... .......36 Figure 2-13. Comparison of DRI and Compact Dilution Sampler PM2.5 Results for a NaturalGas-Fired Combined Cycle Power Plant with Oxidation Catalyst and SCR (England et al.,2004)..... Figure 2-14. Stack PM2.5 and Ambient PM2.5 (Site Echo, England et al., 2004). .. Figure 2-15. Stack PM2.5 and Estimated Dilution Air Background (Site Echo, England et al.,2004)........ .....38 Figure 2-16. Corrected Stack PM2.5 and Ambient PM2.5 (Site Echo, England et al., 2004)..... 39 Figure 2-17. Comparison of Stack, Ambient and Dilution Air PM2.5 (Site Charlie, Wien et al.,2004b)....... .........39 Figure 2-18. Comparison of In-Stack LQL as a Function of Sampling Run Time for Several PMTest Methods........ .......42 Figure 2-19. Comparison of Stack and Pre-Test Dilution System Blank Results for PM2.5Species (Compact Sampler, Site Echo)........ 45 Figure 2-20. Comparison of Stack and Pre-Test Dilution System Blank Results for PM2.5Species (DRI Sampler, Site Echo)....... 45 Figure 2-21. Comparison of Stack and Pre-Test Dilution System Blank Results for PM2.5Semivolatile Organic Species (DRI Sampler, Site Echo)... 46 Figure 2-22. Comparison of Stack and Pre-Test Dilution System Blank Results for OrganicPM2.5 Precursors (DRI Sampler, Site Echo).. .47 Figure 2-23. Comparison of Stack and Pre-Test Dilution System Blank Results for Other VOCs(DRI Sampler, Site Echo)........ .......48 Figure 2-24. Pre-Test and Post-Test Dilution Air Background Concentrations for PM2.5 mass,inorganics, EC and OC (Sites Charlie and Echo)........ .......50 Figure 2-26. Measured PM2.5 concentration versus Relative Humidity of Diluted Sample (All.Gas Fired Sites)........ .....57 Figure 2-27. PM2.5 versus Dilution Air Relative Humidity (All Gas-Fired Sites).).....m 58 Figure 2-28. PM2.5 versus Dilution Air Temperature (All Gas-Fired Sites)....... 58 Figure 2-29. PM2.5 versus Sample Temperature (All Gas-Fired Sites)......... ..... 59 Figure 2-30. PM2.5 versus Dilution Ratio (All Gas-Fired Sites, DRI and Compact Samplers). 60 Figure 2-31. Paired Sample t-Test results for DRI and Compact Sampler PM2.5 Mass Results at Site Foxtrot (With Null Hypothesis, Ho, and 95% t-Confidence Interval for the Mean). ....62 Figure 2-32. Dilution Sampling PM2.5 Precision for Gas-Fired Sources... ..... 64 Figure 2-33. Dilution Sampling Precision for Oil-Fired Sources..... Figure 3-1. Normal Probability Chart fo3?r Gas-Fired Boiler PM2.5 Mass Results.... Figure 3-2. Normal Probability Chart for Gas-Fired Process Heater PM2.5 Mass Results........ Figure 3-3. Normal Probability Chart for No.6 Oil-Fired Institutional Boiler PM2.5 MassResults.. ..78 Figure 3-4. Normal Probability Chart for Gas-Fired Combined Cycle and Cogeneration PowerPlant PM2.5 Mass Results... 8 Figure 3-5. Correlation of SO2 with Fuel Sulfur for Gas-Fired Boilers.. LIST OF TABLES Table 1-1. Source Types Tested During Program. .. Table 2-1. Features of Recent Dilution Sampler Designs... Table 2-2. Design Specification Comparison for DRI and Compact Dilution Samplers......... Table 2-3. OC and Backup Filter OC Results for Site Echo (mg/dscm)....... Table 2-4. Comparison of ISO 8178, DRI and Compact Dilution Sampler PM Results for aDiesel Engine (Site Foxtrot)......... 。......( Table 2-5. Estimated Dilution Sampler First-Unit Equipment Cost........ Table 2-6. Estimated Dilution Sampling Test Program Cost (2-Hour Test Runs).... Table 3-1. PM2.5 Mass Emission Factors for Gas-Fired Boilers and Steam Generators....... .Table 3-2. PM2.5 Mass Emission Factor for Gas-Fired Process Heaters...... Table 3-3. PM2.5 Mass Emission Factors for No.6 Oil-Fired Institutional Boiler. ... Table 3-4. PM2.5 Mass Emission Factors for Gas-Fired Combined Cycle and CogenerationPower Plants.... ..( Table 3-5. PM2.5 Emission Factors for a Diesel Engine.. Table 3-6. PM2.5 Precursor Emission Factors for Gas-Fired Boilers.. Table 3-7. PM2.5 Precursor Emission Factors for Gas-Fired Process Heaters (without NOx.Controls)... 86 Table 3-8. PM2.5 Precursor Emission Factors for Gas-Fired Process Heaters (with NOx.Controls).…..... .......86 Table 3-9. PM2.5 Precursor Emission Factors for Gas-Fired Internal Combustion Combined.Cycle/Cogeneration Plants (with NOx and CO Controls)....... ..( Table 3-10. PM2.5 Precursor Emission Factors for No. 6 Oil-Fired Boiler....... Table 3-11. PM2.5 Speciation Profile for Gas-Fired Boilers...... Table 3-12. PM2.5 Speciation Profile for Gas-Fired Process Heaters.... Table 3-13. PM2.5 Speciation Profile for Gas-Fired Internal Combustion CombinedCycle/Cogeneration Plants with Air Pollution Control Equipment...... Table 3-14. PM2.5 Speciation Profile for No. 6 Oil-Fired Institutional Boiler...... Table 3-15. PM2.5 Speciation Profile for Diesel Engine...... EXECUTIVE SUMMARY In 1997, the United States Environmental Protection Agency (EPA) promulgated new NationalAmbient Air Quality Standards (NAAQS) for particulate matter, including for the first timeparticles with aerodynamic diameter smaller than 2.5 micrometers (um) referred to as PM2.5.PM2.5 in the atmosphere also contributes to reduced atmospheric visibility, which is the subjectof existing rules for siting emission sources near Class 1 areas and new Regional Haze rules.There are few existing data regarding emissions and characteristics of fine aerosols from oil, gasand power generation industry combustion sources, and the information that is available isgenerally outdated and incomplete. Traditional stationary source air emission sampling methodstend to underestimate or overestimate the contribution of the source to ambient aerosols becausethey do not properly account for primary aerosol formation, which occurs after the gases leavethe stack. Primary aerosol includes both filterable particles that are solid or liquid aerosols atstack temperature plus those that form as the stack gases cool through mixing and dilutionprocesses in the plume downwind ofthe source. These deficiencies in the current methods canhave significant impacts on regulatory decision-making. PM2.5 measurement issues wereextensively reviewed by the American Petroleum Institute (API) (England et al., 1998), and itwas concluded that dilution sampling techniques are more appropriate for obtaining arepresentative particulate matter sample from combustion systems for determining PM2.5emission rate and chemical speciation. Dilution sampling is intended to collect aerosolsincluding those that condense and/or react to form solid or liquid aerosols as the exhaust plumemixes and cools to near-ambient temperature immediately after the stack discharge. Thesetechniques have been widely used in recent research studies. For example, Hildemann et al.(1994) and McDonald et al. (1998) used filtered ambient air to dilute the stack gas samplefollowed by 80-90 seconds residence time to allow aerosol formation and growth to stabilizeprior to sample collection and analysis. More accurate and complete emissions data generatedusing the methods developed in this program will enable more accurate source-receptor andsource apportionment analysis for PM2.5 National Ambient Air Quality Standards (NAAQS)implementation and streamline the environmental assessment of oil, gas and power productionfacilities. The overall goals of this program were to: Develop improved dilution sampling technology and test methods for PM2.5 massemissions and speciation measurements, and compare results obtained with dilution andtraditional stationary source sampling methods. ● Develop emission factors and speciation profiles for emissions of fine particulate matter,especially organic aerosols, for use in source-receptor and source apportionmentanalyses. ● Identify and characterize PM2.5 precursor compound emissions that can be used insource-receptor and source apportionment analyses. This report is the last of a series of progress, topical and final reports presenting the findings ofthe research program. The research program includes field tests at several different types of gas-and oil-fired combustion sources, pilot-scale tests to help develop an improved measurementtechnology and methods, and technology transfer activities designed to disseminate results andincorporate scientific peer review into project plans and results. The reports present results andidentify issues, procedures, methods and results that can be useful for future studies. The scope of the project included two main tracks: Method Development. Large size and weight restrictions previously precludedapplication of an existing benchmark dilution sampler design to most stationary sources.Pilot-scale combustion tests were conducted to evaluate the effects of dilution samplingparameters (dilution ratio, residence time) for a variety of stack gas conditions producedby gas, oil, coal and doped gas combustion. The results were used to develop new designspecifications for a more compact, lightweight dilution sampler. A new compact dilutionsampler was constructed and a measurement protocol suitable for use on stationarysources was developed to characterize the emission rates, chemical speciation and size ofprimary particles and secondary particle precursors. Preliminary validation testscomparing results from the compact dilution sampler and the ex似isting benchmark designwere performed in the field on a Diesel engine and a gas-fired power plant. ● Source Characterization Tests. Dilution sampling measurement methods were applied toseven stationary sources to characterize emission rates and chemical speciation profilesfor PM2.5 and gaseous precursors. PM2.5 (and precursor) emission factors and chemicalspeciation profiles were derived from the test results for gas-fired boilers and steamgenerators, gas-fired combined cycle and cogeneration power plants, gas-fired processheaters,No. 6 oil-fired boilers, and Diesel engines. FINDINGS PM2.5 Emission Characteristics PM2.5 Mass. For gas-fired sources, dilution sampling indicates PM2.5 mass emissionsare extremely low --probably near ambient air PM2.5 concentrations in many cases.Such levels are difficult to quantify with high confidence using any of the test methodsapplied in this program - far below both the estimated minimum detection limit (MDL)and lower quantification limit (LQL) of traditional hot filter/iced impinger methods, andgenerally between the estimated MDL and LQL of the dilution sampling method.Traditional methods for measuring filterable and condensable particulate matterpreviously have been shown to be subject to small systematic and random biases (due tosampling artifacts and biases) that are very significant at the extremely low particulateconcentrations typical of gas-fired sources. The in-stack PM2.5 MDL and LQL achievedwith dilution sampling are far lower than can be achieved by traditional hot filter/icedimpinger methods due to the avoidance of such biases and greater analytical sensitivity.Therefore, the PM2.5 concentration in stack gases from gas-fired sources measured usingdilution sampling is far lower than that measured by traditional methods. While a degreeof systematic and random bias in the dilution sampling measurements remains (primarilydue to background PM2.5 in the dilution air), these results for gas-fired sources areconsidered more representative of actual emissions. PM2.5 mass emissions from No. 6oil-fired sources and Diesel engines are well above the MDL and LQL of the dilutionsampling method. Further work on the dilution sampling method is needed, especiallyfor gas-fired source applications, as further discussed below. ● PM2.5 Speciation. The reconstructed PM2.5 mass (sum of species adjusted for elementoxides and organic carbon speciation) for gas-fired sources was typically greater than themeasured PM2.5 mass by 25 to as much as 200 percent or more in some cases. For theoil-fired boiler and the Diesel engine, the reconstructed and measured PM2.5 mass are ingood agreement (within approximately 10 percent). This implies a significant degree ofpositive bias in the PM2.5 species measurements for the gas-fired sources. For gas-firedsources, dilution sampling results indicate that the majority of PM2.5 is organic carbon(as defined by the thermal-optical reflectance analytical method using the IMPROVEprotocol). However, quality assurance measurements indicate it is likely that the organiccarbon fraction is overestimated due to adsorption of volatile organic compounds on thesample and quartz filters. This probably explains the imbalance between actual andreconstructed mass. Because of this imbalance, the speciation profiles are normalized tothe reconstructed mass rather than the measured mass. Measured semivolatile organic species typically accounted for much less than 5 percentof the organic carbon mass. This indicates the likelihood of either a positive bias in theorganic carbon measurement and/or the presence of other organic compounds such asfuel fragments and combustion intermediates that were not quantified. In this testprogram, the semivolatile organic compound analysis method was optimized forquantification of polycyclic aromatic hydrocarbons (PAH) commensurate with the test objectives. The results strongly suggest that most of the organic carbon mass isaccounted for by species other than PAH. A modified analytical approach isrecommended in future tests if the objective is to fully speciate the organic carbon mass. The PM2.5 speciation profiles for gas-fired sources are not distinctive for sourceapportionment purposes due to the predominance of organic carbon and high uncertaintyresulting from the extremely low concentrations of individual species. Sulfate, elementalcarbon, ammonium and other ions and elements are minor components for gas-firedsources. Sulfate is the dominant PM2.5 species for the oil-fired boiler, while elementalcarbon dominates for the Diesel engine. The speciation profile for the oil-fired boileralso showed elements consistent with the ash content of the fuel that may provide adistinctive signature. ● Particle Size. The test results for gas-fired units indicate that substantially all of theparticulate matter in the stack was smaller than 2.5 micrometers. In-stack cyclones with10 and 2.5 um cutpoints were used in most tests; however, the results are generally belowthe MDL of the acetone rinse procedure used to recover particulate matter collected in thecyclones. Recovery of the internal PM2.5 cyclone in the dilution sampler also did notreveal any detectable deposits of larger particles. Exploratory ultrafine (0.1 um andsmaller) particle measurements revealed that peak number concentrations occurred at asize of approximately 20 nm, indicating the predominance of particles formed bynucleation, and that ultrafine particles accounted for approximately one-third of the totalPM2.5 mass, assuming unit density (1 g/cc) for ultrafine particles. Particle size and composition measurements for the No. 6 oil-fired boiler test showed thatapproximately 76 percent of the particle mass is represented by particles smaller than0.32 um and that the majority of these are sulfate related. This is reasonable consideringthe elevated sulfur content of the fuel compared to the other sources tested in thisprogram. Diesel engine test results with and without a Diesel particulate filter show ultrafineparticle number concentration peaks at 60 to 80 nm and that both total and ultrafineparticles were significantly reduced by the Diesel particulate filter. Although somestudies by others have suggested that addition of a Diesel particulate filter may increasethe number of ultrafine particles in Diesel engine exhaust, this was not observed in thesetests. The long residence times characteristic of the dilution samplers used in this studymay account for at least part this difference, since the lifetime of ultrafine particles isgenerally short due to rapid accumulation. Dilution Sampling Method Readiness Systematic and Random Variation (Accuracy and Precision). Tests comparing thecompact dilution sampler to an existing benchmark dilution sampler showed that the twosamplers yield results that are the same at the 95 percent confidence level. However, further testing is needed to better quantify systematic and random variation, especially forapplications with extremely low (less than approximately 1 to 2 mg/dscm) particulateconcentrations. Measurement background levels in the dilution air were found to besignificant in some tests relative to stack concentrations for gas-fired sources, indicatingthe potential for further improvements in the equipment and/or procedures to reducesystematic variation for this application. ● Physical Size and Weight. For determining PM2.5 mass, elements, ions, organic carbonand elemental carbon, the prototype compact sampler and ancillary equipment are in totalapproximately the same physical size and weight as traditional particulate samplingequipment. Adding speciation modules and instrumentation increases the overall sizeand weight, but to a lesser extent than the equivalent equipment that would be required toobtain a similar scope of speciation using traditional methods. Operation. For this program, the sampler was instrumented and equipped with an off-the-shelf computer data acquisition system. Adjustments to the system were mademanually. With further engineering of the instrumentation, software and controls, itshould be feasible to simplify operation such that it can be operated by a qualified sourcetest individual. Sample Recovery. The loading and recovery of sample filter media using ambient airsampling equipment is significantly less complex than traditional hot filter/iced impingermethod equipment, with much less potential for contamination and sample loss in thefield. The compact sampler design makes it much easier to clean and recover samplesfrom the interior surfaces compared to the benchmark dilution sampler. However, theacetone rinse procedure used to recover deposits from the probe and sample venturi(adopted from EPA Method 5) lacks sufficient sensitivity for applications with extremelylow particulate concentration. Other studies imply that PM2.5 deposits in the probe andsample venturi are negligible, therefore the acetone rinse results were ignored for tests ofgas-fired sources. RECOMMENDATIONS Dilution Air Improvements. Purified ambient air currently is used for dilution. Thecurrent system utilizes high efficiency particulate arrest (HEPA) and activated carbonfilters to remove particles and organic compounds from the ambient air. Nevertheless,background levels of particles and organic compounds in the dilution air frequentlyproved to be significant for tests of gas-fired sources. Means to reduce background levelsin the dilution air should be investigated for gas-fired sources. The removal efficiencyand cost-effectiveness of other technologies such as ultra-low penetrating air (ULPA)filters, electrostatic precipitation, condensing heat exchangers, and other technologiesshould be explored to reduce breakthrough of fine and ultrafine particles. Alternatively,pure compressed gases instead of purified ambient air may be necessary for someapplications. If reduction of background levels is not feasible, procedures to correct for the background levels should be implemented. For example, dilution system blankscould be collected for every test run, using either integrated or instrumental methods, andthe results used to correct the stack sample results. ● Probe Recovery Procedures. The acetone rinse and analysis procedure, used to recoverand quantify deposits from the sample probe and venturi, needs to be improved orreplaced with an alternative procedure to achieve lower background levels for applicationto gas-fired sources. In addition, probe designs (e.g., adding dilution air at the probeentrance through a section of porous or perforated tube wall) that reduce deposits tonegligible levels, thereby eliminating the need to recover deposits from the probe, shouldbe explored. ● Validation for Source Types. The method and equipment should be rigorously validatedfor measuring PM2.5 mass on different source types, e.g., using EPA Method 301procedures as a guide. Specifically, a significant number of paired dilution sampler testsare needed to distinguish measurement and process variation for rigorous determinationof measurement precision. Generation of reference aerosols with known concentrationalso is recommended, with quantitative recovery of deposits from the various sections ofthe sampler, over a range of concentrations also is recommended. ● Validation for Species. Validated ambient air speciation methods were applied to thedilution sampler. Validation literature should be reviewed to determine whether furthervalidation tests are needed to extend the results to sample matrices and concentrations inthe diluted source samples. Further evaluation of organic carbon measurements isstrongly recommended for low concentration sources i.e. gas combustion. More detailedorganic carbon fractions should be reviewed from the current test program to determine ifa different analytical protocol is justified. ● PM2.5 Emission Factors and Speciation Profiles. The current population of data for eachsource category is small, but is considered a good start toward developing robustemission factors and speciation profiles. Because of the small number of units tested(one to three), the emission factors may not be representative of either any individual unitor the entire population of units in each category (although this is frequently a limitationof many published emission factors). The high statistical uncertainty (typically in therange of approximately 40 to more than 100 percent) associated with many of theemission factors highlights the need for more tests to better understand and reducesources of variability. Because it is likely that the emission factors for gas-fired unitsderived from these tests include a degree of positive bias due to measurement backgroundlevels that were demonstrated in some of the tests, the values may be consideredconservatively high. Therefore, these emission factors and speciation profiles should beused with caution. Despite these limitations, the emission factors for gas-fired sourcesderived from dilution sampling are believed to be more representative than otherpublished emission factors based on traditional methods for these sources (which in somecases may suffer from similar limitations) because of improved accuracy and differencesin process configuration. Additional tests within each of the source categories evaluated in this program are needed after dilution method improvements and validation have beenachieved. 1. INTRODUCTION In 1997, the United States Environmental Protection Agency (EPA) promulgated new NationalAmbient Air Quality Standards (NAAQS) for particulate matter (PM), including for the first timeparticles with aerodynamic diameter smaller than 2.5 micrometers (um) referred to as PM2.5.PM2.5 in the atmosphere also contributes to reduced atmospheric visibility, which is the subjectof existing rules for siting emission sources near Class 1 areas and new Regional Haze rules.There are few existing data regarding emissions and characteristics of fine aerosols from oil, gasand power generation industry combustion sources, and the information that is available isgenerally outdated and incomplete. Primary aerosol includes both filterable particles that aresolid or liquid aerosols at stack temperature plus those that form as the stack gases cool throughmixing and dilution processes in the plume downwind of the source. Traditional stationarysource air emission sampling methods tend to underestimate or overestimate the contribution ofthe source to ambient aerosols because they do not properly account for primary aerosolformation, which occurs after the gases leave the stack. These deficiencies in the currentmethods can have significant impacts on regulatory decision-making. PM2.5 measurementissues were extensively reviewed by the American Petroleum Institute (API) (England et al.,1998), and it was concluded that dilution sampling techniques are more appropriate for obtaininga representative PM sample from combustion systems for determining PM2.5 emission rate andchemical speciation. These techniques have been widely used in recent research studies. Forexample, Hildemann et al. (1994) and McDonald et al. (1998) used filtered ambient air to dilutethe stack gas sample followed by 80 to 90 seconds residence time to allow aerosol formation andgrowth to stabilize prior to sample collection and analysis. More accurate and completeemissions data generated using the methods developed in this program will enable more accuratesource-receptor and source apportionment analysis for PM2.5 NAAQS implementation andstreamline the environmental assessment of oil, gas and power production facilities. The U.S.Department of Energy National Energy Technology Laboratory (DOE/NETL), California EnergyCommission (CEC), Gas Research Institute (GRI),New York State Energy Research andDevelopment Authority (NYSERDA) and the API jointly funded this project. PROJECT OVERVIEW The focus of the project included two main tracks: Method Development. A dilution sampler and measurement protocol were developed tocharacterize the emission rates, chemical speciation and size of primary particles &reactive gases that lead to particle formation by atmospheric chemical reactions. Pilot-scale combustion tests were conducted to evaluate the effects of dilution samplingparameters (dilution ratio, residence time) for a variety of stack gas conditions producedby gas, oil, coal and doped gas combustion. The results were used to develop a newcompact dilution sampler design. Preliminary validation tests comparing results from thecompact dilution sampler and an existing benchmark design were performed in the fieldon a Diesel engine and a gas-fired power plant. Source Characterization Tests. Dilution sampling measurement methods were applied toseven stationary sources to characterize emission rates and chemical speciation profilesfor PM2.5 and gaseous precursors. The overall schedule for the project was: ● Year 1: Source Characterization (existing benchmark dilution system); Year 2: Method development and source characterization (existing and new dilutionsystems); Year 3: Source characterization (new dilution system). The project approach consisted of six tasks (Figure 1-1): ● Task 1-Method Definition. The focus of this task was to develop and build a morecompact, less costly and portable dilution sampler design- a next generation designcapable of producing results comparable to the California Institute of Technology(CalTech) design developed in the late 1980’s by Hildemann et al. and later improved byDesert Research Institute (DRI). A series of tests was conducted on a pilot-scalecombustor to investigate the effect of dilution sampler design parameters on measuredPM2.5 under a wide range of simulated source conditions. A draft test protocol forstationary source dilution sampling was developed and is currently being developed as aconsensus standard under ASTM International. ● Task 2- Source Characterization. This task provided for field tests on seven stationarycombustion sources (Table 1-1). Measurements included PM2.5 mass, chemicalspeciation and particle size using dilution sampling methods. Tests at three sites alsoincluded comparison tests using traditional hot filter/iced impinger methods. Six of theunits were tested firing gas fuel. One of these six sites also was tested firing No. 6 fuel oil. A Diesel engine also was tested, with and without a catalytic Diesel particulate filter(DPF). Figure 1-1. Project approach. Table 1-1. Source Types Tested During Program. SiteName Site Description DilutionMethods TraditionalMethods AlphaBravo CharlieDelta Echo Foxtrot Golf Refinery Process Heater without NOx Controls NGCC with Supplementary Firing and Post CombustionCO and NOx Controls (heavy duty)Refinery Process Heater with NOx Controls Dual-Fuel (Natural Gas and No. 6 Fuel Oil) Fired Institutional Boiler NGCC with Post Combustion CO and NOx Controls(heavy duty) Diesel Engine, with and without catalytic Dieselparticulate filter Refinery Cogeneration Power Plant with SupplementaryFiring and Post Combustion CO and NOx Controls (aeroderivative) XXXXXX XX NGCC= natural gas combined cycle power plant ● Task 3-Data Analysis & Reports. This task provided for reduction of field andlaboratory test results and preparation of project reports. ● Task 4 - Quality Assurance. Quality assurance/quality control activities necessary toaccomplish this objective were conducted in this task. ● Task 5 - Project Management. Routine technical, budget and schedule managementactivities were conducted Task 5 (project management reports, technical progress reports,etc.). Task 6-Technology Transfer. For these data to be of greatest benefit, it is importantthat the results be available in the open literature and that opportunities for peer review ofthe results are provided. This task provided for conference/journal publications and AdHoc Committee meetings of academic, industry, and regulatory agency peers to helpguide project direction. A series of topical and other reports provides detailed project results: ● Update: Critical Review of Source Sampling and Analysis Methodologies forCharacterizing Organic Aerosol and Fine Particulate Source Emission Profiles (Changand England, 2004a); Other Report: Pilot-Scale Dilution Sampler Design and Validation Tests (LaboratoryStudy) (Chang and England,2004b); Topical Report: Fine Particulate Test Protocol (England and McGrath, 2004). Technical Memorandum: Conceptual Model of Sources of Variability in CombustionTurbine particulate with aerodynamic diameter less than 10 um (PM10) Emissions Data(Lanier and England, 2004); Topical Report: Test Results For A Gas-Fired Process Heater (Site Alpha) (Wien,England and Chang, 2003); Topical Report: Test Results For A Combined Cycle Power Plant With SupplementaryFiring, Oxidation Catalyst And selective catalytic reduction (SCR) At Site Bravo (Wien,England and Chang,2004a); ●Topical Report: Test Results For A Gas-Fired Process Heater With Selective Catalyticoxides of nitrogen (NOx) Reduction (Site Charlie) (Wien, England and Chang, 2004b); Topical Report: Test Results For A Dual Fuel-Fired Commercial Boiler (Site Delta)(Wien, England and Chang, 2004c); ● Topical Report: Test Results For A Combined Cycle Power Plant With OxidationCatalyst And SCR At Site Echo (England et al., 2004); ● Topical Report: Test Results For A Diesel Fuel-Fired Compression IgnitionReciprocating Engine With A Diesel Particulate Filter At Site Foxtrot (Hernandez,Nguyen and England, 2004); Topical Report: Test Results For A Cogeneration Plant With Supplementary Firing,Oxidation Catalyst And SCR At Site Golf (England and McGrath, 2004b); and Topical Report: Impact of Operating Parameters on Fine Particulate Emissions fromNatural Gas-Fired Combined Cycle and Cogeneration Power Plants (England, 2004). REPORT ORGANIZATION This Final Report provides a comprehensive review of the key project results,organized in thefollowing sections: ● Section 1-Introduction ●9Section 2-Dilution Method Development ● Section 3 -PM2.5 Emission Factors and Speciation Profiles Section 4 -Findings and Recommendations 2. DILUTION METHOD DEVELOPMENT BACKGROUND Overview of Stationary Source Dilution Sampling Systems Dilution sampling has been used for more than 40 years to collect source emission samples fordetermination of various emission properties. It was adopted as the regulatory standard methodfor determination of particulate emissions from mobile sources including heavy-duty Dieselengines (International Organization for Standardization-ISO-8178,1996a,1996b; U.S. EPA,1992). At that time, dilution sampling equipment was bulky, expensive and complex to operate.Testing was done primarily in the lab, which did not pose a problem for routine testing since themobile source could come to the laboratory. Dilution sampling was considered impractical forroutine testing of stationary source emissions where the test equipment must be transported to thefield and access to sampling locations on elevated platforms is difficult; therefore, other non-dilution methods based on heated filters (and later the addition of iced aqueous impingers forcondensable PM) were adopted by regulatory agencies. Researchers continued to use dilutionsampling to develop chemical speciation profiles for stationary sources. Over the past 20 years, many designs evolved for stationary source sampling. The characteristicsof some of these recent designs are summarized in Table 2-1. Many of these designs arediscussed in more detail in England et al. (1998) and Chang and England (2004a). Dilutionsampling typically involves extracting a sample form the stack or flue, diluting it with purifiedambient air or pure compressed gases, then obtaining samples with ambient air collection andanalysis methods. In some designs, the sample is aged after mixing to allow additional time foraerosol formation. Because the sample is cooled to ambient temperatures, aerosol formationconditions approximately simulate those in actual exhaust plumes (to the extent practicable) andtest results are therefore more directly comparable to ambient air measurement results than arethose from hot filter/iced impinger methods. Table 2-1. Features of Recent Dilution Sampler Designs System Tunneldiameter(cm) Effectivemixinglength(diameters) NominalResidencetime (sec) Dilutionratio MixingsectionReynoldsnumber AgingSectionDiameter(cm) AgingsectionReynoldsnumber PM2.5 cut afteraging? Tunnel material| Portability? References Carpenter 30 12 to 15 1.3 8:1 to 25:1typ (up to100:1) 47,000 N/A N/A No Stainless steel No Carpenter (1978) NEA io 29 1 to 3 >20:1 11,000-23.000 N/A N/A No PVC Luggable Houck et al.(1982) SRI 21 6 6.2 25:1 2800 N/A N/A No Acrylic andTeflon Yes Smith et al. (1982) CalTech 15 10 2 to 180 40:1(25:1to 100:1) 10,000 46 700 Yes Stainless steeland Teflon Luggable Hildemann et al.(1989) URG 8 8 5 to 40 20:1 to40:1 na 8 na Yes Teflon-coatedglass andaluminum Luggable URG (1996) CaliforniaARB 15 12 1 to 5 10:1 to50:1 10,000 N/A N/A No Teflon-coatedstainless steel Yes Wall (1996);Lindner and Wall (1995) DRI 15 18 80typically) 40:1(25:1to 50:1) 9,000 (at40x dilutionratio) 46 700 Yes Stainless steel Luggable EER 20 1 10 20:1(10:1to 40:1) 5500 20 800 Yes Stainless steel Yes Chang and England(2004) CMU 15 15 0 to 12minutes 20 to 200 3000-13000 na na Yes Stainless steel Luggable Lipsky et al.(2002) CANMET1 6 25 20 to 80 40:1(25:1to 100:1) 7500 (at40:1 dilutionratio) na 650 Yes Teflon-coatedaluminum Luggable Lee et al (2002) CANMET3 5 40 10 to 40 40:1(25:1to 80:1) 13,000 30 1,400 Yes Teflon-coatedstainless steel Yes Lee et al (2003) PAPRICAN 14.5 18 90 30:1(25:1to 40:1) 11,000 27 170 Yes Teflon-caotedstainless steel Luggable O'Connor (2003);O'Connor andGenest (2003a,2003b) EPA 14 3.2 1 20:1 to40:1 na N/A N/A No Teflon-coatedaluminum andstainless steel Yes U.S. EPA (2003a) N/A- not applicable na- data not available Mobile Source Dilution Systems Dilution sampling systems have been used for mobile source sampling for many years. Themain applications have been type testing of reciprocating engines (gasoline and Diesel) used inautomobiles, locomotives, marine vessels, and others (U.S. EPA, 1994; ISO 8178, 1996a,1996b). Typically, these systems dilute the sample at overall dilution ratios of 10:1 to 50:1 andhigher, in one and sometimes two stages of dilution, with rapid sample-dilution air mixing andshort total bulk mean gas residence times (typically 1 to 5 seconds) (Figure 2-1). Constantvolume sampling is common, where the total exhaust from the engine is captured and diluted,then divided for sampling. There is a large body of literature for mobile and Diesel engine applications regarding design and use of dilution samplers, and many issues remaincontroversial. Kittelson (1999) provides an excellent review of recent dilution sampling issuesfor Diesel engine applications. Figure 2-1. Typical Constant Volume Dilution Sampler for Mobile Source Testing (U.S. EPA,1994). While the lessons learned from mobile source applications are useful, not all of them may applydirectly to stationary sources because of distinct differences in the process and exhaustcharacteristics. Reciprocating internal combustion engines tend to produce relatively highconcentrations of unburned or partially burned fuel fragments, resulting in relatively highconcentrations of organic vapors and nanometer-sized soot particles in the exhaust that areusually the main source of particulate emissions from such engines. The residence time in thecombustion chambers during the combustion stroke is on the order of milliseconds. Combustionproducts are then rapidly discharged to the atmosphere (typically much less than one secondfrom combustion chamber to atmosphere) without further heat extraction at relatively hightemperatures. Because of the high concentrations of soot and organic vapors and hightemperature at the point of discharge, significant changes to aerosol size and number typically occur rapidly after discharge. These conditions are generally true for both mobile and stationaryreciprocating internal combustion engines, although timescales can be slightly longer forstationary reciprocating engines that rotate more slowly and those with post-combustionemission controls. Many stationary sources are external combustion devices (e.g.,boilers, process heaters, etc.),direct combustion devices (kilns, etc.), continuous internal combustion devices (e.g. combustionturbines) and non-combustion processes. Combustion efficiency is a premium for these sourcesand rarely are large amounts of unburned fuel and soot present in the exhaust under normal“good combustion practice”conditions. Combustion chambers and exhaust gas paths arerelatively large, per unit of fuel burned, in comparison to typical mobile reciprocating engines.Residence time at high temperature in external combustion chambers may be on the order of 3 to5 seconds, enabling combustion to proceed further to completion than reciprocating engines.Heat recovery equipment is frequently used after combustion to extract useful heat, cooling theflue gas to relatively low temperatures and providing additional gas residence time. The totalgas-phase residence time prior to discharge in large stationary sources with air pollution controlequipment such as electrostatic precipitators and scrubbers may easily exceed 10 seconds.Because of relatively long process residence times, frequently cooler stack temperatures, andlower concentrations of condensable vapors and soot, aerosol dynamics are typically relaxed to amuch greater degree for external combustion sources than for reciprocating engines. Thus, specific dilution sampling parameters that are important for reciprocating engines may bemore or less important for stationary external combustion devices and other processes becausethe time scales from combustion to sample are significantly different. For example, Kittelson(1998) conducted experiments showing that nanoparticle number size distributions in Dieselexhaust change dramatically over time scales from 0.04 to 6 seconds (Figure 2-2) and are verysensitive to dilution ratio, humidity, and temperature of the dilution air. Note, this may nottranslate directly to dramatic changes in total PM2.5 mass since the smallest particles have theleast amount of mass and the simple accumulation of smaller particles into larger ones does notchange their total mass. For many stationary combustion systems, the total residence within theprocess is on the order of 6 seconds; thus, at least some of the changes observed by Kittelsonmay already have occurred prior to the exhaust sampling point. iiRevision . October
关闭-
1/130
-
2/130

还剩128页未读,是否继续阅读?
继续免费阅读全文产品配置单
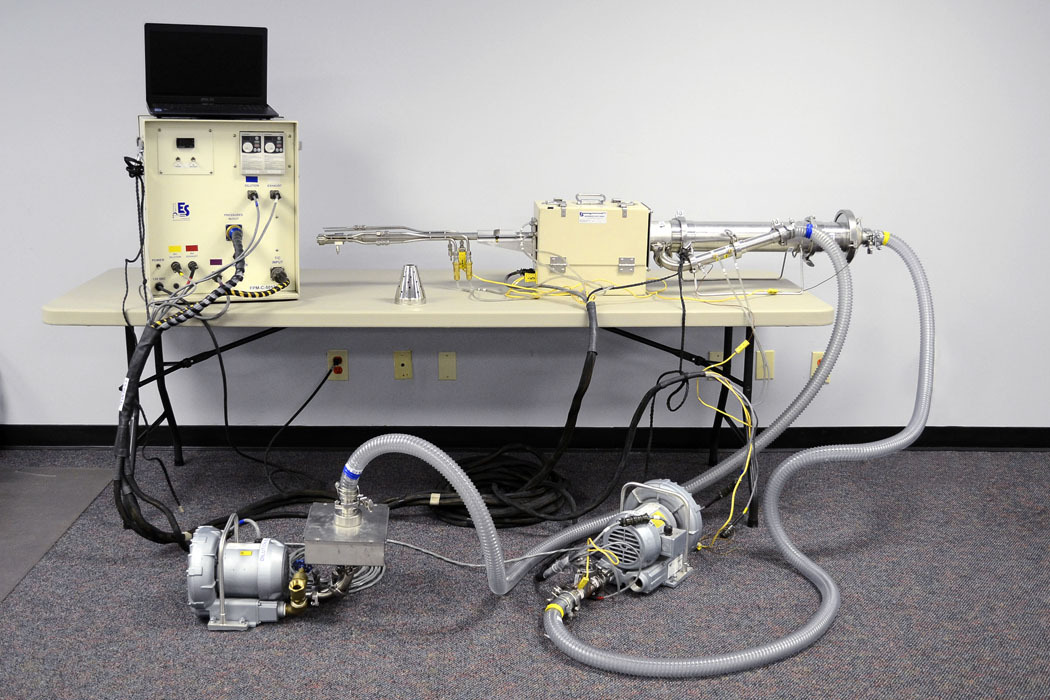
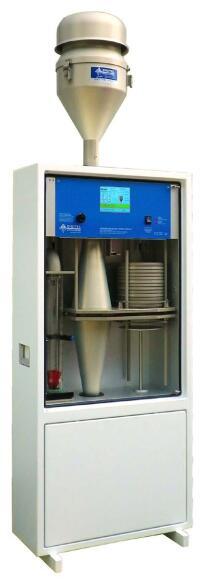
北京迪特锐科技有限公司为您提供《废气中颗粒物检测方案 》,该方案主要用于废气中颗粒物检测,参考标准《暂无》,《废气中颗粒物检测方案 》用到的仪器有便携式PM2.5稀释采样系统。
我要纠错
推荐专场
相关方案
 咨询
咨询