方案详情文
智能文字提取功能测试中
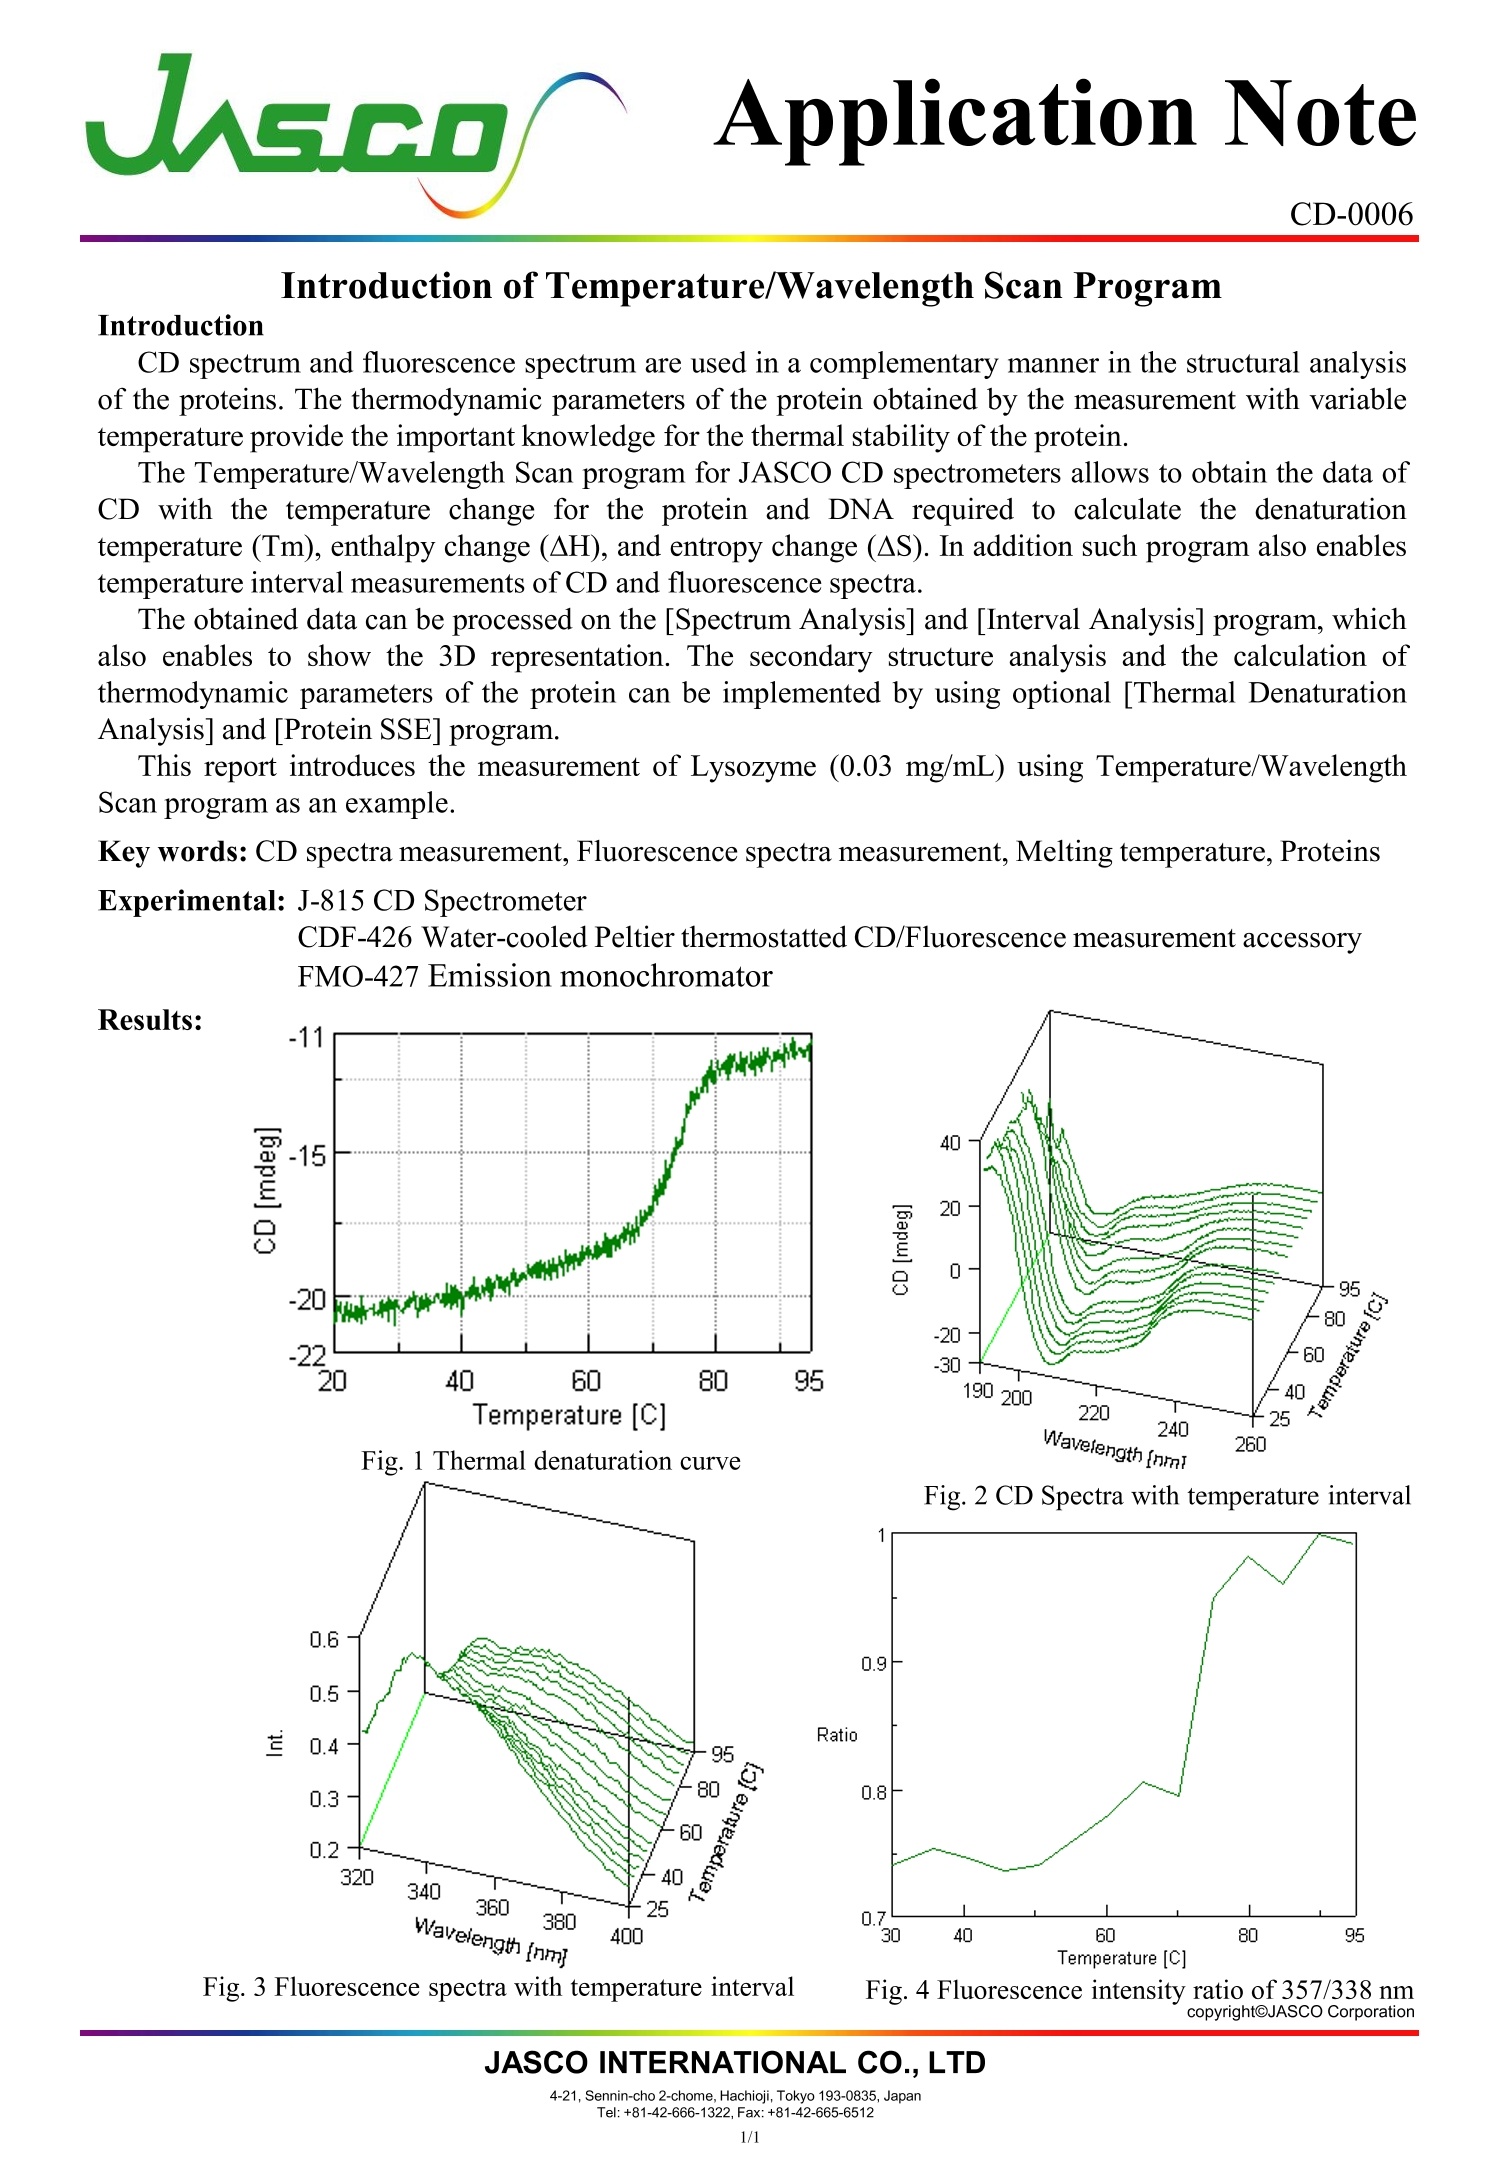
Application NoteJASCO INTERNATIONAL CO., LTD4-21, Sennin-cho 2-chome, Hachioji, Tokyo 193-0835, Japan CD-0006 Introduction of Temperature/Wavelength Scan Program Introduction CD spectrum and fluorescence spectrum are used in a complementary manner in the structural analysisof the proteins. The thermodynamic parameters of the protein obtained by the measurement with variabletemperature provide the important knowledge for the thermal stability of the protein. The Temperature/Wavelength Scan program for JASCO CD spectrometers allows to obtain the data ofCD with the temperature change for the protein and DNA required to calculate the denaturationtemperature (Tm), enthalpy change (AH), and entropy change (AS). In addition such program also enablestemperature interval measurements of CD and fluorescence spectra. The obtained data can be processed on the [Spectrum Analysis] and [Interval Analysis] program, whichalso enables to show the 3D representation. The secondary structure analysis and the calculation ofthermodynamic parameters of the protein can be implemented by using optional [Thermal DenaturationAnalysis] and [Protein SSE] program. This report introduces the measurement of Lysozyme (0.03 mg/mL) using Temperature/WavelengthScan program as an example. Key words: CD spectra measurement, Fluorescence spectra measurement, Melting temperature, Proteins Experimental: J-815 CD Spectrometer CDF-426 Water-cooled Peltier thermostatted CD/Fluorescence measurement accessory FMO-427 Emission monochromator Results: Fig. 1 Thermal denaturation curve Fig. 2 CD Spectra with temperature interval Ratio Fig. 3 Fluorescence spectra with temperature interval Fig. 4 Fluorescence intensity ratio of 357/338 nm copyrightOJASCO Corporation CD spectrum and fluorescence spectrum are used in a complementary manner in the structural analysis of the proteins. The thermodynamic parameters of the protein obtained by the measurement with variable temperature provide the important knowledge for the thermal stability
关闭-
1/1
产品配置单
佳士科商贸有限公司为您提供《溶解酵素中溶解温度检测方案 》,该方案主要用于生物发酵中溶解温度检测,参考标准《暂无》,《溶解酵素中溶解温度检测方案 》用到的仪器有JASCO圆二色光谱仪CD J-1500。
我要纠错
相关方案
 咨询
咨询