

方案详情文
智能文字提取功能测试中
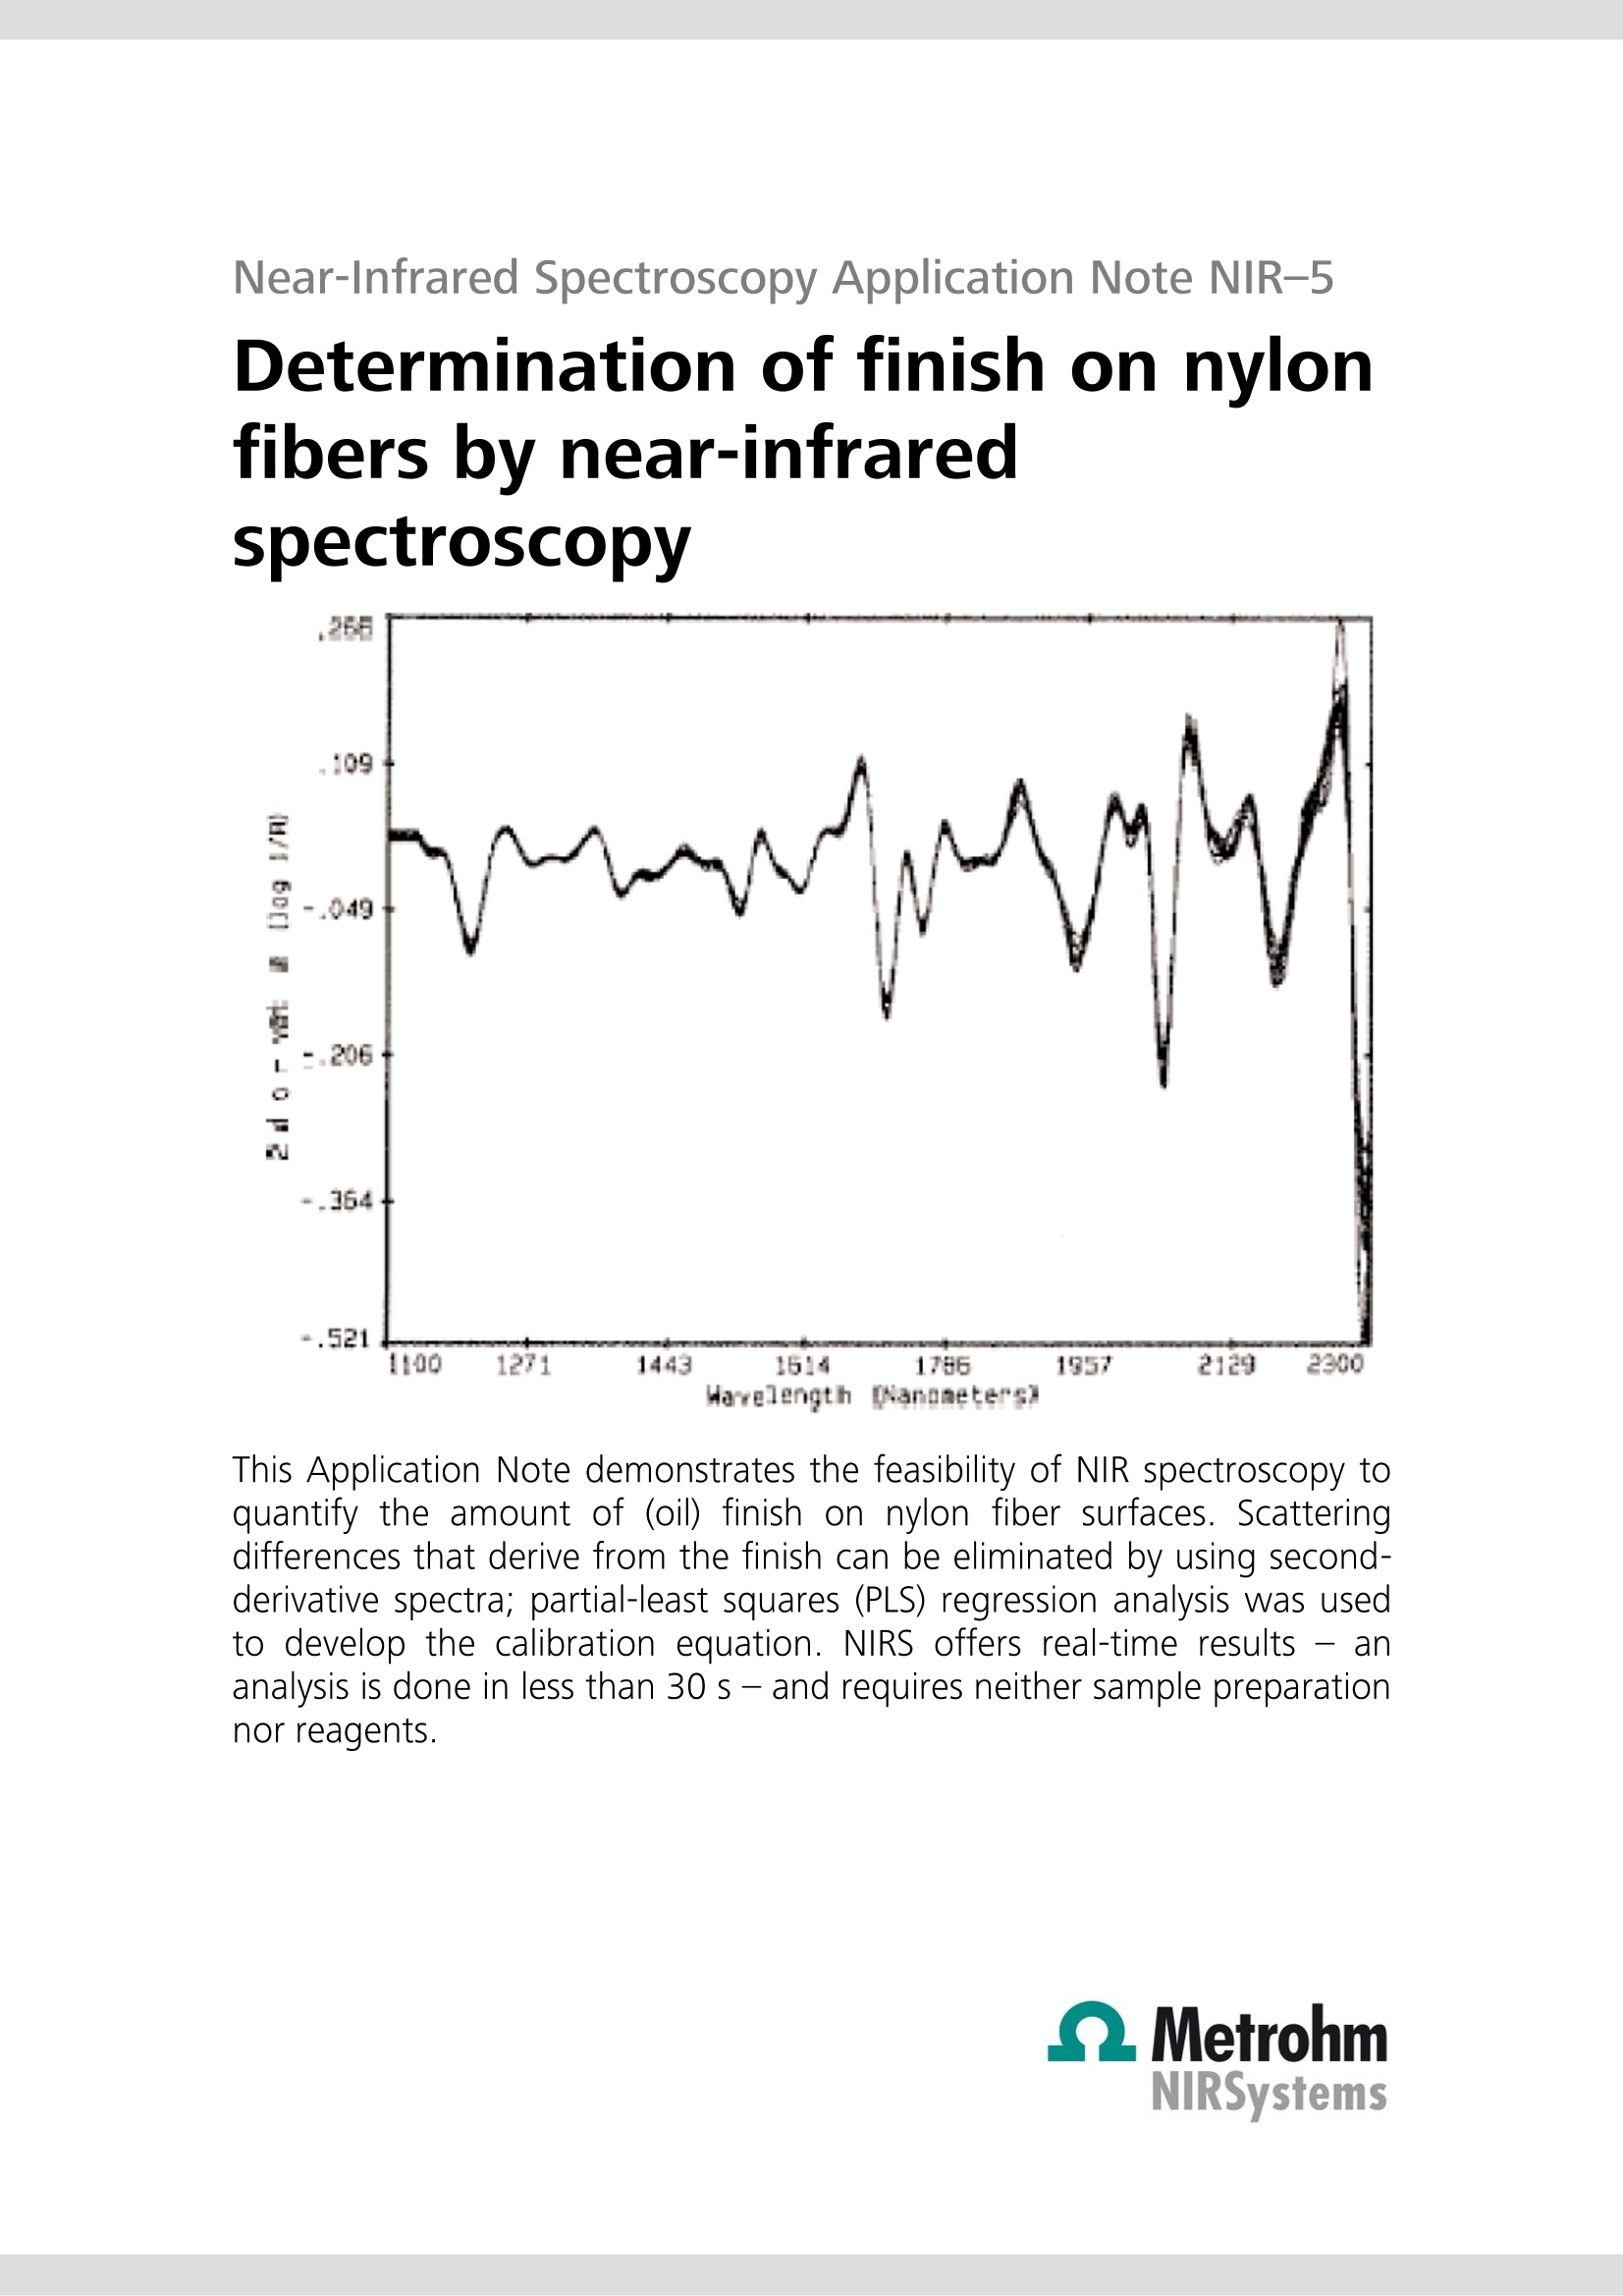
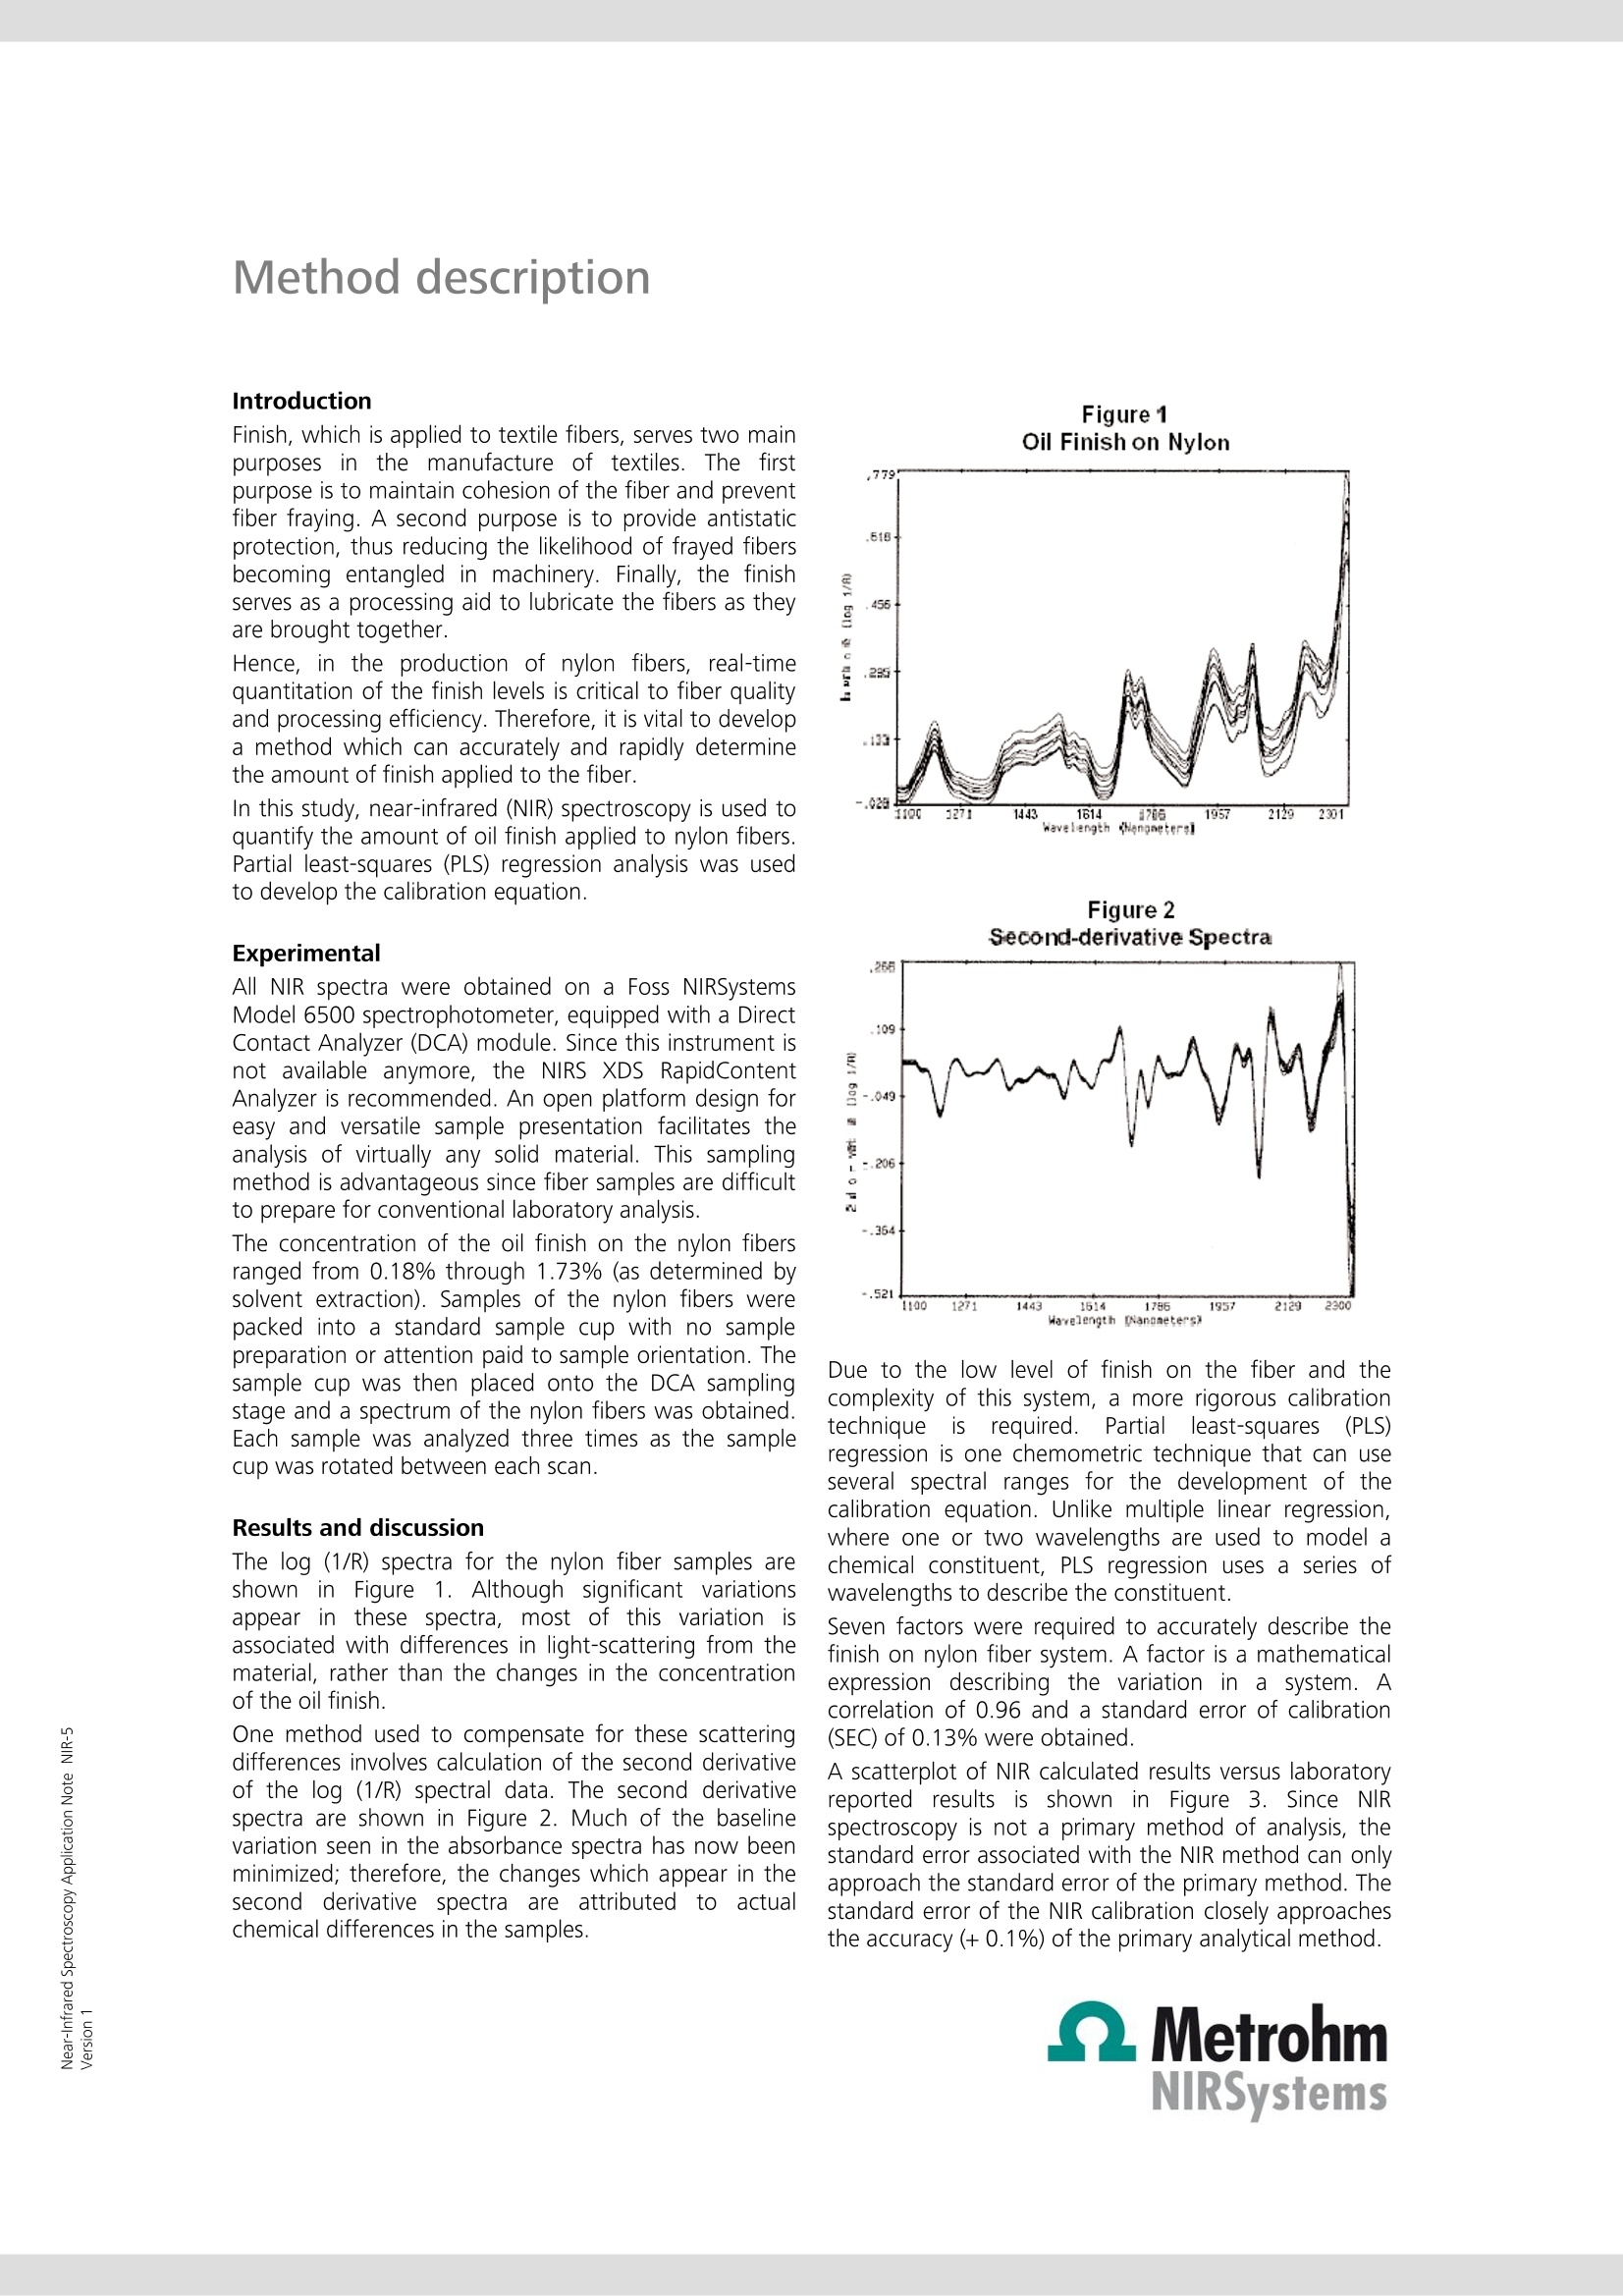
Near-Infrared Spectroscopy Application Note NIR-5 Determination of finish on nylonfibers by near-infraredspectroscopy This Application Note demonstrates the feasibility of NIR spectroscopy toquantify the amount of (oil) finish on nylon fiber surfaces. Scatteringdifferences that derive from the finish can be eliminated by using second-derivative spectra; partial-least squares (PLS) regression analysis was usedto develop the calibration equation. NIRS offers real-time results - ananalysis is done in less than 30 s -and requires neither sample preparationnor reagents. Introduction Finish, which is applied to textile fibers, serves two mainpurposes in tthhe e mamnaunfiacture of textiles. The firstpurpose is to maintain cohesion of the fiber and preventfiber fraying. A second purpose is to provide antistaticprotection, thus reducing the likelihood of frayed fibersbecoming entangled in machinery. Finally, the finishserves as a processing aid to lubricate the fibers as theyare brought together. Hence, in the production of nylon fibers, real-timequantitation of the finish levels is critical to fiber qualityand processing efficiency. Therefore, it is vital to developa method which can accurately and rapidly determinethe amount of finish applied to the fiber. In this study, near-infrared (NIR) spectroscopy is used toquantify the amount of oil finish applied to nylon fibers.Partial least-squares (PLS) regression analysis was usedto develop the calibration equation. Experimental All NIR spectra were obtained on a Foss NIRSystemsModel 6500 spectrophotometer,equipped with a DirectContact Analyzer (DCA) module. Since this instrument isnot available anymore, the NIRS XDS RapidContentAnalyzer is recommended. An open platform design foreasy and versatile sample presentation facilitates theanalysis of virtually any solid material. This samplingmethod is advantageous since fiber samples are difficultto prepare for conventional laboratory analysis. The concentration of the oil finish on the nylon fibersranged from 0.18% through 1.73% (as determined bysolvent extraction). Samples of the nylon fibers werepacked into a standard sample cup with no samplepreparation or attention paid to sample orientation. Thesample cup was then placed onto the DCA samplingstage and a spectrum of the nylon fibers was obtained.Each sample was analyzed three times as the samplecup was rotated between each scan. Results and discussion The log (1/R) spectra for the nylon fiber samples areshown in Figure 1. Although significant variationsappear in these spectra, most of this variation isassociated with differences in light-scattering from thematerial, rather than the changes in the concentrationof the oil finish. One method used to compensate for these scatteringdifferences involves calculation of the second derivativeof the log (1/R) spectral data. The second derivativespectra are shown in Figure 2. Much of the baselinevariation seen in the absorbance spectra has now beenminimized; therefore, the changes which appear in thesecond derivative spectra are attributedtoactualchemical differences in the samples. Figure 1Oil Finish on Nylon Figure2Second-derivative Spectra Due to the low level of finish on the fiber and thecomplexity of this system, a more rigorous calibrationtechniqueisrequired. Partialleast-squares((PLS)regression is one chemometric technique that can useseveral spectral ranges for the development of thecalibration equation. Unlike multiple linear regression,where one or two wavelengths are used to model achemical constituent, PLS regression uses a series ofwavelengths to describe the constituent. Seven factors were required to accurately describe thefinish on nylon fiber system. A factor is a mathematicalexpression describing the variation in aa system. Acorrelation of 0.96 and a standard error of calibration(SEC) of 0.13% were obtained. A scatterplot of NIR calculated results versus laboratoryreported results is shown inFigure 3. Since NIRspectroscopy is not a primary method of analysis, thestandard error associated with the NIR method can onlyapproach the standard error of the primary method. Thestandard error of the NIR calibration closely approachesthe accuracy (+0.1%) of the primary analytical method. Method description Figure 3 The PLS equation was tested using five validationsamples not included in calibration development. Theresults from the analysis of these samples are shown inTable 1. The standard error of prediction (SEP) for thisvalidation set was 0.07%. Since the SEP is of the samerelative maqnitude of the SEC, this indicates that the PLScalibration is a reasonable and acceptable one. Table 1: Results from oil finish external validation set Sample Lab value NIR value A 1.06 1.00 B 1.32 1.34 C 1.26 1.22 D 1.08 1.07 E 0.84 0.75 Standard error of prediction=0.07% Conclusions The results obtained in this study demonstrate thefeasibility of using NIR spectroscopy to quantify oilfinishes on nylon fiber surfaces. The standard error ofthe NIR results were comparable to the primary methodof analysis (0.13%vs. 0.10%). There2are ttwwoo major advantages of usingNIRmethodology for this application. First, NIR provides amore rapid method of analysis (40 s with reference andsample scanning) compared to the primary method ofsolvent extraction (typically 2 h). Therefore, moresampling can occur which provides greater processcontrol information. The second advantage is the fact that no samplepreparation is needed. Consequently, there is no moreneed for solvents and solvent disposal, therebydecreasingthee overall costofproducing andmaintaining quality fibers. co
关闭-
1/3
-
2/3
还剩1页未读,是否继续阅读?
继续免费阅读全文产品配置单
瑞士万通中国有限公司为您提供《尼龙纤维中油剂检测方案(近红外光谱仪)》,该方案主要用于其他中含量分析检测,参考标准《暂无》,《尼龙纤维中油剂检测方案(近红外光谱仪)》用到的仪器有瑞士万通DS2500 近红外光谱分析仪、瑞士万通PRO 近红外在线分析仪。
我要纠错