方案详情文
智能文字提取功能测试中
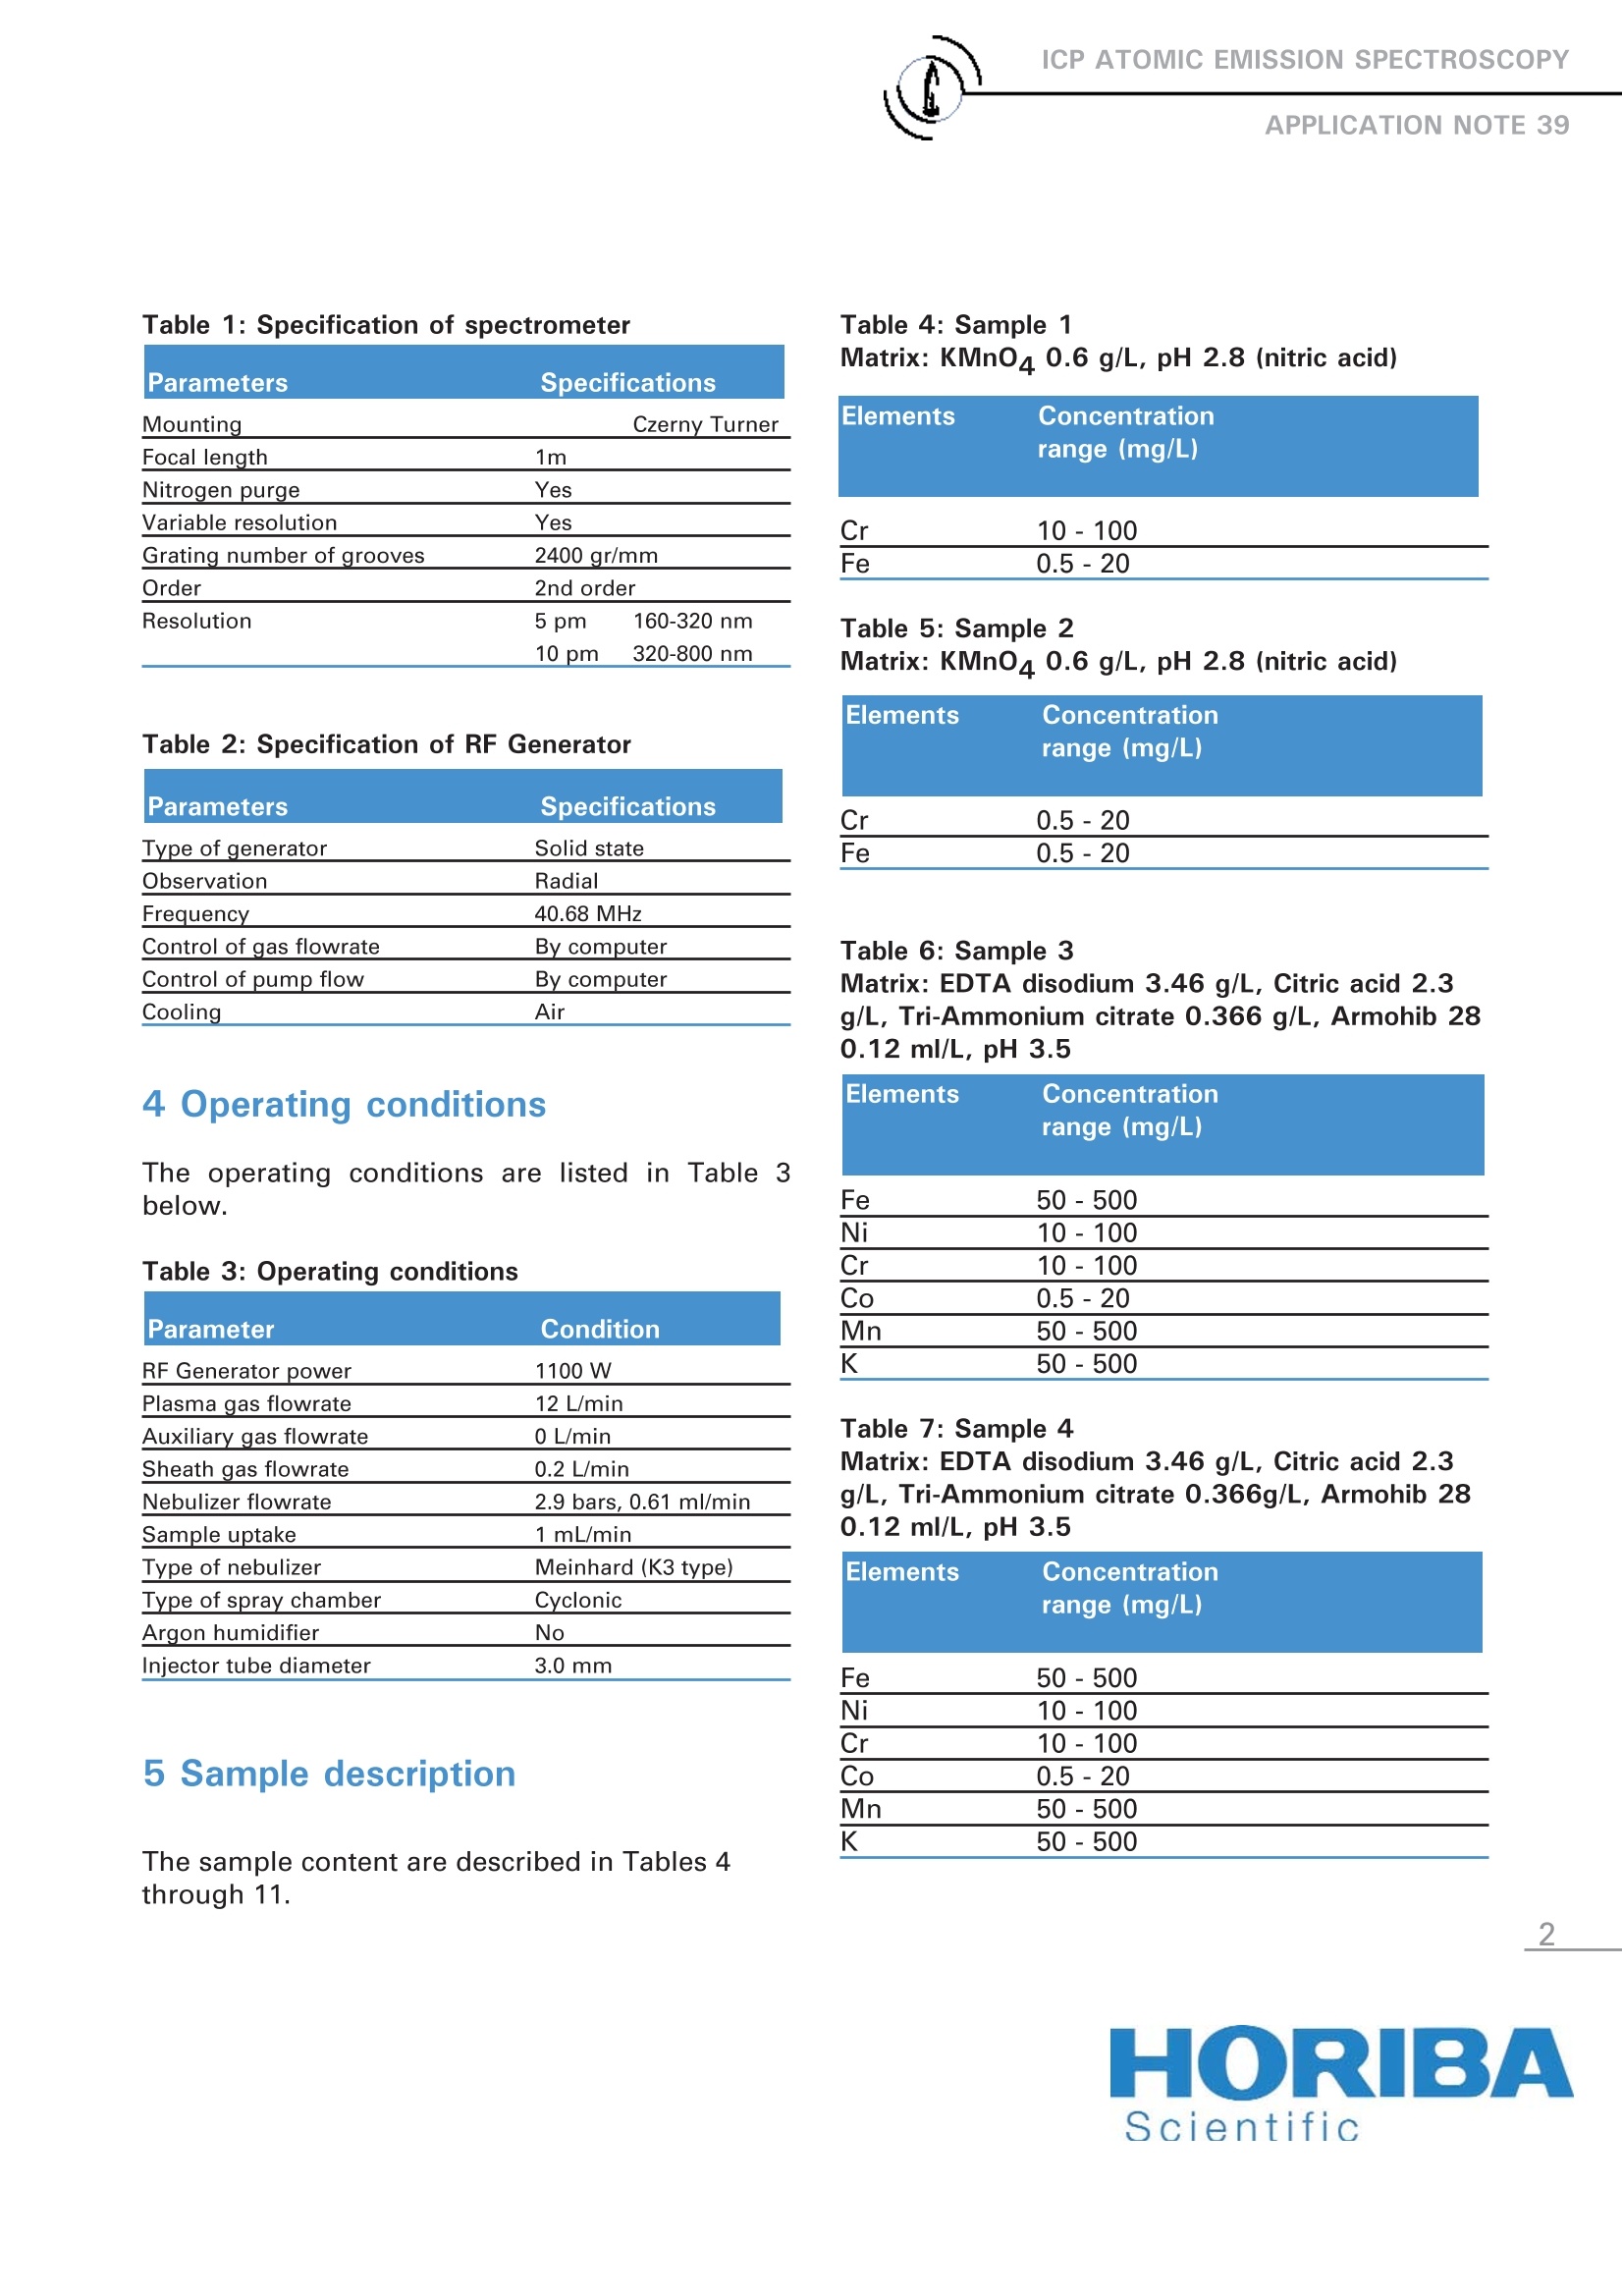
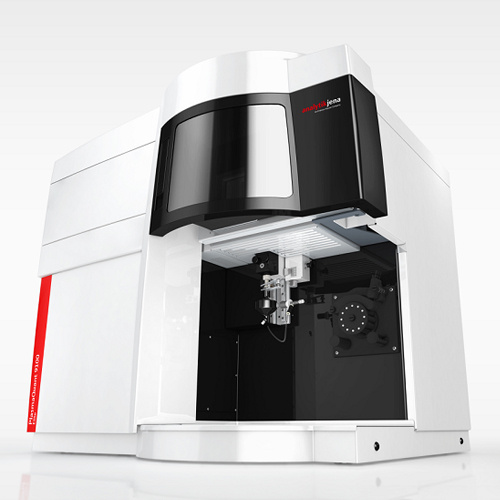
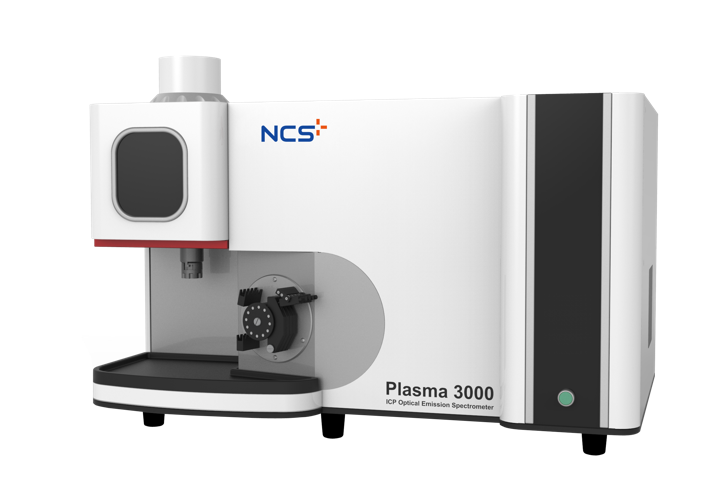
ICP ATOMIC EMISSION SPECTROSCOPYAPPLICATION NOTE 39 Analysis of Samples Related to Nuclear Submarine Operation Agnes Cosnier, Jobin Yvon S.A.S., Horiba Group, Longjumeau, France Keywords: nuclear Eight samples from the Nuclear Division of acompany were analyzed. These samples havecomplex matrices such as salt, concentratedacid, etc. and required high dilution factorswhen flame AAS is used. This application notewill demonstrate the feasibility and simplicityof the ICP technique for this type of analysis. 2 Principle 2.1 Technique used The elemental analysis of solutions was under-taken by Inductively Coupled Plasma AtomicEmission Spectrometry (ICP-AES). The sampleis nebulized then transferred to an argon plas-ma. It is decomposed, atomized and ionizedwhereby the atoms and ions are excited. Wemeasure the intensity of the light emitted whenthe atoms or ions return to lower levels of ener-gy. Each element emits light at characteristicwavelengths and these lines can be used forquantitative analysis after a calibration. 2.2 Wavelength choice The choice of the wavelength in a given matrixcan be made using the "profile"function, or byusing Win-IMAGE, which is rapid semi-quantita-tive analysis mode using multiple wavelengths.The principle is the same in either case: recordthe scans of analytes at low concentration, andof the matrix. By superimposing the spectra,wesee possible interferences. 2.3 Limits of detection The limits of detection are calculated using thefollowing formula: LOD= kx BEC x RSD, With: LOD = limits of detection, k= 3 for the normal 3-sigma values, BEC=Background equivalent concentration, RSDB= relative standard deviation of the blank. To calculate the LOD, a calibration curve is con-structed using two points, 0 ppm and 5 ppm, orsome concentration where the calibration is lin-ear; thus providing the BEC. The RSDB is evalu-ated by running the blank ten times. 3 Instrument specification The work presented hare was performed on aULTIMA 2.The specifications of this instrumentare listed below in Tables 1 and 2. Table 1: Specification of spectrometer Parameters Specifications Mounting Czerny Turner Focal length 1m Nitrogen purge Yes Variable resolution Yes Grating number of grooves 2400 gr/mm Order 2nd order Resolution 5 pm 160-320 nm 10 pm 320-800 nm Table 2: Specification of RF Generator Parameters Specifications Type of generator Solid state Observation Radial Frequency 40.68 MHz Control of gas flowrate By computer Control of pump flow By computer Cooling Air 4 Operating conditions The operating conditions are listed in Table 3below. Table 3: Operating conditions Parameter Condition RF Generator power 1100 W Plasma gas flowrate 12 L/min Auxiliary gas flowrate 0 L/min Sheath gas flowrate 0.2 L/min Nebulizer flowrate 2.9 bars,0.61 ml/min Sample uptake 1 mL/min Type of nebulizer Meinhard (K3 type) Type of spray chamber Cyclonic Argon humidifier No Injector tube diameter 3.0 mm 5 Sample description The sample content are described in Tables 4through 11. Table 4: Sample 1 Matrix: KMn04 0.6 g/L, pH 2.8 (nitric acid) Elements Concentration range (mg/L) Cr 10-100 Fe 0.5-20 Table 5: Sample 2Matrix: KMn04 0.6 g/L, pH 2.8 (nitric acid) Elements Concentration range (mg/L) Cr 0.5-20 Fe 0.5-20 Table 6: Sample 3Matrix: EDTA disodium 3.46 g/L, Citric acid 2.3g/L, Tri-Ammonium citrate 0.366 g/L, Armohib 280.12 ml/L, pH 3.5 Elements Concentration range (mg/L) Fe 50-500 Ni 10- 100 Cr 10-100 Co 0.5-20 Mn 50-500 K 50-500 Table 7: Sample 4Matrix: EDTA disodium 3.46 g/L, Citric acid 2.3g/L, Tri-Ammonium citrate 0.366g/L, Armohib 280.12 ml/L, pH 3.5 Elements Concentration range (mg/L) Fe 50-500 Ni 10-100 Cr 10-100 Co 0.5-20 Mn 50-500 K 50-500 Table 8: Sample 5 Matrix: K2B4073.45 g/L, pH 9.2 Elements Concentration range(mg/L) Li 0.5-20 Table 9: Sample 6Matrix: K2B40750 ppm, pH 7 Elements Concentration range (mg/L) Li 0.01-1 Table 10: Sample 7 Matrix: Na 550 ppm, Formate 14,800 ppm, picoli-nate 5600 ppm, pH3 Elements Concentration range (mg/L) Fe 100-1000 Ni 0.5-20 Cr 0.5-20 Co 0.5-20 Mn 50-500 K 10-100 V 100-1000 Table 11: Sample 8 Matrix: Na 385 ppm, Formate 12,300 ppm, picoli-nate 3905 ppm,pH 3 Elements Concentration range (mg/L) Fe 50-500 Ni 0.5-20 Cr 0.5-20 Co 0.5-20 Mn 10-100 K 10-100 V 50-500 6 Results The samples were analyzed first with a fast semi-quantitative method, and then quantitatively withappropriate calibration and analysis conditions.The semi-quantitaive method is made with a cali-bration at 5 mg/L in deionized water, one replicateand fast acquisition. It allows us to identify thesample by determining the elements of interestand concentration, and identify other elementswhich may cause matrix effects if present at highconcentration or interference. It also allows theestimation of the calibration range for all the ele-ments. We worked with dilution factors of 10 (samples 1and 2) or 50 (samples 3-8), and this way were ableto analyze all the elements in all samples using asingle quantitative method. Note that the semi-quantitative analyses did notreveal any surprise in terms of unknown elements:With the dilution factor selected, the matrix effectis nonexistent owing to the radial view of the plas-ma. The quantitative method was calibrated withmulti-element standards (in deionized water, usingSpex* standards), as following: 0 / 0.01/0.1/1/10/30 mg/L The example of Cr calibration line is shown figure1. Figure 1: Cr calibration curve The wavelengths selected are listed in table 12. Table 12: Wavelengths Element Wavelength B 249.773 Co 228.616 Cr 267.716 Fe 259.940 K 766.490 Li 670.784 Mn 257.610 Ni 221.647 V 292.402 The acquisition parameters used for quantitativeanalysis are: Maximum Mode (1 point measured atthe top of the peak) 4 seconds and 3 seconds forthe background correction. Total analysis is lessthan 4 minutes, including rinse time (betweeneach sample), and sample transfer time (theautosampler JY AS-421 was used). This is animportant benefit compared to flame AAS. The quantitative results are presented in Tables 13to 22. Results are given in mg/L in the diluted solu-tions and results from the semi-quantitativemethod (S.Q.) to compare, noting that the S.Q. cal-ibration is a simple one with 0 and 5 mg/L, and ele-ments may be out of calibration range. Due to thehigh dynamic range of the ULTIMA 2 this methodgives quite accurate results in a wide range of con-centrations, even for traces. Table 13: Certified Reference Sample 1640, concentrations in the diluted solutions, in mg/L Sample 1640 Quantitative method Semi-Quant method Certified EI Conc RSD Conc Conc B 0.3138 0.70 0.2971 0.3011 Co 0.0207 0.37 0.0187 0.02028 Cr 0.0369 1.53 0.0361 0.0386 Fe 0.0324 1.05 0.0295 0.0343 K 0.918 2.23 0.743 0.994 Li 0.0469 0.64 0.044 0.0507 Mn 0.1126 1.22 0.1210 0.1215 Ni 0.0285 0.53 0.0321 0.0274 V 0.0140 2.20 0.0121 0.01299 Table 14: Sample 2 results obtained in sample diluted by 10 Sample 1 diluted /10 Semi-Quant method Quantitative method EI Conc(mg/l) Conc(mg/l) RSD In initial sample Spike Conc (mg/l) (mg/l) B 0.006 1.44 0.006 50 Co 0.000 64.50 0.00 Cr 5.596 5.206 0,53 52.06 Fe 0.0318 0.0254 2,33 0.0254 K 23.392 0,31 23.392 Li 0.00 27.90 0.00 Mn 23.35 20.931 0,89 209.31 Ni 0,000 19,25 0.00 V 0,002 1,66 0.003 Table 15: Sample 2 results obtained in sample diluted by 10 Sample 2 diluted /10 Semi-Quant method Quantitative method EI Conc(mg/l) Conc(mg/l) RSD In initial sample Spike Conc (mg/l) (mg/l) B 0.004 1.98 Co 0.000 358.4 Cr 0.533 0.530 0.67 5.30 5 Fe 0.0328 0.0254 2.34 0.254 1 K 16.040 0.20 Li 0.001 58.05 Mn 22.208 21.038 0.79 210.38 209 Ni 0.000 19.25 V 0.002 1.66 Table 16: Sample 3 results obtained in sample diluted by 50 Sample 3 diluted /50 Semi-Quant method Quantitative method EI Conc(mg/l) RSD Conc(mg/l) In initial sample Spike Conc (mg/l) (mg/l) B 0.0046 4.36 Co 0.042 0.0451 0.43 2.26 Cr 1.049 1.002 0.94 50.11 50 Fe 4.210 4.239 0.52 211.94 200 K 8.564 9.6771 0.74 483.85 Li 0.0007 121.67 Mn 4.351 4.166 0.84 208.31 209 Ni 0.4094 0.4415 0.99 22.08 20 V 0.0018 12.26 Table 17: Sample 4 results obtained in sample diluted by 50 Sample 4 diluted /50 In initial sample Semi-Quant methoddQuantitative method Spike EI Conc(mg/l) Conc(mg/l) RSD Conc (mg/l) (mg/l) B 0.004 1.87 Co 0.0172 0.021 1.51 1.03 1 Cr 0.0978 0.103 0.73 5.13 5 Fe 0.0948 0.109 1.37 5.46 5 K 3.284 3.087 1.09 154.35 148 Li 0.001 5.50 Mn 4.473 4.266 0.81 213.28 209 Ni 0.0420 0.044 1.21 2.20 2 V 0.002 12.99 Table 18: Sample 5 results obtained in sample diluted by 50 Sample 5 diluted /50 In initial sample Semi-Quant method Quantitative method Spike El Conc(mg/l) Conc(mg/l) RSD Conc (mg/l) (mg/l) B 13.262 13.689 0.13 684.47 639 Co 0.000 57.52 Cr 0.000 111.00 Fe 0.001 9.28 K 21.973 23.498 0.51 1174.89 1156 Li 0.0769 0.076 0.62 3.82 4 Mn 0.001 22.31 Ni 0.000 39.48 V 0.002 3.92 Table 19: Sample 6, results obtained in a non diluted sample Sample 6 non diluted Quantitative method Spike EI Conc (mg/L) (mg/L) B 9.768 9.3 Co 0.00 Cr 0.00 Fe 0.002 K 16.574 16.7 Li 0.052 0.058 Mn 0.00 Ni 0.00 V 0.002 Table 20: Sample 6 results obtained in sample diluted by 50 Sample 6 diluted /50 In initial sample Semi-Quant methodQuantitative method Spike EI Conc(mg/l) Conc(mg/l) RSD Conc (mg/l) (mg/) B 0.1689 0.209 0.16 10.44 9.3 Co 0.000 87.58 Cr -0.000 203.82 Fe 0.001 22.59 K 0.03037 0.361 1.76 18.04 16.7 Li 0.0031 0.0014 18.93 0.070 0.058 Mn 0.001 12.72 Ni -0.000 1 208.54 V 0.001 25.56 Scientific Table 21: Sample 7 results obtained in sample diluted by 50 Semi-Quant method Conc(mg/L) In initial sample CQuantitative method Spike Conc(mg/L) RSD Conc (mg/L) (mg/L) EI B 0.019 2.05 Co 0.035 0.0353 1.28 1.77 1.6 Cr 0.1710 0.1702 1.12 8.51 8 Fe 6.953 6.817 1.06 340.86 K 0.9784 0.9964 0.82 49.82 Li -0.000 116.78 Mn 1.345 1.312 0.35 65.69 64 Ni 0.3533 0.3466 0.46 17.33 16 V 25.661 25.587 0.56 1279.35 Table 22: Sample 8 results obtained in sample diluted by 50 Sample 8 diluted /50 In initial sample Semi-Quant methodQuantitative method Spike EI Conc(mg/l) Conc(mg/l) RSD Conc (mg/l) (mg/l) B 0.007 4.78 Co 0.019 0.0037 7.17 0.18 0.18 Cr 0.0146 0.0195 2.29 0.98 0.9 Fe 0.7943 0.7919 0.78 39.60 K 0.835 1.072 1.63 53.61 Li -0.002 31.23 2 Mn 1.553 1.426 0.60 71.31 Ni 0.0432 0.0400 0.93 2.00 V 13.803 13.576 0.92 678.79 7 Conclusion The ULTIMA 2 ICP allows simple and rapid analysis using one single analytical method. The simple dilu-tion made here helps to reduce matrix effects and to use a simple calibration in water, covering all theconcentration ranges required. Some samples can be analyzed directly without dilution such as examplesample 6, owing to the robustness of the plasma. Scientific Other Countries: Tel: +33 (0)1 64 54 13 00-Email: info.sci@horiba.com ORIBA ORIBA* www.certiprep.com The ULTIMA 2 ICP allows simple and rapid analysis using one single analytical method. The simple dilution made here helps to reduce matrix effects and to use a simple calibration in water, covering all the concentration ranges required. Some samples can be analyzed directly without dilution such as example sample 6, owing to the robustness of the plasma.
关闭-
1/7
-
2/7
还剩5页未读,是否继续阅读?
继续免费阅读全文产品配置单

HORIBA(中国)为您提供《与核潜艇运行有关的样品中K元素检测方案(ICP-AES)》,该方案主要用于船舶中K元素检测,参考标准《暂无》,《与核潜艇运行有关的样品中K元素检测方案(ICP-AES)》用到的仪器有HORIBA Ultima Expert高性能ICP光谱仪。
我要纠错
推荐专场
相关方案
 咨询
咨询