

方案详情文
智能文字提取功能测试中
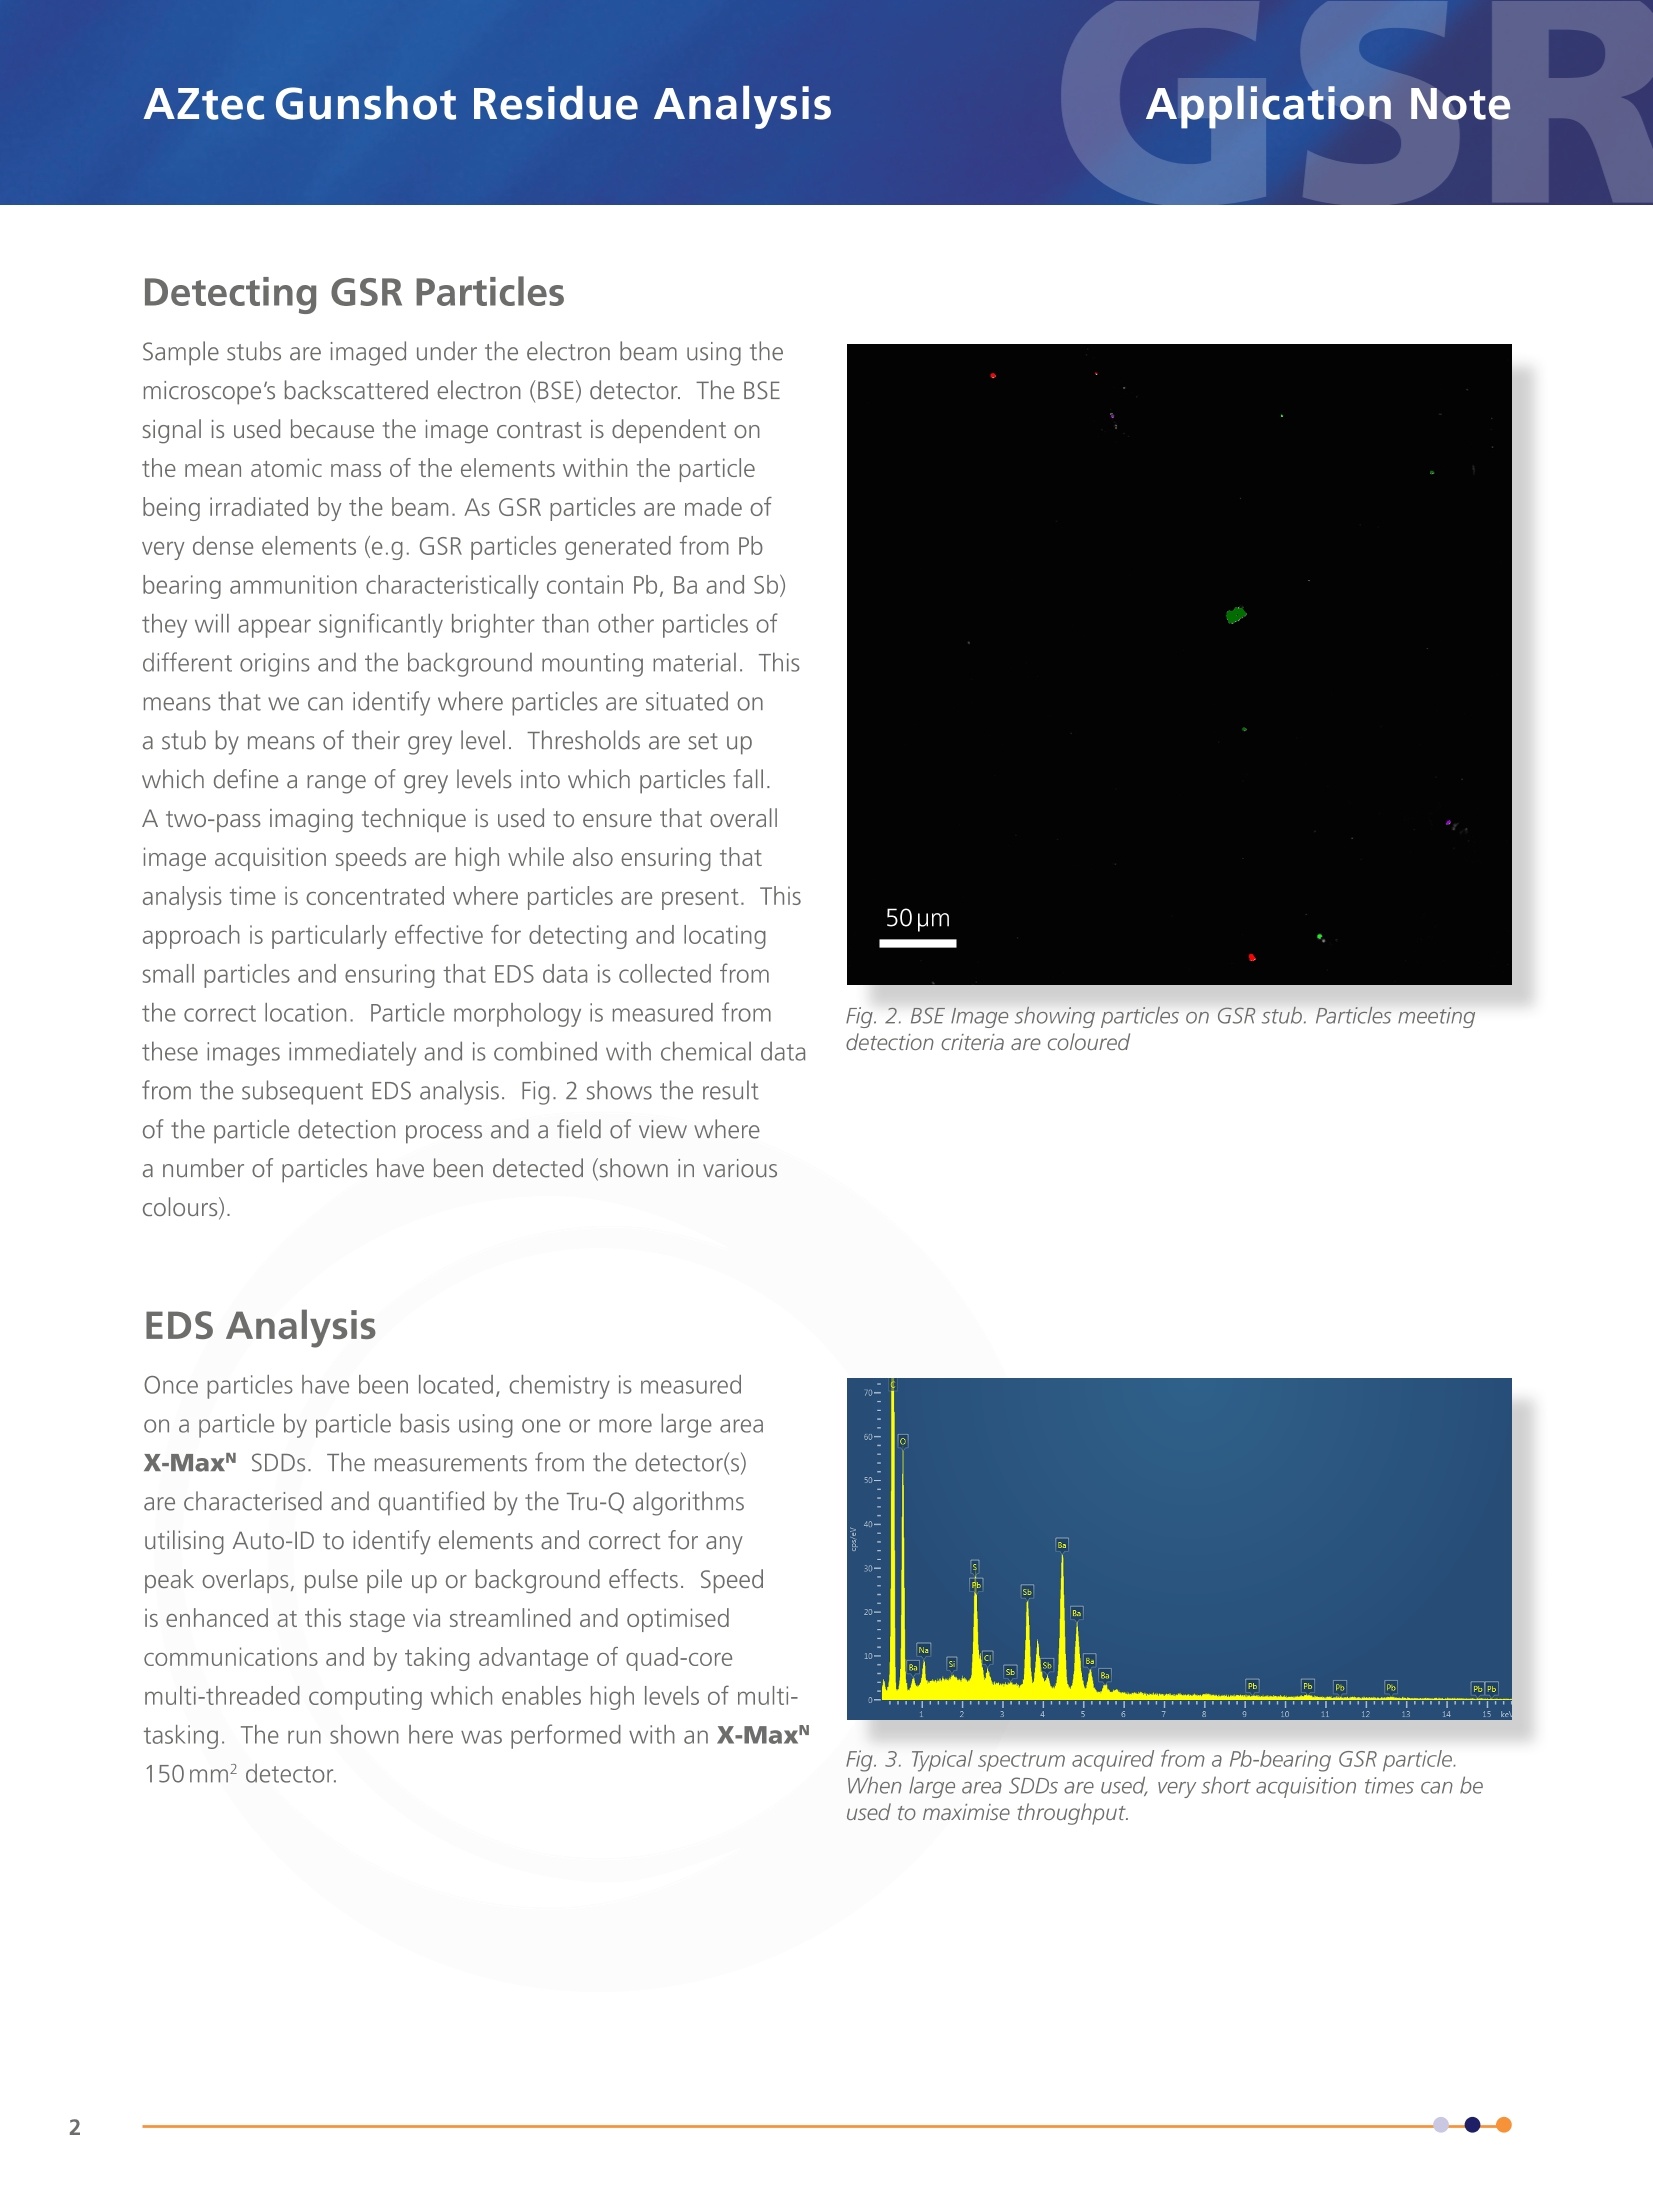
AZtecGunshot Residue AnalysisApplication Note Introduction Gunshot residue (GSR) is produced from the condensation of the vapour cloud which is generated fromthe primer and propellant when a bullet is fired from a gun. The condensing vapour from the primer willform particles which are typically spherical and range from potentially less than 0.5 pm up to significantlylarger sizes and of a characteristic composition depending on the type of ammunition. These particlesmay land on the hands and body of the shooter or other persons present when the gun was fired. Bycollecting and identifying these particles it is possible to associate a person with a crime scene where agun was used. SEM-based GSR analysis The scanning electron microscope(SEM) is a powerful tool for the imagingof small particles. By combining theSEM with an energy dispersive X-rayspectroscopy (EDS) system, chemicalinformation can additionally beobtained. Here, we discuss the use ofAZtecGSR, a dedicated implementationof the AZtecFeature particle analysissystem, for the analysis of a GSRsample. We make use of large areaX-MaxN silicon drift detectors (SDDs)which enable high resolution spectrato be acquired at high count rates. Byworking at high count rates less timecan be spent analysing each individual particle whilst maintaining the statistical certainty of the analysis (by having the same number of counts in spectra). All datameasured by the detector is processed with the AZtec Tru-QTM algorithms which, by having the same number of counts in eachspectrum, ensure that a quantification of the highest quality is achieved. The Business ofScience@ Detecting GSR Particles Sample stubs are imaged under the electron beam using themicroscope's backscattered electron (BSE) detector. The BSEsignal is used because the image contrast is dependent onthe mean atomic mass of the elements within the particlebeing irradiated by the beam. As GSR particles are made ofvery dense elements (e.g. GSR particles generated from Pbbearing ammunition characteristically contain Pb, Ba and Sb)they will appear significantly brighter than other particles ofdifferent origins and the background mounting material. Thismeans that we can identify where particles are situated ona stub by means of their grey level. Thresholds are set upwhich define a range of grey levels into which particles fall.A two-pass imaging technique is used to ensure that overallimage acquisition speeds are high while also ensuring thatanalysis time is concentrated where particles are present. Thisapproach is particularly effective for detecting and locatingsmall particles and ensuring that EDS data is collected fromthe correct location. Particle morphology is measured fromthese images immediately and is combined with chemical datafrom the subsequent EDS analysis. Fig. 2 shows the resultof the particle detection process and a field of view wherea number of particles have been detected (shown in variouscolours). EDS Analysis Once particles have been located, chemistry is measuredon a particle by particle basis using one or more large areaX-Max SDDs. The measurements from the detector(s)are characterised and quantified by the Tru-Q algorithmsutilising Auto-ID to identify elements and correct for anypeak overlaps, pulse pile up or background effects. Speedis enhanced at this stage via streamlined and optimisedcommunications and by taking advantage of quad-coremulti-threaded computing which enables high levels of multi-tasking. The run shown here was performed with an X-Max150mm²detector. Fig. 2. BSE Image showing particles on GSR stub. Particles meetingdetection criteria are coloured Fig. 3. Typical spectrum acquired from a Pb-bearing GSR particle.When large area SDDs are used, very short acquisition times can beused to maximise throughput. Classification As soon as EDS data is acquired, the quantified data is classified according to a choiceof dedicated, in-built schemes which have been written to meet both ASTM E1588-16and -17. These schemes include classifications for Pb-bearing and Pb-free ammunitions,and report results according to the recommended Characteristic/ Consistent/Environmental nomenclature. Users can modify a copy of the schemes to, for example,add new ammunition types. Fig.4. Classification of particles fromPb-bearing ammunition found in GSR sample. Characteristic 26 Sb Ba Pb 26 Sb Ba Pb Sn 0 Consistent Sb Ba Pb 131 Ba Si Ca 11 Ba Sb 47 Pb Sb 8 Ba Al 37 Pb Ba 0 Pb 14 Sb 14 Ba 0 Validation and Repeatability Repeatability between runs is ensured by performing an image calibration (with a supplied image calibration standard) duringeach analysis session. This calibration ensures that the correct microscope contrast/brightness are used each time and thereforethat the same grey level thresholds can be used each time and that the same number of particles are detected. Validationroutines are built into the software and include reports on the energy calibration of the detector, the beam current and thethresholding used. Live time (s) Processtime EnergyC Fig. 5. Report Templates used in AZtecGSR to validate the system. From left to right: Beam current checks -pre and post run with comparison,Threshold checks-grey level thresholds are listed along with number of particles found in threshold, Image calibration check - contrast andbrightness are set on a standard sample to specific values to ensure repeatability. Automated Large Area Runs The user is able to confirm the settings to be used on a single field of view before they are applied to every field of a large area.As such, an entire stub can be analysed with the results from each field combined into a single data set. Multiple areas for largearea analysis can be created, analysed and stored for future recall. The data shown in this application note was obtained from alarge area run over a total area in excess of 120mm² at a pixel resolution of 0.33 um in a time of approximately 140 minutes. Review and Reporting Data can be reviewed while a run is in progress, taking advantage of real timeanalysis and classification. Particles of particular interest can be marked for furtherreview or analysis. This feature is particularly useful as the ASTM standard stipulatesthat suspected GSR particles must be manually reviewed and confirmed by theoperator. AZtecFeature simplifies this process by including automated reacquisitionfunctionality which can re-visit particles, obtaining higher magnification/resolutionimages and longer duration spectra. Detailed batch reports can be generated fromthis data via a single click. Fig. 6. Details of a single reacquiredparticle characteristic of GSR. Fig. 7. Scatterplot showing distribution of particlescharacteristic and consistent with GSR. Ease of Use Users are guided through the analysis process by"StepNotes" which detail the workflow to be followed. These canbe customised according to specific user requirements. Allimage acquisition and EDS analysis settings are pre-set tooptimised values. All settings are stored and recalled eachtime an analysis is performed. The interface is designed to beintuitive, guiding the user through the task of analysis. Conclusion Here we have shown that AZtecGSR is a powerful tool for the analysis of samples containing potentialGSR particles. By utilising large area X-Max SDDs a high throughput can be achieved while, at thesame time, obtaining fully quantified compositional data. The use of a dedicated classification schemewith pre-optimised settings ensures that data meets the chosen ASTM E1588 standard. Ease of useenhancements ensure that setup time is reduced and that new operators can learn the system quickly.Full validation routines provide evidence that the system meets the performance requirements set out inthe standard. Dedicated reporting gives detailed results immediately after a run is completed. www.oxford-instruments.com/GSR The materials presented here are summary in nature, subject to change, and intended for generalinformation only. Performances are configuration dependent. Additional details are available. OxfordInstruments NanoAnalysis is certified to ISO 9001, ISO14001 and OHSAS 18001. AZtec is a RegisteredTrademarks of Oxford Instruments plc , all other trademarks acknowledged. @ Oxford Instruments plc, 2017.All rights reserved. OINAV/EDS/AN/AZtecGSR/1115. The Business of Science" Gunshot residue (GSR) is produced from the condensation of the vapour cloud which is generated fromthe primer and propellant when a bullet is fired from a gun. The condensing vapour from the primer willform particles which are typically spherical and range from potentially less than 0.5 μm up to significantlylarger sizes and of a characteristic composition depending on the type of ammunition. These particlesmay land on the hands and body of the shooter or other persons present when the gun was fired. Bycollecting and identifying these particles it is possible to associate a person with a crime scene where agun was used
关闭-
1/4

-
2/4
还剩2页未读,是否继续阅读?
继续免费阅读全文产品配置单
牛津仪器科技(上海)有限公司为您提供《枪击残留物中特征成分检测方案(EBSD系统)》,该方案主要用于刑侦中特征成分检测,参考标准《暂无》,《枪击残留物中特征成分检测方案(EBSD系统)》用到的仪器有牛津仪器C-Swift EBSD探测器、牛津仪器Ultim Extreme无窗超级能谱。
我要纠错
推荐专场
电子背散射衍射系统(EBSD)
更多
相关方案
 咨询
咨询