

方案详情文
智能文字提取功能测试中
Appendix A - Linearity data sets Appendix A (Part 2). Linearity data sets. thermoscientific APPLICATION NOTE 10586 Ultralow level quantificationof pesticides inbaby foods using an advanced triple quadrupoleGC-MS/MS system Authors Goal Richard Law, Aaron Lamb, PaulSilcock, and Cristian Cojocariu Thermo Fisher Scientific. Runcorn, UK The aim of the study was to assess the quantitative performance of theThermo ScientificTSQ9000 triple quadrupole GC-MS/MS system fittedwith the Advanced Electron lonization (AEI) source for the analysis of pesticideresidues at ultra low levels in baby food. Introduction KeywordsTSQ 9000, advanced electronionization, AEl, baby food,sensitivity, robustness, pesticideresidue, QuEChERS, triplequadrupole mass spectrometry,GC-MS/MS, ProgrammableTemperature Vaporization, foodsafety The detection and subsequent quantification of pesticides, contaminants,and other chemical residues are of paramount importance, especially whenthe food stuff is intended to be consumed by infants or young children.The maximum residue level (MRL) for the majority of pesticide-commoditycombinations is set at the default level of 10 pg/kg.1-3 However, the EuropeanUnion (EU) has established LOD MRLs between 3-8 pg/kg for specificpesticides prohibited in baby foods.4 These pesticides and their metabolitesmay cause infants and young children (under worst-case intake conditions)to exceed the acceptable daily intake (ADI) values. The high sensitivity andselectivity of GC-MS/MS enables the detection and identification of residuesof prohibited compounds, in compliance with the residue definitions, evenwhen dealing with the diverse composition of multi-ingredient baby foods. Also, the increased levels of selectivity and sensitivityprovided by triple quadrupole instruments compared tosingle quadrupole instruments enabled analysts to adoptfaster,less specific sample extraction procedures suchas QuEChERS (quick, easy, cheap effective, rugged andsafe). The QuEChERS procedure has become the standardapproach for sample preparation in many laboratoriesbecause of improvement in productivity.5The methodusually involves extraction with acetonitrile in thepresence of various salts followed by dispersive solidphase extraction (dSPE) clean-up with a combinationof PSA, C18, and carbon sorbents. The efficiency ofthe dSPE clean-up is limited so high concentrations ofmatrix-coextractives can remain in the final extract andcause system contamination. Also, use of acetonitrile(which has a high coefficient of expansion) limits theinjection volume and hence the sensitivity of the method. Taking all of these considerations together, it is evidentthat an ultra-sensitive, selective, reliable, and robustGC-MS/MS system is needed to address the challengeof routine high-throughput determination of pesticideresidues at trace concentrations in baby foods. In thisstudy, the quantitative performance of the ThermoScientificTSQ"9000 triple quadrupole GC-MS/MSsystem was assessed for the analysis of more than200 pesticides in baby food at ultra low concentrations(as low as 0.025 pg/kg). A complete evaluation of methodperformance included sample preparation, overallmethod suitability measured from pesticides recoveries,selectivity, sensitivity, linearity, and long-term robustness. Sample preparation Samples of carrot/potato and apple/pear/banana babyfood samples were extracted using the citrate-bufferedQuEChERS protocol using Thermo Scientific"HyperSep"dispersive solid phase extraction (dSPE) products. Homogenized sample (10 g) was extracted withacetonitrile (10 mL) followed by the addition of MgSO(4 g), NaCl (1.0 g), disodium hydrogen citratesesquihydrate (0.5 g), and trisodium citrate dihydrate(1.0 g). Dispersive solid phase extraction (dSPE) [MgSO(150 mg), PSA (25 mg) and GCB (25 mg) per 1 mL ofextract for carrot/potato and MgSO (150 mg) and PSA(25 mg) for apple/pear/banana] was used for sampleclean-up. Preparation of matrix-matched calibrations Immediately after dSPE clean-up, the final extracts(1 g sample/mL of acetonitrile) were acidified with 5%formic acid in acetonitrile and were spiked with a mixtureof 211 pesticides at 14 concentrations spanning a rangeof 0.025-250 pg/kg. Robustness was tested usingrepeat injections of samples (carrot/potato) spiked at the10 pg/kg level. For method evaluation, samples of carrot/potato andapple/pear/banana baby food samples were each spikedat 1.0, 2.5, and 10.0 pg/kg (n =6 for each concentration)before extraction, clean-up, and acidification were carriedout as described above. GC-MS/MS analysis A TSQ 9000 triple quadrupole GC-MS/MS systemequipped with a Thermo ScientificAdvanced Electronlonization (AEI) source and coupled with a ThermoScientificTRACE 1310 GC system was used. TheAEl source provides a highly efficient electron ionizationof analytes and a more tightly focused ion beam thatprovides an unparalleled level of sensitivity. Liquid injections of the sample extracts wereperformed using a Thermo ScientificTriPlus RSHMautosampler, and chromatographic separation wasachieved by a Thermo ScientificTraceGOLDMTG-5SilMS 30 m x0.25 mm l.D. ×0.25 pm film capillarycolumn with 5 m integrated SafeGuard. Additional detailsof instrument parameters are displayed in Table 1. Injection Volume (uL) 1 Liner Silteksix baffle PTV liner(P/N 453T2120) Inlet (°C) 70 Carrier Gas, (mL/min) He, 1.2 Inlet Mode Splitless (split flow 50 mL/min after 2 min) Column TraceGOLD TG-5SilMS with SafeGuard (30 mx0.25 mm, 0.25 umwith 5 m integrated guard column (P/N 26096-1425) PTV Parameters Rate (°C/s) Temp. (C) Time (min) Flow (mL/min) Injection 70 0.10 Transfer 5.0 300 2.00 Cleaning 14.5 320 5.00 75.0 Oven Temperature Program Ramp RT (min) Rate (C/min) Target Temp.(C) Hold Time (min) Initial 0 - 40 1.50 1 1.5 25.0 90 1.50 2 5.0 25.0 180 0.00 3 8.6 5.0 280 0.00 Final 28.6 10.0 300 5.00 Run time 35.6 - - - TSQ 9000 Mass Spectrometer Parameters Transfer Line (C) 250 lonization Type EI lon Source(C) 320 Acquisition Mode timed-SRM Tuning parameters AEI SmartTune Collision gas and pressure (psi) Argon at 70 Data processing Data were acquired, processed, and reported usingThermo Scientific"Chromeleon Chromatography DataSystem (CDS) software, which allows instrument control,method development, quantitative/qualitative analysis,and customizable reporting all within one package. Data review is highly customizable, allowing the user todisplay the information required on screen in real time.Furthermore, the flexibility of Chromeleon CDS softwareensures that SANTE compliance criteria can easily byflagged, tracked, and reported to the user's individualrequirements. Results and discussion.Compliance with EU SANTE criteria The method performance was tested in accordanceto the SANTE/11813/2017 guidance document, whichrequires that the following criteria are satisfied foridentification of pesticide residues: l. A minimum of two product ions are detected foreach pesticide with peak S/N >3 (or, in case noiseis absent, a signal should be present in at least fivesubsequent scans) and with the mass resolution forprecursor-ion isolation equal to or better than unitmass resolution. ll. Retention time tolerance of±0.1 minutes comparedwith standards in the same sequence. ml. Ion ratio within ± 30% (relative) of the average ofcalibration standards from the same sequence. Wherever SANTE compliance is referenced in this study,all three criteria have been met fully. Recoveries Pesticide recoveries were obtained from the QuEChERSextractions performed on the samples spiked beforeextraction. All detected compounds, at the three spikinglevels in both matrices satisfied all SANTE requirements.More than 97% of the target pesticide residues at1 pg/kg had recoveries between 70% and 120%. Anexample of the recovery and precision data for theapple/pear/banana matrix spiked at the default MRL(10 pg/kg) is displayed in Figure 1. A full table of resultscan be found in Appendix B. Chromatography and selectivity Analysis of a large number of pesticides in a singleinjection requires careful optimization of parameters,especially when injecting acetonitrile. As acetonitrileis a low molecular weight low polarity solvent, it has arelatively high expansion volume and is insoluble in thelow polarity phases normally used for routine pesticideanalysis (this makes solvent focusing in a standardsplitless type injection incredibly difficult). These issuescan be addressed by using an optimized programmabletemperature vaporisation (PTV) injection. Figure 2 showsan example of three pesticides eluting in the beginning(A-dichlobenil -0.025 pg/kg), middle (B-dieldrin0.5 pg/kg), and end (C-deltamethrin 0.05 pg/kg) of thechromatographic run in the lowest detectable standard incarrot and potato matrix, levels at which all compoundsdetected meet the SANTE requirements. Peak shapeswere Gaussian and coefficient of determination (R2)was >0.990 for all three compounds indicating goodchromatography and excellent linear response Identification of all 210 component peaks was madeusing an in-house, commercially available ThermoScientific SRM pesticide compound database (cdb).In addition to this, retention time alignment of targetcompounds can be easily performed using the ThermoScientific RTA tool,8 eliminating the need for manualcorrection of compound retention times whenevercolumn maintenance is performed. The cdb databasecontains >1000 compounds with >3700 unique SRMtransitions. Due to the fast scanning speed of theEvoCell technology and the intelligent scheduling of thetimed-SRM, it is possible to acquire data with severaltransitions per compound with minimal loss in sensitivity.This makes it simple to select the most optimaltransitions in differing matrices to perform quantitationand qualification on, removing the need to developmatrix-matched SRM compound databases (Figure 3). 120.0% Figure 1. Recovery and precision data for apple/pear/banana extractions (n=6) at a concentration of 10 pg/kg.+ Endrin aldehyde recoverieswere low, potentially due to reaction with PSA. S Recoveries of chlorothalonil, known to be problematic in QuEChERS extractions,were low. A B C Figure 2. Example (A-Dichlobenil, B -dieldrin and C- deltamethrin) chromatographic peaks showing the lowest detectable matrixmatched standard which meets SANTE requirements. The MRLs are 10 pg/kg,3 pg/kg* and 10 pg/kg respectively. Calibration curves showduplicate injection at 14 discrete levels ranging from 0.025 pg to 250 pg on column. *Dieldrin is classed as a prohibited pesticide and 3 pg/kgconsidered to be the current limit of quantification, but is subject to regular review.4 Figure 3. Comparison of Metazachlor SRM chromatographic peaks acquired using an injection containing 1317 unique transitions(left, 8 transitions) and an injection containing 663 (right, 3transitions). No significant difference in the peak area for quantitation transitionis observed indicating no loss in sensitivity. Sensitivity and linearity The TSQ 9000 AEl system easily met SANTEcriteria (ion ratios ±30%, etc.) at the default MRL of10 pg/kg for all pesticides targeted. Moreover, over 90%of pesticides detected at <0.5 pg/kg meet the SANTErequirements and 10% of them meet SANTE criteria evenat 0.025 pg/kg level (Figure 4). Resolution settings of0.7 Daltons for Q1 and Q3 were used, ensuring theoptimum combination of selectivity and sensitivity. Figure 4. Number of target compounds satisfying the SANTErequirements, with over 90% below 0.5 pg/kg, and over 60% below0.1pg/kg- 100 times lower than the default MRL [sample matrix-carrot/potato]. Over 90% of the target compounds had a Limit ofIdentification (LOI) (satisfying all SANTE requirements)below 0.5 pg/kg, and over 60% below 0.1 pg/kg. System sensitivity, defined as instrumental detectionlimits (IDLs), was determined experimentally for eachcompound by performing n=10 replicate injections of thelowest matrix-matched standard of carrot and potatothat met all SANTE criteria. Calculations of IDLs werethen made using one-tailed student t-test at the 99%confidence interval for the corresponding degrees offreedom and taking into account the concentration andabsolute peak area %RSD for each compound (Figures 5and 6). Figure 5. Example quantification SRM overlays of cadusafos andchlorbenzilate injected at the lowest level that met all SANTEcriteria. Annotated are on column concentration, %RSD derived fromabsolute peak area response and calculated IDLs. Fipronil and fipronil-desulfinyl, expressed as fipronil, havea multi-component MRL specified at 4 pg/kg. Therefore,to satisfy the current regulations, each component mustbe identified at 2 pg/kg. Figure 7 shows fipronil andfipronil-desulfinyl at concentrations of 0.2 pg/kg, tentimes lower than the requisite MRL, with back-calculatedconcentrations versus the linear calibration annotated. Compound linearity was assessed by injecting matrixmatched standards in the range of 0.025 to 250 pg/kg in duplicate for both carrot/potato and apple/pear/banana. Both sets of linearity data showed R²>0.990and response factor (RF) % RSDs of <20% for over 96%of component peaks indicating excellent linear response.Examples of linearity are shown in Figure 2 and in acomprehensive table provided in Appendix A. 161 159 157 155 153 151 149 147 145 143 Figure 6. Plot showing the calculated IDLs for all pesticides. IDLs ranged from~5 fg (chlorobenzilate) to ~2.0 pg (bioallethrin) with >95% ofcompounds showing an IDL of less than 500 fg on column (equivalent to 0.5 pg/kg in sample extract). See Appendix A for tabulated data. 1.804-1584-1.424-12e4-1.024-8.093-6.03-4023-2083-0.080- Fipronil desulfinyl -2084 -1324 -1.524 F1.424-1284-1024-803-5083-4023-2.023 F0080 16.400 14.080 Figure 7.Fipronil and fiproni desulfinyl, at a concentration of 0.2 pg/kg equating to 0.4 pg/kg fipronil (sum), with SANTEcompliance throughout. AEl source robustness The TSQ 9000 AEl system was set up as described inTable 1. After an initial source cleaning, repeat injectionsof a QuEChERS sample extract (1 g/mL carrot andpotato) spiked at the default MRL (10pg/kg) weremade (Figure 8). Extracts resulting from the QuEChERSmethodology contain many undesirable matrixco-extracted components which can easily contaminatethe GC inlet, the chromatographic column and the MSion source. To test the robustness of the AEl ion source only (as far as reasonably practicable), after every100 sample injections, the PTV liner was replaced alongwith the injector septum, approximately 10 cm wastrimmed from the head of the guard column followedby automatic tuning of the system using the SmartTunefeature. SmartTune uses the MS parameters establishedduring the initial tuning on a clean source and intelligentlyassess the performance of the system,only re-tuningwhen MS performance has been compromised. Noadditional maintenance was performed. Injection Number Figure 8A. Example of normalised peak area response for selected compounds across~400 consecutive injections at the default MRL (10ug/kg) in carrot/potato matrix. Qual 1:80.8% Dicofol Qual 1: 24.5% .226 22.400 Dicofol Qual 1: 26.7% Figure 8B. Peak shapes, intensities and ion ratios of the primary qualifier ion for injection 1 (top row) and injection 395 (bottom row) forcaptan, iprodione, dicofol and deltamethrin. lon ratios at the default MRL were stable, Figure 9 showspretilachlor ion qualifier ratios 1 and 2 in the first and lastbatches of injections. Ratios were well within the ±30%SANTE identification criteria. Pretilachlor MSQuantitation 36 Qual 1 IR % Qual 2 IR +3003 DcTarget Ratio一刀 2-30%1侣 340% 32 +30% 30 28 26 ........ Target Ratio 24 22 20 18 16 141 8 8 8 8 5卜 8 Injections Figure 9. Pretilachlor lon ratios of robustness injections 1-95 (top) and 295-395 (bottom). Conclusions In this work it has been demonstrated that by usingQuEChERS with Thermo Scientific HyperSep dSPEproducts and a direct injection of acetonitrile extracts, theTSQ 9000 AEl system delivers outstanding quantitativeperformance for low-level pesticide residue analysis inbaby food. ·QuEChERS extraction and subsequent clean-up ofover 200 pesticides from replicate analysis (n=6 each atthree concentrations) of each of two sample matrices,demonstrating excellent accuracy (recovery) andprecision. .·Accurate, quantitative analysis of over 200 pesticidesover up to five orders of magnitude (0.025-250 pg/kg),showing outstanding LODs and linear response. ·Robustness displayed over approximately 400consecutive injections of sample matrix (1 g/mL), withSANTE compliance at the default MRL throughout. · High sensitivity providing the real possibility to dilutethe sample extract, thus limiting matrix contaminationand system maintenance, leading to an increase inlaboratory productivity. The results of this study establish the TSQ 9000 triplequadrupole GC-MS/MS system, in combination withChromeleon CDS software and HyperSep dSPEproducts, as the ideal solution for the routine analysisof pesticides in baby food, providing unprecedentedsensitivity, robustness, ease of use, cost effectiveness,and reliability. References 1. https://ec.europa.eu/food/plant/pesticides/max_residue_levels/guidelines_en2. http://eur-lex.europa.eu/legal-content/EN/TXT/?uri=URISERV:I13002a 3.SANTE/11813/2017.Guidance document on analytical quality control and methodvalidation procedures for pesticides residues analysis in food and feed. SupersedesSANTE/11945/2015.Implemented by 01/01/2018. https://ec.europa.eu/food/sites/food/files/plant/docs/pesticides_mrl_guidelines_wrkdoc_2017-11813.pdf 4. http://eur-lex.europa.eu/legal-content/EN/ALL/?uri=CELEX%3A32006L0125 5. http://quechers.cvua-stuttgart.de/ ( 6 . h tt ps://www. n cbi . nlm . ni h.g ov / pmc/a r t icles/P M C 4 890451 / ) 7. Belmonte Valles, N.; Retamal, M.; Martinez-Uroz, M.A.; Mezcua, M.; Fernandez-Al-ba, A.R.; de Kok, A. Determination of chlorothalonil in difficult-to-analyse vegetablematrices using various multiresidue methods. Analyst,2012,137(10),2513-2520 8. https://assets.thermofisher.com/TFS-Assets/CMD/Application-Notes/an-10580-gc-ms-ms-ptv-pesticides-water-an10580-en.pdf 9. http://tools.thermofisher.com/content/sfs/posters/PN-10394-Fast-SRM-Transition-PN10394-EN.pdf Appendix A (Part 1). Linearity data sets. Chart Number Apple/Pear/Banana Linearity Carrot/Potato Linearity IDL99 Compound Name RF Range RF Range pg on IDL R2 R2 RSD(%) (ppb) RSD(%) (ppb) Column (fg) 1 2,3,5,6-Tetrachloroaniline 0.99931 6.80 0.1-250 0.99955 7.70 0.05-250 0.05 20 2 2,4'-Methoxychlor 0.99987 3.50 0.1-250 0.99950 7.30 0.025-250 0.05 8 3 4,4'-Methoxychlor olefin 0.99976 5.80 0.1-250 0.99932 4.20 0.05-250 0.05 31 4 Acetochlor 0.99972 3.60 0.2-250 0.99962 3.60 0.2-250 0.20 201 5 Acrinathrin 0.99963 2.70 0.2-250 0.99955 3.90 0.2-250 0.20 57 6 Alachlor 0.99965 5.50 0.1-250 0.99955 5.10 0.2-250 0.20 71 7 Aldrin 0.99959 8.00 0.1-250 0.99983 4.60 0.1-250 0.20 75 8 Allethrin (Bioallethrin) 0.99826 19.40 10-250 0.99888 7.50 5-250 5.00 2007 9 Allidochlor 0.99926 15.20 0.1-250 0.99631 6.30 0.2-250 0.20 145 10 Anthraquinone 0.99966 9.80 0.2-250 0.99988 17.60 0.025-250 0.05 27 11 Atrazine 0.99963 7.40 0.1-250 0.99990 6.70 0.05-250 0.05 19 12 Azinphos-ethyl 0.99465 9.40 0.2-250 0.99935 4.50 0.2-250 0.20 82 13 Azinphos-methyl 0.98165 16.90 1-250 0.99758 19.60 0.5-250 1.00 521 14 BHC, Alpha 0.99981 5.30 0.025-250 0.99949 6.60 0.025-250 0.05 15 15 BHC, Beta 0.99967 6.20 0.05-250 0.99985 8.80 0.025-250 0.05 15 16 BHC, delta 0.99971 4.10 0.05-250 0.99992 7.60 0.025-250 0.05 20 17 BHC, gamma 0.99970 7.30 0.05-250 0.99971 6.70 0.05-250 0.05 31 18 Bifenthrin 0.99989 4.20 0.5-250 0.99976 2.40 0.5-250 1.00 42 19 Biphenyl 0.99822 19.50 2-250 0.99573 14.50 5-250 5.00 865 20 Bromfenvinphos 0.99963 5.10 0.05-250 0.99960 7.60 0.025-250 0.05 31 21 Bromfenvinphos-methyl 0.99917 3.20 0.5-250 0.99971 3.60 0.1-250 0.20 33 22 Bromophos-ethyl 0.99946 3.30 0.1-250 0.99523 5.90 0.05-250 0.05 12 23 Bromophos-methyl (Bromophos) 0.99957 5.60 0.05-250 0.99848 5.90 0.05-250 0.05 24 24 Bromopropylate 0.99960 4.80 0.1-250 Chart Number Apple/Pear/Banana Linearity Carrot/Potato Linearity IDL99 Compound Name RF Range RF Range pg on IDL R2 RSD(%) (ppb) R2 RSD(%) (ppb) Column (fg) 41 Chlorpyrifos-methyl 0.99969 12.30 0.1-250 0.99960 15.70 0.025-250 0.05 24 42 Chlorthal-dimethyl 0.99917 6.20 0.1-250 0.99912 5.80 0.025-250 0.05 20 43 Chlorthiophos 0.99976 7.20 0.1-250 0.99971 3.00 0.2-250 0.20 153 44 Chlozolinate 0.99981 7.90 0.2-250 0.99988 4.30 0.2-250 0.20 67 45 Clomazone 0.99983 4.30 0.025-250 0.99993 6.40 0.025-250 0.05 12 46 Coumaphos 0.99817 4.80 0.5-250 0.99966 8.50 0.2-250 0.20 78 47 Cycloate 0.99815 13.10 2-250 0.99890 4.80 2-250 5.00 789 48 CyhalothrinI (lambda) 0.99966 7.50 0.2-250 0.99959 2.90 0.2-250 0.20 28 49 Cyprodinil 0.99983 5.00 0.1-250 0.99993 3.90 0.1-250 0.20 86 50 DDD p,p 0.99985 4.30 0.05-250 0.99992 4.00 0.025-250 0.05 22 51 DDD, o, p 0.99988 3.00 0.05-250 0.99985 7.50 0.05-250 0.05 20 52 DDE o,p 0.99974 3.80 0.025-250 0.99976 4.30 0.025-250 0.05 8 53 DDE p, p 0.99957 2.60 0.05-250 0.99989 4.20 0.05-250 0.05 9 54 DDT o,p 0.99988 5.70 0.05-250 0.99960 9.20 0.05-250 0.05 25 55 DDT p,p 0.99962 8.40 0.2-250 0.99937 14.40 0.1-250 0.20 41 56 Deltamethrin 0.99983 6.70 0.05-250 0.99646 11.00 0.05-250 0.05 22 57 Diazinon 0.99949 5.20 0.1-250 0.99906 5.00 0.1-250 0.20 33 58 Dichlobenil 0.99866 5.10 0.025-250 0.99724 10.20 0.025-250 0.05 5 59 Dichlofluanid 0.99949 6.40 0.2-250 0.99966 4.40 0.1-250 0.20 28 60 Dichlorobenzophenone, 4, 4* 0.99979 2.80 0.05-250 0.99957 7.50 0.025-250 0.05 17 61 Dicloran (Bortran) 0.99908 7.10 0.2-250 0.99801 7.00 0.2-250 0.20 58 62 Dicofol* 0.99272 13.50 0.5-250 0.98598 14.70 0.5-250 1.00 973 63 Dieldrin 0.99909 7.20 0.5-250 0.99958 4.60 0.5-250 1.00 162 64 Dimethachlor 0.99964 5.10 0.025-250 0.99968 *-4,4-dichlorobenzophenone is a breakdown product of dicofol and therefore may be overestimated. Chart Number Apple/Pear/Banana Linearity Carrot/Potato Linearity IDL99 Compound Name RF Range RF Range pg on IDL R2 R2 RSD(%) (ppb) RSD(%) (ppb) Column (fg) 81 Etridiazole (Terrazole) 0.99954 5.50 0.1-250 0.99599 16.30 0.025-250 0.05 18 82 Fenamiphos 0.99958 3.00 0.5-250 0.99848 3.70 0.5-250 1.00 147 83 Fenarimol 0.99984 3.20 0.2-250 0.99990 2.60 0.2-250 0.20 45 84 Fenchlorfos 0.99964 3.90 0.05-250 0.99956 4.80 0.05-250 0.05 17 85 Fenitrothion 0.99241 13.50 0.1-250 0.99559 13.30 0.1-250 0.20 52 86 Fenpropathrin 0.99969 3.70 0.5-250 0.99976 5.00 1-250 1.00 147 87 Fenson 0.99989 4.40 0.05-250 0.99995 5.60 0.025-250 0.05 11 88 Fenthion 0.99959 10.20 0.05-250 0.99970 10.60 0.05-250 0.05 18 89 Fenvalerate 0.99992 3.10 0.1-250 0.99974 5.80 0.1-250 0.20 36 90 Fipronil 0.99923 5.10 0.1-250 0.99405 8.90 0.05-250 0.05 20 91 Fipronil desulfinyl 0.99826 5.60 0.05-250 0.98489 10.00 0.05-250 0.05 27 92 Fluazifop-P-butyl 0.99971 7.40 0.1-250 0.99976 10.50 0.1-250 0.20 45 93 Fludioxonil 0.99980 9.90 0.05-250 0.99951 8.00 0.025-250 0.05 29 94 Fluquinconazole 0.99953 7.70 0.05-250 0.99609 7.40 0.025-250 0.05 15 95 Fluridone 0.99890 13.60 0.2-250 0.99593 7.10 0.025-250 0.05 22 96 Flusilazole 0.99969 11.20 0.1-250 0.99982 9.00 0.1-250 0.20 66 97 Flutolanil 0.99966 5.80 0.05-250 0.99982 9.30 0.025-250 0.05 51 98 Flutriafol 0.99960 7.20 0.1-250 0.99989 9.50 0.025-250 0.05 24 99 Folpet 0.97866 23.90 0.5-250 0.98874 14.20 0.2-250 0.20 757 100 Fonofos 0.99970 4.80 0.05-250 0.99986 4.20 0.05-250 0.05 14 101 Heptachlor 0.99963 4.20 0.025-250 0.99976 6.40 0.025-250 0.05 7 102 Hexachlorobenzene 0.99862 7.80 0.025-250 0.99939 5.60 0.025-250 0.05 11 103 Hexazinone 0.99971 7.20 0.1-250 0.99983 5.50 0.05-250 0.05 18 104 lodofenfos 0.99859 6.10 0.05-250 0.99012 Chart Number Apple/Pear/Banana Linearity Carrot/Potato Linearity IDL9 Compound Name RF Range RF Range pg on IDL R2 R2 RSD(%) (ppb) RSD(%) (ppb) Column (fg) 121 Myclobutanil 0.99978 1.90 0.1-250 0.99986 3.50 0.1-250 0.20 40 122 N-(2,4-Dimethylphenyl) formamide 0.99953 4.80 1-250 0.99982 8.30 1-250 1.00 106 123 NDBA 0.99866 18.00 0.5-250 0.99414 21.60 0.05-250 0.05 12 124 NDEA 0.99826 6.90 0.1-250 0.98989 9.80 0.2-250 0.20 74 125 NDPA 0.99865 8.70 0.5-250 0.99133 8.80 0.1-250 0.20 49 126 NEMA 0.99657 8.00 1-250 0.98500 12.80 0.2-250 0.20 87 127 Nitrofen 0.99590 13.50 0.05-250 0.99512 15.00 0.2-250 0.20 30 128 N-Nitrosodiphenylamine 0.99971 12.70 0.2-250 0.99931 17.00 0.1-250 0.20 28 129 N-Nitrosomorpholine 0.99759 18.50 0.5-250 0.99342 20.00 0.5-250 1.00 198 130 N-Nitrosopiperidine 0.99738 7.90 0.5-250 0.99368 14.20 0.5-250 1.00 217 131 N-Nitrosopyrrolidine 0.99830 14.70 1-250 0.99359 8.00 0.5-250 1.00 289 132 Nonachlor-cis 0.99591 7.20 0.2-250 0.97664 11.80 0.1-250 0.20 90 133 Nonachlor-trans 0.99924 4.70 0.1-250 0.99968 6.70 0.1-250 0.20 28 134 Norflurazon 0.99886 7.60 0.2-250 0.99937 5.10 0.05-250 0.05 23 135 Ortho-phenylphenol 0.99979 20.20 0.5-250 0.99957 14.70 0.5-250 1.00 102 136 Oxadiazon 0.99964 5.80 0.025-250 0.99970 14.10 0.1-250 0.20 22 137 Oxyfluorfen 0.99610 9.30 0.5-250 0.99445 18.80 0.5-250 1.00 73 138 Paclobutrazol 0.99977 5.40 0.05-250 0.99991 6.70 0.05-250 0.05 49 139 Parathion (ethyl) 0.99534 11.00 0.5-250 0.99395 19.40 0.5-250 1.00 158 140 Parathion-methyl 0.99478 12.00 0.05-250 0.99736 8.20 0.2-250 0.20 111 141 Pebulate 0.99885 14.30 0.5-250 0.99691 13.30 0.5-250 1.00 171 142 Penconazole 0.99985 6.30 0.05-250 0.99992 7.90 0.05-250 0.05 37 143 Pentachloroaniline 0.99973 6.10 0.1-250 0.99961 4.60 0.05-250 0.05 52 144 Pentachloroanisole 0.99939 5.30 0.05-250 Chart Number Apple/Pear/Banana Linearity Carrot/Potato Linearity IDL99 Compound Name RF Range RF Range pg on IDL R2 B2 RSD(%) (ppb) RSD(%) (ppb) Column (fg) 161 Profenofos 0.99938 9.40 0.1-250 0.99654 10.40 0.1-250 0.20 53 162 Propachlor 0.99977 1.60 1-250 0.99926 15.30 0.025-250 0.05 13 163 Propanil 0.99925 12.30 0.025-250 0.99974 3.70 0.1-250 0.20 32 164 Propargite 0.99970 3.30 2-250 0.99881 19.40 2-250 5.00 1143 165 Propisochlor 0.99972 21.10 0.2-250 0.99953 5.80 0.5-250 1.00 284 166 Propyzamide 0.99966 4.50 0.1-250 0.99985 4.20 0.025-250 0.05 15 167 Prothiofos 0.99881 10.50 0.1-250 0.99842 5.90 0.1-250 0.20 28 168 Pyraclofos 0.99656 15.00 0.1-250 0.99920 20.60 0.05-250 0.05 28 169 Pyrazophos 0.99911 13.30 0.5-250 0.99979 16.60 0.2-250 0.20 163 170 Pyridaben 0.99987 3.10 0.2-250 0.99988 2.50 0.2-250 0.20 186 171 Pyridaphenthion 0.99941 3.80 0.2-250 0.99699 8.90 0.1-250 0.20 24 172 Pyrimethanil 0.99985 19.10 0.1-250 0.99971 8.40 0.05-250 0.05 23 173 Pyriproxyfen 0.99979 9.20 0.1-250 0.99990 2.30 0.2-250 0.20 24 174 Quinalphos 0.99926 10.80 0.5-250 0.99925 4.60 0.5-250 1.00 88 175 Quintozene 0.99912 10.20 0.2-250 0.99774 15.00 0.2-250 0.20 72 176 Sulfotep 0.99970 9.80 0.025-250 0.99962 9.40 0.025-250 0.05 26 177 Sulprofos 0.99986 3.30 0.05-250 0.99850 5.20 0.025-250 0.05 12 178 Tebuconazole 0.99983 9.10 0.5-250 0.99994 4.70 0.025-250 0.05 30 179 Tebufenpyrad 0.99980 4.20 0.05-250 0.99976 4.10 0.05-250 0.05 37 180 lecnazene 0.99958 8.90 0.05-250 0.99815 13.90 0.025-250 0.05 15 181 Tefluthrin 0.99982 12.50 0.025-250 0.99944 6.60 0.025-250 0.05 34 182 Terbacil 0.99929 7.30 0.2-250 0.99974 5.40 0.1-250 0.20 95 183 Terbufos 0.99973 4.90 0.1-250 0.99978 5.00 0.05-250 0.05 13 184 Terbuthylazine 0.99967 8.60 0.2-250 0.99982 Appendix A (Part 6). Linearity data sets. Chart Number Apple/Pear/Banana Linearity Carrot/Potato Linearity IDL99 Compound Name RF Range RF Range pg on IDL R2 R2 RSD(%) (ppb) RSD(%) (ppb) Column (fg) 201 Cyfluthrin peaks I-IV N/A N/A 0.5-250 N/A N/A 0.5-250 1.00 91 N/A Tetramethrin peak 1 0.99965 14.70 N/A 0.99968 16.50 N/A N/A N/A N/A Tetramethrin peak 2 0.99974 18.80 N/A 0.99984 20.80 N/A N/A N/A N/A Resmethrin peak 1 0.99950 13.60 N/A 0.99976 19.70 N/A N/A N/A N/A Resmethrin peak 2 0.99983 6.60 N/A 0.99967 10.50 N/A N/A N/A N/A Fluvalinate peak 1 0.99946 6.90 N/A 0.99936 5.50 N/A N/A N/A N/A Fluvalinate peak 2 0.99933 10.20 N/A 0.99886 4.40 N/A N/A N/A N/A Cypermethrin peak 1 0.99971 4.30 N/A 0.99989 13.40 N/A N/A N/A N/A Cypermethrin peak 2 0.99987 2.40 N/A 0.99988 5.10 N/A N/A N/A N/A Cypermethrin peak 3 0.99982 2.80 N/A 0.99975 3.10 N/A N/A N/A N/A Cypermethrin peak 4 0.99981 2.70 N/A 0.99991 2.90 N/A N/A N/A N/A Cyfluthrin peak 1 0.99967 2.50 N/A 0.99988 3.90 N/A N/A N/A N/A Cyfluthrin peak 2 0.99905 4.40 N/A 0.99972 3.00 N/A N/A N/A N/A Cyfluthrin peak 3 0.99837 10.70 N/A 0.99979 3.30 N/A N/A N/A N/A Cyfluthrin peak 4 0.99723 8.10 N/A 0.99981 10.50 N/A N/A N/A Appendix B (Part 1). QuEChERS Recovery data. Component Name Carrot 1 pg/kg (n=6) Apple 1 pg/kg (n=6) Carrot 2.5 pg/kg (n=6) Apple 2.5 pg/kg (n=3) Carrot 10 pg/kg (n=6) Apple 10 pg/kg (n=6) MeanRecovery PrecisionRSD(%) Mean Recovery Precision RSD(%) Mean Recovery Precision RSD(%) MeanRecovery PrecisionRSD(%) MeanRecovery PrecisionRSD(%) MeanRecovery Precision RSD(%) 2,3,5,6-Tetrachloroaniline 100.9% 6.2% 97.8% 10.2% 94.7% 5.1% 99.2% 3.4% 87.6% 3.4% 99.4% 5.5% 2,4'-Methoxychlor 98.1% 0.9% 98.4% 1.2% 96.4% 1.0% 98.1% 1.2% 100.1% 1.2% 97.5% 1.1% 4,4'-Methoxychlor olefin 99.9% 2.8% 106.7% 3.5% 98.8% 2.6% 99.4% 1.6% 101.0% 1.1% 100.2% 1.6% Acetochlor 89.9% 8.2% 90.9% 9.1% 79.1% 8.4% 110.5% 3.4% 97.0% 2.2% 98.2% 3.1% Acrinathrin 96.5% 4.2% 92.3% 4.5% 112.3% 3.2% 96.4% 4.4% 109.2% 2.0% 97.4% 4.2% Alachlor 107.8% 6.8% 97.5% 3.4% 96.9% 2.4% 102.0% 1.4% 100.9% 1.7% 97.2% 2.0% Aldrin 109.8% 7.7% 105.3% 7.6% 93.5% 2.4% 107.7% 2.0% 98.7% 1.6% 100.4% 2.8% Allethrin (Bioallethrin)
-
1/22
-
2/22
还剩20页未读,是否继续阅读?
继续免费阅读全文产品配置单
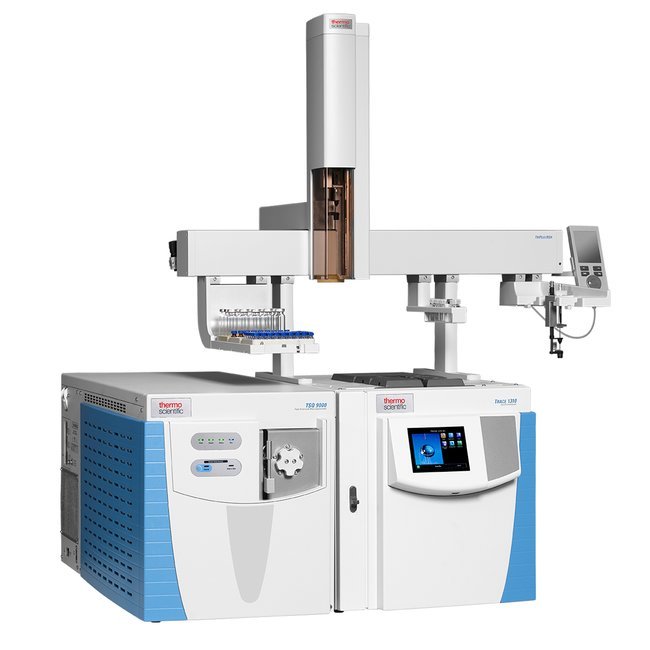
赛默飞色谱与质谱为您提供《婴儿食品中超低浓度农药检测方案(气质联用仪)》,该方案主要用于婴幼儿配方乳粉中农药残留检测,参考标准《暂无》,《婴儿食品中超低浓度农药检测方案(气质联用仪)》用到的仪器有赛默飞TSQ™ 9000三重四极杆GC-MS。
我要纠错
推荐专场
相关方案
 咨询
咨询