

方案详情文
智能文字提取功能测试中
View Article OnlineView JournalCheck for updates8 Journal of Analytical Atomic SpectrometryPage 1 of 30View Article OnlineDOI: 10.1039/C7JA00190H JAAS Accepted Manuscript This article can be cited before page numbers have been issued, to do this please use:T. Luo,Q. Ni, Z.hu, W. Zhang, Q. Shi, D. Gunther, Y. liu, K. Zong and S. H. Hu, J. Anal. At. Spectrom., 2017, DOl:10.1039/C7JA00190H. This is an Accepted Manuscript, which has been through theRoyal Society of Chemistry peer review process and has beenaccepted for publication. Accepted Manuscripts are published online shortly afteracceptance, before technical editing, formatting and proof reading.Using this free service, authors can make their results availableto the community, in citable form, before we publish the editedarticle. We will replace this Accepted Manuscript with the editedand formatted Advance Article as soon as it is available. You can find more information about Accepted Manuscripts in theauthor quidelines. Please note that technical editing may introduce minor changesto the text and/or graphics, which may alter content. The journal'sstandard Terms 8 Conditions and the ethical guidelines, outlinedin our author and reviewer resource centre, still apply. In noevent shall the Royal Society of Chemistry be held responsiblefor any errors or omissions in this Accepted Manuscript or anyconsequences arising from the use of any information it contains. rsc.li/jaas 1 2 3 Comparison of signal intensities and elementalfractionation in 257 nm femtosecond LA-ICP-MSusing He and Ar as carrier gas 4 Tao Luo,Qian Ni, Zhaochu Hu, * Wen Zhang, Quanhui Shi,Detlef Ginther,*aD 5 Yongsheng Liu, Keqing Zong, and Shenghong Hu' 6 7 "State Key Laboratory of Geological Processes and Mineral Resources, China 8 University of Geosciences, Wuhan, 430074, PR China (*E-mail: zchu@vip.sina.com) 9 ETH Zurich, Laboratory for Inorganic Chemistry, CH-8093 Zurich, Switzerland 10 (*E-mail: guenther@inorg.chem.ethz.ch) 11 12 13 14 15 16 * Corresponding author: zchu@vip.sina.com;guenther@inorg.chem.ethz.ch 17 18 19 20 21 Submitted to Journal ofAnalytical Atomic Spectrometry 22 23 Content entry 24 The He-Ar mixture is more suitable as aerosol carrier gas than using pure He or Ar for25 femtosecond LA-ICP-MS analysis. NIST 610 -carrier gas: He-carrier gas: He +Ar -◆-carrier gas: Ar LLLLL Elements 26 27 28 29 30 31 Abstract 32 The signal intensities and elemental fractionation at different ambient gas conditions 33 (He, Ar and pre-mixed He-Ar mixture) were investigated using 257 nm femtosecond 34 (fs)-LA-ICP-MS. The experiments show that the change ofablation carrier gases from 35 argon to helium increases the sensitivities of refractory elements (e.g. rare earth 36 elements) in NIST SRM 610 by a factor of 1.05-1.20. Whereas, the signal intensities 37 ofvolatile elements (e.g. Tl, Cd,Se, Sn, Te, Zn, Pb, Bi, Ge, Ga, Sb, Ag, Cu) were 38 increased by a factor of 1.5-3.0. The much less deposited aerosol particles around the 39 ablation craters produced in helium when compared to argon may partly account for 40 this phenomenon. Our results also suggest that volatile elements may enriched in 41 small aerosol particles produced by femtosecond laser ablation whose transport 42 efficiencies are increased when using He instead of Ar. The calculated elemental 43 fractionation indices (with respect to Ca) of volatile elements (B, Cu, Zn, Ga, Ge, As, 44 Cd, Mo, Ag, Sn, Sb, Pb and Bi) rapid increased to 1.1-1.2 with increasing the spot 45 size from 24 um to 60 um when using helium as carrier gas. In contrast, they remain 46 nearly constant at spot sizes of 24-60 um when using argon as carrier gas. However, 47 indices of volatile elements (Co,Ni, Cu, Zn, Ga, Ge, As, Ag, Cd, Sn, Sb, Pb, Bi) is 48 less than 1 for all the spot sizes investigated. The signal intensities of all elements 49 obtained in pre-mixed He-Ar mixture is similar to the sensitivities acquired in pure 50 helium. Meanwhile, the calculated elemental fractionation indices for all elements 51 generally remain constant and more close to 1 than in pure He or Ar at different spot 52 sizes. The technique of using the pre-mixed He-Ar mixture as carrier gas has been 53 successfully used for the determination of major and trace elements in USGS and 54 MPI-DING glasses by using fs-LA-ICP-MS. View Article OnlineDOI: 10.1039/C7JA00190H 71 72 73 74 乃石 77 78 83 84 87 91 92 93 94 95 Introduction 96 Since the first application of laser ablation sample introduction with ICP-MS by97 G1丁ray in1985, laser ablation inductively coupled plasma massspectrometry98 (LA-ICP-MS) has been a popular technique for elemental analysis of various solid99 material.Nevertheless, the main limitation of this technology is still the occurrence100 of elemental fractionation that result in inaccurate analyses.7-10 Various approaches101 have been used in the past decade to develop appropriate strategies for the102 suppression of fractionation.l-15 Fortunately, the developments in laser ablation103 systems have contributed to the reduction of elemental fractionation and matrix104 effects. Especially, the femtosecond (fs)-LA inductively coupled plasma mass 105 spectrometry (ICP-MS) is regarded to be one of the most powerful methods in terms 106 of flexibility, accuracy, selectivity and sensitivity. The femtosecond laser energy 107 interact with the target material on a time scale shorter than the energy relaxation time. 108 The free electrons absorb the laser energy and are heated to high temperatures without 109 affecting the lattice during the duration of the laser pulsel8. 19 The utilization of 110 femtosecond (fs)-LA has promoted more efficient energy coupling with the material, 111 the ablation process using a fs laser is significantly less thermal and leads to a 112 shrinking of the heat-affected zone.2 Thereby, the aerosols produced by fs-LA has the 113 potential to eliminate elemental fractionation effects and matrix dependence.21-23 In 114 addition, the utilization of femtosecond producess iultra-finee aerosolsaandd tlthe 115 composition of these aerosols corresponds to the composition of the bulk material." 116 4 Furthermore, due to the small aerosol particle sizes produced, improved transport 117 and suppression of ICP induced fractionation and more stable ICP-MS signals can be 118 obtained.24-27 Consequently, several non-matrix nmatched calibrations have been 119 successfully performed using femtosecond laser ablation systems.28-3l 120 tis1Swell kknown that the properties of the ablation carrier gas strongly121 influences theplumeexpansiondynamicsand theieefficiencyofparticle122 transportation.32-3C6ommonly, helium and argon are applied as carrier gases in123 LA-ICP-MS. Eggins et al. has first reported reduced particle deposition around the124 ablation spot using a 193 nm excimer laser ablation system by ablating in He instead125 of Ar, and consequently a 2-4 fold increase in ICP-MS sensitivity has been observed.126 Ginther et al. showed a 2-3 fold sensitivity enhancement in helium compared with 127 conventional argon using a prototype 193 nm ArF excimer laser. The visual128 reduction of the ablated material deposition onto the sample surface under He129 atmosphere was also observed by 266 nm Nd: YAG laser, however, signal intensity130 enhancementby using helium irin combinationwiththe2665nm laserwas131 insignificant Horn et al. investigated the influence of ablation carrier gasses He,132 Ne and Ar on the particle size distribution and subsequently transport efficiency by133 using 266 and 193 nm wavelengths for ablation. The results showed that a larger134 degree primary particles were produced by 266 nm laser ablation and the particles135 were not much influenced by the ablation carrier gas environment. In contrast, the136 ablation carrier gas strongly influences the particle size distribution produced by 193137 nm laser ablation. This is the reason for the large increase in sensitivity obtained138 under helium condition by 193 nm while only a minor increase has been observed by139 266 nm laser system under similar conditions compared to argon atmosphere.140 However, Wang et al. has demonstrated that the significant improvements in141 analytical performance when using helium as carrier gas with 193 nm laser are only142 partly due to better ablation characteristics and the reduction of large particles, but143 most importantly it is because of the more uniform distribution of the individual144 elemental ions inside the ICP. Although the utilization of helium as aerosol carrier gas145 has been shown to improve both accuracy and sensitivity of laser ablation inductively146 coupled plasma mass spectrometry (LA-ICP-MS), occasionally, argon is being used147 due to practical and economic reasons. As for femtosecond laser ablation, both argon148 and helium were used as the carrier gas in previous publications.40-43 Particle size 149 distributions and compositions of primary aerosols produced by near-IR femtosecond150 laser ablation of brass in He and Ar conditions have been measured by Koch et al.151 The results indicated that ultra-fine aerosols were produced under both He and Ar152 condition, only slightly larger mean diameter was observed in Ar (~40 nm)2. The153 aerosolss generated by near-infrared femtosecond laser ablation of silicate glass154 ( carrier gas: helium, 1 atm ) also demonstrated that the major fraction of the aerosol155 mass is located within the mesoscopic size range, i.e. from 10 up to 100 nm². Garcia156 et al. found that the mass transport efficiencies of about 77% were achieved by157 femtosecond laser ablation in He. The transport efficiencies of aerosols released by158 NIR-and UV-femtosecond laser ablation of brass using argon as carrier gas were also159 measured by Garcia et al. Their results indicate that transport efficiencies calculated160 in argon are similar to values found under helium atmosphere taking into account an161 experimental uncertainty of approximately 10%-20%.The influence of the gas162 environment on the quantitative data of fs-LA-ICP-MS has been studied by Gonzales163 et al.2 Their results show that only small improvements in the relative standard164 deviation of the concentration measured between He and Ar environments with165 femtosecond ablation were obtained. In addition, a large number of studies focused on166 investigating elemental fractionation effects by utilizing fs-LA-ICP-MS.1S, 17,23,31,41,167 45,46 Nevertheless, few studies have performed to investigate elemental fractionation168 of femtosecond LA-ICP-MS in different ablation media.169 In this study, we studied elemental fractionation and the related sensitivity using 170 a 257 nm femtosecond laser ablation in combination with a quadrupole ICP-MS under 171 various atmospheric conditions by applying pure He, Ar or pre-mixed He-Ar mixture172 as carrier gas. The deposited particles surrounding the ablation crater produced by173 femtosecond laser ablation were also investigated by scanning electron microscopy.174 Furthermore, the international glass reference materials USGS and MPI-DING glass175 were analyzed using the optimum gas mixture evaluated within this study and the176 results are summarized. 177 178 Experimental 179 Instrumentation 180 Experiments were performed on an Agilent 7900 ICP-MS instrument (Japan) ina Yb femtosecond 181 combination with laser ablation system( = 257nm)182 (NWR-Femto, USA). Details of the instrumental operating conditions :and183 measurement parameters are reported in Table 1. A standard reference material NIST184 SRM 610 silicate glass was ablated by fs-LA for optimization of the instrumental 185 parameters. Helium or argon were used as carrier gas in the ablation cell and merged 186 with makeup gas (argon or helium) by a“Y”junction downstream from the ablation 187 cell. The carrier and make-up gas flows were optimized to obtain maximum signal 188 intensity for 139La, while keeping the ThO*/Th ratio below 0.3% and the U*/Th 189 ratio close to 1 when using helium and/or argon as carrier gas, individually. Three 190 experimental set-ups for the carrier gas flow were performed (Fig. 1): (a) carrier gas 191 He + makeup gas Ar: the flow of He passed through the ablation cell, mixed with Ar 192 behind the cell. (b) carrier gas Ar +makeup gas He: the flow of Ar was flowed 193 through the ablation chamber and the corresponding flow of Hewas added194 downstream from the ablation chamber. (c) carrier gas Ar + makeup gas Ar: a flow of195 Ar upstream from the ablation cell and an additional gas of Ar was mixed behind the196 cell. The mass flow controller equipped in laser ablation system was used to control197 the He gas flow, while the Ar gas flow supply was controlled by Agilent ICPMS198 software. It should be noted that the corresponding total flow rate injected into the199 ICP torch were the same in gas combination a and b. No significant difference of the200 oxide and double charge productivitieswere observed at these differentgas201 atmospheres.The oxide ratios of ThO*/Th and doubly charged ion ratios of202 42Cat+42Cataare constant at 0.21-0.29% and 0.69-0.85%, respectively. The signal203 stabilities of the three experimental for different gas combinations are similar. The204 calculated relative standard deviations (RSDs) of 139La* signal intensities for five205 measurements atdifferentgascombinationsareeconstantat 2.1-2.4%. ]Each206 measurement consists of 20 s background signal acquisition followed by 50 seconds207 ablation of a standard glass. 208 209 Samples 210 Polished NIST SRM 610 was used to study the ICP-MS signal intensity and211 elemental fractionation because it is one of the best characterized and most widely212 used reference materials in LA-ICP-MS.7 To investigate the accuracy and precision213 of 257 nm femtosecond LA-ICP-MS analysis in helium and argon conditions, the214 MPI-DING glasses GOR128-G (komatiite), GOR132-G (komatiite), KL2-G (basalt), 215 ML3B-G (basalt) and T1-G (quartz-diorite), USGS basaltic reference glasses216 (BCR-2G, BHVO-2G and GSE-1G) and the synthetic NIST glass 610 were used. The217 silicate glass NIST 610 was used as external calibration reference and Ca was used as218 the internal standard to quantify elemental concentrations in other reference glasses. 219 220 Results and Discussion 221 Comparison of signal intensity in helium and argon condition 222 Fig. 2 shows the time resolved signal intensities of 139La and 66Zn obtained223 using the femtosecond laser for ablating the NIST610 glass at spot size of 44 um in224 scanning ablation at different gas combinations. It can be seen that the similar signal225 intensities of 39La was observed when using helium or argon as carrier gas under226 scanning ablation. However, a significant signal enhancement of 6Zn signal intensity227 was achieved under helium ablation condition when compared to the ablation in argon.228 Fig. 3 shows the comparison of the summarized average normalized signal intensities229 for 62 elements obtained at different gas combination conditions (Fig. 1a, b, c) with230 different spot sizes of 16-60 um at different times. Scanning laser ablation mode and231 signal acquisition time of 50 s isS u1sed here. All these signal intensitieswere232 normalized to the signal intensities acquired at carrier gas Ar + makeup gas Ar (Fig.233 1c). It should be noted that the signal intensity has been optimized to maximum at234 each gas combination, individually. As seen in Fig. 3 that, the refractory elements235 showed a slight increase of signal intensities (about 1.05-1.20) by using helium as236 carrier gas. However, the signal enhancement is more significant for volatile elements 237 when helium was used as carrier gas. The enhancement factors are about 2.8-2.9 for238 elements of Zn and Cd, while other volatile elements have the enhancement factors239 from 1.5 to 2.0 (e.g. Tl, Se, Sn, Te, Pb, Bi, Ge, Ga, Sb, Ag, Cu). For better comparison240 of the results, the plasma conditionVwere kept constant for all experiments241 summarized in Fig. 1a and Fig. 1b. The result indicates a more efficient transportation242 of volatile elements when using helium as carrier gas. As already demonstrated, the243 application of fs pulse permits the production of aerosols predominately consisting of244 ultra-fine particles and the particle size distribution produced by fs-LA is less245 dependent on the carrier gas (He or Ar) 22,44. These may account for the similar signal246 intensities for refractory elements obtained in both helium and argon atmosphere by247 femtosecond laser ablation. Furthermore, it has been reported that the volatile248 elements enriched in small particle size fraction of aerosols produced by nanosecond249 laser ablation. Results presented here indicate that the volatile elements may also250 enrich in small particle size fraction of aerosols produced by femtosecond laser251 ablation. The significant increase of signal intensities of volatile elements (e.g. Zn and252 Cd) thus should be due to the improvement of transport efficiency of small particles253 by using helium as carrier gas. Fig. 4 shows the SEM images of the condensation254 deposits produced by femtosecond laser ablation on NIST 610 under both helium and255 argon conditions at a spot size of 44 um in single hole ablation. Visual inspection of256 the fs crater produced in helium and argon atmosphere indicated that far more small257 aerosol particles are deposited around the craters produced in argon atmosphere. The258 results of condensation deposits indicate a more efficient transportation of small 259 260 aerosol produced by femtosecond laser ablation in He, which is consistent with theobserved signal enhancement when using He as carrier gas. 261 Comparison of elemental fractionation in helium and argon condition 262263 Fig. 5 shows the elemental fractionation indices (FIs) by femtosecond laser264 ablation of NIST 610 using helium or argon as carrier gas. The FIs were calculated265 based on Ca as internal standard, and the 50 s transient signals were divided into equal266 time intervals instead of 240 seconds as reported by Fryer. As shown in Fig. 5a, the267 calculated FIs are close to 1 at small spot size of 24 um (except for Zn and Cd) by268 using helium as carrier gas and argon as makeup gas. However, the calculated269 elemental fractionation indices of volatile elements (Tl, Cd, Sn, Te, Zn, Pb, Bi, Cs, Rb,270 Ge, B, Na, Ga, Sb, Ag, K, Cu and As) increase to 1.1-1.2 with increasing spot sizes271 from 24 um to 44 um and 60 um, respectively. In contrast, the elemental fractionation272 indices remain nearly constant at spot sizes of 24-60 pm for NIST SRM 610 by using273 argon as carrier gas and helium as makeup gas (Fig. 5b). The calculated elemental274 fractionation indices of most elements are close to 1, while the indices ofvolatile275 elements (Cd, Sn, Zn, Pb, Bi, Ge, B, Na, Ga, Sb, Ag, K, Cu and As) are lower than 1.276 Since the ICP plasma conditions are constant, the results show that the different277 fractionation behaviors between helium and argon ablation atmosphere should be278 attributed to the different ablation atmospheres. Moreover, the fractionation indices279 obtained by using both argon as carrier gas and makeup gas (Fig. 5c) are similar to280 those obtained using argon as carrier gas and helium as makeup gas (Fig. 5b). These 281 282 results acquired using a femtosecond laser suggest that the composition of the aerosolcarrier gas has a significant influence on laser induced elemental fractionation. 283 Signal intensity and elemental fractionation in He-Ar mixed gas 284285 It is important to achieve high signal intensity and less elemental fractionation286 for laser ablation ICP-MS analysis. To compensate for both deficits of pure argon and287 helium, a pre-mixed helium and argon mixture was transported into the ablation cell288 as carrier gas in fs-LA-ICP-MS. Fig. 6 shows the comparison of signal intensities289 obtained in pure helium and different pre-mixed He-Ar ablation atmosphere290 conditions. All the signal intensities were normalized to the signal intensities acquired291 in pure He. The results indicate that signal intensities for both volatile and refractory292 elements obtained in various He/Ar ratios mixture are similar to those acquired using293 helium. We also examined the elemental fractionation of fs-LA-ICP-MS by using294 He-Ar mixture as carrier gas. Fig. 7 shows the Ca-normalized fractionation indices295 (FIs) by femtosecond laser ablation of NIST 610 in various ratios He-Ar mixture296 ablation atmospheres at a laser fluence of 2.8 J cm’. The calculated elemental297 fractionation indices for all elements investigated generally remain constant close to 1298 at each He-Ar ratio selected even when changing the spot size from 24 um to 44 um299 and 60 um. Similar to that observed in laser fluence of 2.8 J cm, the calculated FIs300 are also constant close to 1 at different laser fluences of 1.7 and 3.9 J cm’(SFig. 1).301 The FIs indicate significant improvements when compared to FIs obtained in purehelium or argon atmosphere (Fig.5). 302 304 Quantitative analysis of elements in He-Ar mixture and He atmosphere 305 According to the results documented in above discussion, the utilization of306 pre-mixed He-Ar mixture as carrier gas, showing reduced elemental fractionation307 while providing similar sensitivities to helium, was studied on well-characterized308 reference materials using fs-LA-ICP-MS. We thus compared the determined results in309 USGS and MPI-DING glasses by fs-LA-ICP-MS at spot sizes of 60 um using a310 He-Ar mixture and He as carrier gas. Here, NIST 610 was used as external calibration311 material and Ca was used as an internal standard. The data calibration was performed312 by software ICPMSDataCal’in this study. The reference values of NIST 610 were313 taken from Jochum et al. Fig. 8 shows the relative deviations of the determined314 average concentrations (n = 11) in MPI-DING and USGS silicate glasses studied by315 fs-LA-ICP-MS from the reference values. The reference values for the glass samples316 were taken from the GeoReM database (http://georem.mpch-mainz.gwdg.de/) and317 Jochum et al.48 It can be seen from Fig. 8a that the relative deviations of most318 elements agree with the reference values within 10%, while the relative deviations of319 volatile elements (e.g. B, Zn and Pb) are consistently beyond 10% for most of the320 USGS and MPI-DING glasses when ablating in helium. In contrast, the measured321 values of volatile elements (e.g. B, Zn and Pb) agree well with reference values within322 10% for most of the geological reference glasses by using He/Ar mixture as carrier323 gas (Fig. 8b).Generally, the accuracies of the determined element concentrations,324 especially for volatile elements, in USGS and MPI-DING glasses are improved when 325 using He/Ar mixture as carrier gas compared to He (Fig.8). Some elements (e.g. Be,326 Nb, Cs, Th) in ML3B-G,GOR128-G or GOR132-G showed a larger deviation than327 10% in both pure He and He/Ar mixture atmosphere(Fig. 8), which is most likely due328 to their low concentrations in these samples. The observed large relative deviation of329 P iin. many of these glasses ccannot bbe explained and may be related to its330 heterogeneous distribution in these glasses53,54 331 332 Conclusions 333 The results presented here indicate that selecting different carrier gases in ablation cell 334 have a significant effect on the performance of 257 nm femtosecond LA-ICP-MS.335 Compared to argon carrier gas, the signal intensities of volatile elements (e.g. B, Cu,336 Zn, Ga,Ge, As, Cd, Mo, Ag, Sn, Sb, Pb and Bi) were increased by a factor of 1.5-3.0337 in helium carrier gas. Whereas, those of refractory elements (e.g. rare earth elements)338 were only increased by a factor of 1.05-1.20. The much less deposited aerosol339 particles around the ablation craters produced in helium carrier gas than that in argon340 carrier gas may partly account for this phenomenon. Our results also indirectly341 suggest that volatile elements may enriched in small aerosol particles produced by342 femtosecond laser ablation whose transport efficiencies are increased when using He343 instead of Ar. The increased elemental fractionation indices (with respect to Ca) of344 volatile elements with increasing the spot sizes were observed in fs laser ablation in345 helium. Unlike in helium carrier gas, the calculated elemental fractionation indices of 346 volatile elements remain nearly constant at spot sizes of 24-60 um in argon carrier gas. 347 However, their values are less than 1 in all these spot sizes. Our results show that the348 He-Ar mixture is more suitable as aerosol carrier gas than using pure He or Ar for349 femtosecond (fs)-LA-ICP-MS analysis. The signal intensities of all elements obtained350 in pre-mixed He-Ar mixture are similar to the sensitivities acquired in pure helium.351 Meanwhile, the calculated elemental fractionation indices for all elements generally352 remain constant and closer to 1 than in He or Ar at different spot sizes. This study353 shows the first time that the use of pre-mixed He-Ar as carrier gas for 257 nm354 femtosecond LA-ICP-MS is more suited and leads to improved quantitative analysis355 for a variety of glass samples analyzed. 356 357 Conflicts of interest 358 There are no conflicts of interest to declare. 359 Acknowledgments 360 We would like to thank three reviewers for their constructive comments and Harriet361 Brewerton for overseeing the editorial process. This research is supported by the362 National Natural Science Foundation of China (Grants 41403017, 41573015, and363 41322023), the Science Fund for Distinguished Young Scholars of Hubei Province364 (2016CFA047), and the MOST Special Fund from the State Key Laboratories of365 Geological Processes and Mineral Resources. 366 367 369 370 371 372 373 374 375 376 377 378 379 380 381 References 382 1. A. L. Gray,Analyst,1985,110,551-556. 383 2. K. E. Jarvis and J. G. Williams, Chem. Geol., 1993,106,251-262. 384 3. B.J. Fryer, S. E. Jackson and H. P. Longerich, Can.Mineral., 1995,33, 303-303. 385 4. P. H. Chi, F. H.Ko, C. T. Hsu, H. L. Chen, C. K. Yang, Y. C. Sun and M. H. Yang, J. Anal. At. 386 Spectrom.,2002,17,358-365. 387 5. S.F. Durrant and N. I. Ward, J. Anal. At. Spectrom.,2005, 20,821-829. 388 6. J. S. Becker, M. Zoriy, J. S. Becker,J. Dobrowolska and A. Matusch, J. Anal. At. Spectrom., 389 2007, 22,736-744. 390 7. H. Longerich,D. Giinther and S. Jackson, Fresenius'J. Anal. Chem.,1996,355,538-542. 391 8. D. Giinther and B. Hattendorf, TrAC, Trends Anal. Chem.,2005,24,255-265. 392 9. C. C. Garcia, H. Lindner and K. Niemax, J. Anal.At. Spectrom., 2009, 24, 14-26. 393 10. F. Claverie, B. Fernandez, C. Pecheyran, J. Alexis and O. F. Donard, J. Anal. At. Spectrom., 394 2009,24,891-902. 395 S. Chenery and J. M. Cook, J. Anal. At. Spectrom., 1993,8,299-303. ( 396 T. Hirata and R. W. Nesbitt, Geochim. Cosmochim. Acta., 1995,59,2491-2500. ) ( 397 F. Poitrasson, S. Chenery and D. J. Bland, Earth. Planet. Sc. Lett . ,1996,145,79-96. ) 398 T. Hirata, J. Anal. At. Spectrom., 1997, 12, 1337-1342. ( 399 F. Poitrasson , X . Mao, S. S. Mao, R. F reydier and R. E . Russo, Anal. Chem., 2003, 7 5, ) 400 6184-6190. 401 R. E. Russo, X. Mao, C. Liu and J. Gonzalez,J. Anal. At. Spectrom.,2004,19,1084-1089. 402 R. E. Russo, X. Mao, J. Gonzalez and S. Mao, J. Anal. At. Spectrom.,2002,17,1072-1075. 403 404 ( B. Rethfeld, K. Sokolowski-Tinten, D. Von D er Linde and S. Anisimov, Appl. Phys. A., 2004, 79, 7 67-769. ) 405 406 ( 19. B. Chichkov, C. Momma, S. Nolte, F . V on Alvensleben a n d A . T u nnermann, Appl. Ph y s. A.,1996,63, 1 09-115. ) 407 408 ( 20. B. Fernandez, F . Claverie, C. Pecheyran and O.F . Donard, T r AC, Trends Anal. Chem.,2007, 26,951-966. ) 409 410 ( 21. V . M argetic, A. Pakulev, A. Stockhaus, M. Bolshov, K . N iemax a n d R. Hergenroder,Spectrochim. Acta, Part B., 2000, 55,1771-1785. ) 411 412 ( 22. J. Koch, A. V on B o hlen, R. H e rgenroder and K. Nie m ax, J. A n al. At. Spe c trom., 2004, 19, 267-272. ) 413 414 ( 23. J. Koch, H. Lindner, A. Von Bohlen, R. Hergenroder and K. Ni e max,J. Anal. At. Spectrom.,2005,20,901-906. ) ( 415 J. K och,M. Walle, J. P isonero and D. Giinther, J. Anal. At. Spectrom., 2006, 21, 932 -9 40. ) ( 416 C. C. Garcia, H . L indner and K. Niemax, Spe c trochim. Acta, Part B., 2007, 62, 13-19. ) ( 417 J . González, S . D undas, C . L i u, X . Mao and R. R usso, J. A n al . At. S pectrom., 2006 , 21, 418 778-784. ) ( 419 J. Gonzalez, D. Oropeza, X. Mao and R . Russo, J. Anal. At. Spectrom., 2008,23, 229-234. ) 420 421 ( Q. Z. Bian, J. Koch, H. Lindner, H. Berndt, R. Hergenroder and K. Niemax, J. Anal. At. Spectrom.,2005,20,736-740. ) ( 422 Q. Z. Bian, C. C. Garcia, J. Koch and K. Niemax,J. Anal. At. Spectrom., 2006,21,187 - 191. ) ( 423 J. Gonzalez,C. Liu, X. Mao and R. E. Russo, J. A n al. A t . Spectrom.,2004,19,1165 - 1 168. ) ( 424 I . Horn and F. von Blanckenburg, Spectrochim. Acta, P a rt B., 2007,62,410-422. ) ( 425 S. M. Eggins, L. K i nsley and J. Shelley, Appl. Surf. Sci., 1998, 127 , 278-286. ) ( 426 D. Giinther and C. A. Heinrich,J. Anal. At. Spectrom. , 1999, 14,1363-1368. ) ( 427 D. Gunther and C. A. Heinrich, J. Anal. At. Spectrom.,1999, 1 4 , 1369-1374. ) ( 428 A. B ogaerts, Z. C hen a n d D. Bleiner, J. Anal. A t . Spectrom., 2006, 21,384-395. ) ( 429 J. Kosler, S. E. Jackson, Z. Yang and R. Wirth, J.Anal. At. S p ectrom., 2014,29,832-840. ) 430 I. Horn and D. Ginther, Appl. Surf. Sci.,2003,207,144-157. ( 431 D. Giinther and C. Heinrich, J. Anal. At. Spectrom.,1999,14,1369-1374. ) ( 432 Z. K. Wang, B . Hattendorf and D. Giinther, J. Anal. At. Spectrom.,2006,21, 1 143-1151. ) 433 C. Liu, X. Mao, S. Mao, X. Zeng, R. Greif and R. E. Russo, Anal. Chem., 2004, 76,379-383. 434 435 ( C. C. Garcia, H. L indner, A . von B o hlen, C. Vadla and K. Niemax, J. Ana l . At. Spe c trom., 2008,23,470-478. ) 436 42. Z. Yang, B. J. Fryer, H. P. Longerich, J. E. Gagnon and I. M. Samson, J. Anal. At. Spectrom., 437 2011,26,341-351. 438 43. H. Wiltsche and D. Giinther, Anal. Bioanal.Chem.,2011,399,2167-2174. 439 440 ( 44. C. C. Garcia, M . Walle, H . L i ndner, J . Koch, K . Niemax and D. Giinther, Spectrochim. Acta , Part B.,2008,63,271-276. ) 441 442 45. M. Ohata, D. Tabersky, R. Glaus, J. Koch, B. Hattendorf and D. Ginther, J. Anal. At.Spectrom.,2014,29,1345-1353. 443 46. K. P. Jochum, B. Stoll, U. Weis, D. E. Jacob, R. M. Kraus and M. O. Andreae, Geostand. 444 Geoanal. Res.,2014,38,265-292. 445 47. 446 ( K. P . Jochum, U . W eis, B. Stoll, D. Kuzmin, Q. Yang, I. Raczek, D. E. Jacob, A. Stracke, K. Birbaum and D . A. Frick, Geostand.Geoanal. Res., 2011, 35, 397-429. ) 447 48. 448 449 ( K. P . Jochum, B. S toll, K. Herwig, M . Willbold, A . W. H o fmann, M. Amini, S. Aar b urg, W.Abouchami, I E. Hellebrandaand B. Mocek. , Geochem. Geophy. Geosy., 2006. 7.doi:10.1029/2005GC001060. ) 450 451 ( 49. K. P. Jochum, M. Willbold, I. Raczek, B. Stoll an d K . Herwig, Geostand. Geoanal. Res.,2005, 29, 285-302. ) 452 H. R. Kuhn and D. Gunther, J. Anal. At. Spectrom.,2004,19,1158-1164. 453 454 ( Y . S. Liu, Z. C. Hu, S. Gao, D. Giinther, J. Xu , C. G . Gao and H. H. Chen, Chem. Geol., 2008,257,34-43. ) 455 456 457 ( 52. K. P . Jochum, U . W eis, B. Stoll, D. Kuzmin, Q. Yang, I. R aczek, D. E. Jacob, A. Stracke, K .Birbaum, D . A . Frick, D . G inther and J. E nzweiler, G eostand. Geoanal. Res., 2 011, 35,397-429 ) 458 3S. M. Eggins and J. M. G. Shelley, Geostandard. Newslett., 2002, 26, 269-286. 459 460 ( Z. C. H u, Y. S. L iu, M . L i , S. G ao a n d L. S. Zhao, Ge o stand. Ge o anal. Res . , 2009, 33, 319-335. ) 461 K. Lodders, Astrophys. J., 2003,591,1220-1247. 462 K. Lodders, H. Palme and H. P. Gail, Springer. Berlin. Heidelberg.,2009,712-770. 463 464 465 Table 1 Summary of the operating conditions for LA-ICP-MS measurements. Laser ablation system Laser type 257 nm, femtosecond laser Repetition rate 8 Hz Pulse length 300 fs Energy density 2.8 Jcm~ Spot sizes 16, 24, 44 and 60 um Carrier gas He, Ar or He/Ar mixture Agilent 7900 ICP-MS RF power 1350 W Plasma gas flow rate 15.01min Auxiliary gas flow rate 1.0 1 min Sampling depth 5.0mm Ion optic settings Typical 7Li, Be,"B, Na, 25Mg,Al,2Si, 3lp, 39K,4Ca,45sc,4Ti,5lv,2cr,5sMn,5Fe, Isotopes measured Co, 60Ni, 65cu, 66Zn,Ga, "Ge, 75As. 82Se, 85Rb, 88Sr, 89Y9,0Zr, 93Nb, 95Mo, IllCd, 103Rh,107 Ag, 115In, 118Sn, 121Sb, 137Ba, 126Te.133Cs. 139La, 140Ce, 141Pr. Dwell time per isotope Detector mode 143Nd, 147Sm, 15lEu, B7Gd, 159Tb, 163Dy,165Ho.0,166E3rr,, 169Tm, 1173Yb, 175Lu,17Hf,181Ta 182w, 195pt,197Au, 205Tl, 208pb, 20Bi,232Th,238U10 msDual 469 470 471 472 473 474 475 476 Figure captions 477 Fig. 1 Schematic of the instrumental setup for gas flow paths. (a) carrier gas He +478 makeup gas Ar; (b) carrier gas Ar +makeup gas He ; (C) carrier gas Ar + makeup gas479 Ar; (d) carrier gas He +Ar, makeup gas. 480 481 Fig. 2 Comparison of the temporal signal intensities of 139La and 66Zn obtained with482 the femtosecond laser ablation of NIST610 glass at spot size of 44 um in scanning483 ablation at a fluence of 2.8 J cm’in different gas combinations. The gas flow rates of484 three gas combinations are as follow: carrier gas Ar (700 ml min) and makeup gas485 Ar (600 ml min); carrier gas He (650 ml min’) and makeup gas Ar (850 ml min’);486 carrier gas Ar (850 ml min’) and makeup gas He (650 ml min). 487 488 Fig. 3 The comparison of signal intensities obtained at various gas combination489 conditions.Thee volatile and refractoryelements aree classifieddbby tthe 50%490 condensation temperaturess of elements.55, 56Error bars represent the standard491 deviation (1s) of 8 measurements. The experiments are performed at spot sizes of492 16-60 um and scanning ablation mode at a fluence of 2.8 J cm. 493 494 Fig. 4 Scanning electron microscope images of the condensation deposits produced by495 single hole ablation on NIST 610 at a spot size of 44 um. (a) Helium atmosphere: 650496 ml min and 400 pulses;(b) Argon atmosphere: 700 ml min and 400 pulses. 497 498 Fig. 5 Ca-normalized fractionation indices (FIs) by femtosecond laser ablation of499 NIST 610 using helium or argon as carrier gas with spot sizes of 24, 44 and 60 um at500 fluence of 2.8 J cm. (a) carrier gas: He (650 ml min’) and makeup gas: Ar (900 ml501 min');(b) carrier gas: Ar (900 ml min) and makeup gas: He (650 ml min); (c)502 carrier gas: Ar (700 ml min’) and makeup gas: Ar (600 ml min). Error bars represent503 the standard deviation (1s) from three measurements. 504 505 Fig. 6 The comparison of signal intensities obtained in pure helium and pre-mixed506 He-Ar mixture ablation condition by femtosecond laser ablation. The corresponding507 flow rates of helium and argon are controlled by the mass flow controller equipped in508 instruments. The composition of total gas to the ICP is kept constant by the addition 509 of appropriate makeup gas. The gas flow rates are as follow, carrier gas: He (400 ml510 min) and makeup gas: Ar (950 ml min ); pre-mixed carrier gas: He (400 ml511 min)+Ar (200 ml min) and makeup gas: Ar (750 ml min); pre-mixed carrier gas:512 He (400 ml min")+ Ar (400 ml min’) and makeup gas: Ar (550 ml min). 513 514 Fig. 7 The Ca-normalized fractionation indices (FIs) by femtosecond laser ablation of515 NIST 610 in different He-Ar mixture ablation atmosphere. (a) carrier gas: He (400 ml516 min )+Ar (200 ml min'); (b) carrier gas: He (400 ml min)+Ar (400 ml min); (c)517 carrier gas: He (400 ml min')+Ar (800 ml min’). The composition of total gas to the518 ICP is kept constant by the addition of appropriate makeup gas. Error bars represent519 the standard deviation (1 s) from three measurements. 520 521 Fig. 8 The relative deviations of the determined average concentrations (n = 11) in 522 MPI-DING and USGS silicate glasses studied by fs-LA-ICP-MS from the reference523 values. 524 525 526 527 528 529 530 531 532 533 534 535 536 537 538 539 540 541 543 544 545 546 Fig. 2 4000000 (a) --carrier gas: Ar + makeup gas: Ar 一-carrier gas: He+makeup gas: Ar -carrier gas: Ar + makeup gas: He 3000000 2000000 1000000 0 0 20 40 60 80 100 547 Time (seconds) 548 Fig. 3 |(carrier gas: He +makeup gas: Ar)/(carrier gas: Ar + makeup gas: Ar) (carrier gas: Ar+makeup gas: He )/(carrier gas: Ar+ makeup gas: Ar ) more volatile elements more refractory elements 551 552 553 Journal of Analytical Atomic Spectrometry a Helium. 44um -20pm mag 口HVWDspot det x-24.3818mm5 000x10.00kV9.9mm4.5 ETDy. 9.3932 mm hina Univ Geos.ci 557 Journal of Analytical Atomic Spectrometry 562 (b) (c) LLLLLLLLLL 563 565 566 1.2 1.0 (a) 24pm-44pm-◆--660 pm 0.8 LLLLLLLLLLLLLLLL _LL LLLLL 569 570 571 Bgaoo BCR-2G KL2-GBHVO-2G GOR132-G T1-G GOR128-G ML3B-G GSE-1G (b) carrier gas: He/Ar mixture 60 pm 口 采用257nm飞秒(fs)-LA-ICP-MS对不同气体条件下(He、Ar和He与Ar的混合气)的元素分离和信号强度进行了研究。实验表明,随着剥蚀载气由氩气转变为氦气,NIST SRM 610中难熔元素(如稀土元素)的灵敏度提高了1.05-1.20倍。而挥发性元素(如Tl、Cd、Se、Sn、Te、Zn、Pb、Bi、Ge、Ga、Sb、Ag、Cu)的信号强度增加了1.5-3.0倍。与氩气相比,使用氦气作为载气时在剥蚀坑周围沉积的气溶胶颗粒要少得多。我们的结果还表明,飞秒激光烧蚀产生的小气溶胶颗粒中可能富集了挥发性元素,使用氦气代替氩气可以提高其传输效率。使用氦气作为载气,光斑尺寸从24µm 增加至60µm,计算挥发性元素(B, Cu, Zn, Ga, Ge, As, Cd, Mo, Ag, Sn, Sb, Pb和 Bi)的元素分离指数(对Ca)急剧增加到1.1-1.2。相反, 当使用氩气作为载气,光斑尺寸从24µm增加到60µm,元素分离指数几乎不变然而,在所有被调查的点尺寸中,挥发性元素(Co、Ni、Cu、Zn、Ga、Ge、As、Ag、Cd、Sn、Sb、Pb、Bi)的指数都小于1。然而,在任意光斑尺寸下,挥发性元素(Co、Ni、Cu、Zn、Ga、Ge、As、Ag、Cd、Sn、Sb、Pb、Bi)的元素分离指数都小于1。在氦氩混合气中获得的元素的信号强度与纯氦气中获得的信号强度的灵敏度相似。同时,在不同光斑尺寸下,所有元素的元素分离指数保持不变,比纯He或Ar更接近1。以氦氩混合气为载气,使用fs-LA-ICP-MS联用技术成功地测定了USGS和MPI-DING玻璃中的主要和痕量元素。
关闭-
1/31
-
2/31
还剩29页未读,是否继续阅读?
继续免费阅读全文产品配置单
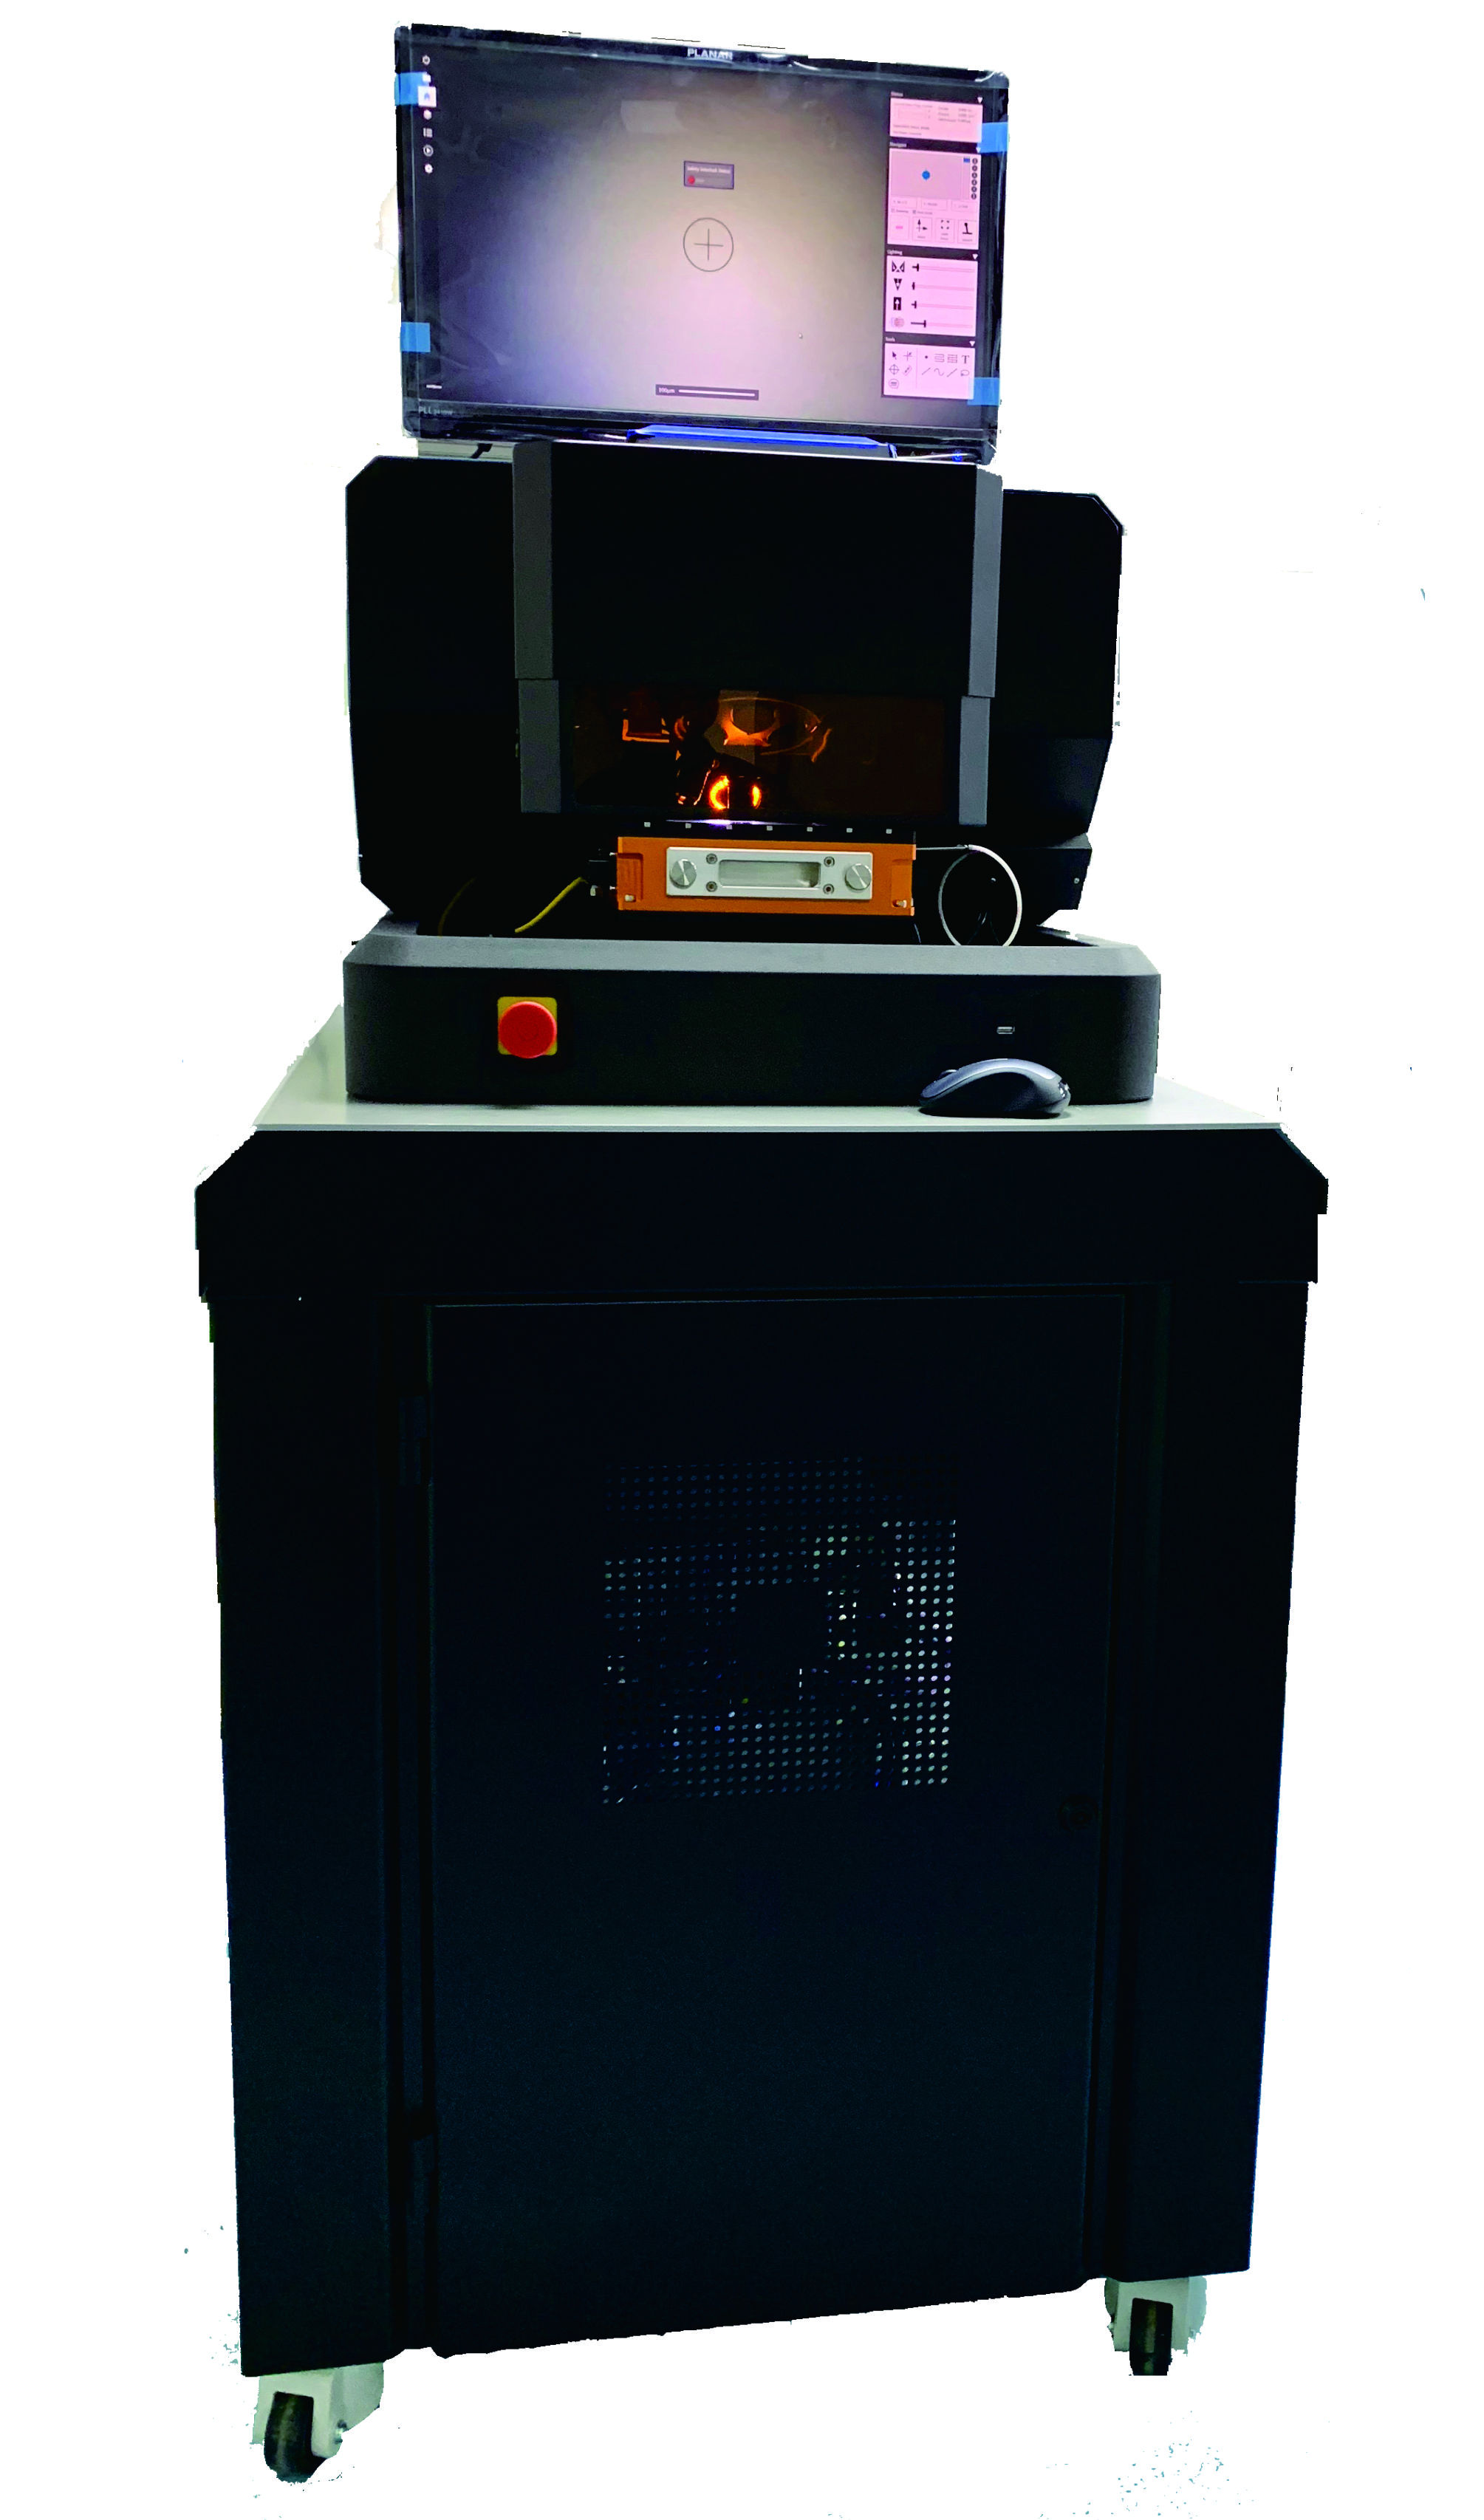
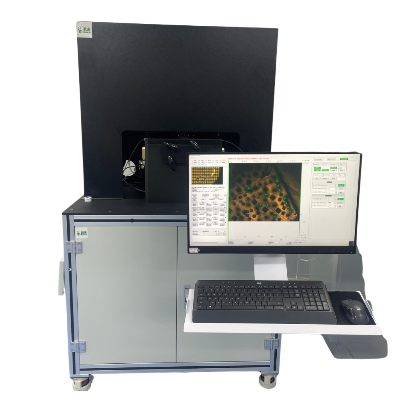
上海凯来仪器有限公司为您提供《矿物中无机元素检测方案(激光诱导击穿)》,该方案主要用于其他中无机元素检测,参考标准《暂无》,《矿物中无机元素检测方案(激光诱导击穿)》用到的仪器有ESLfemto 飞秒激光剥蚀系统 。
我要纠错
推荐专场
相关方案
 咨询
咨询