方案详情文
智能文字提取功能测试中
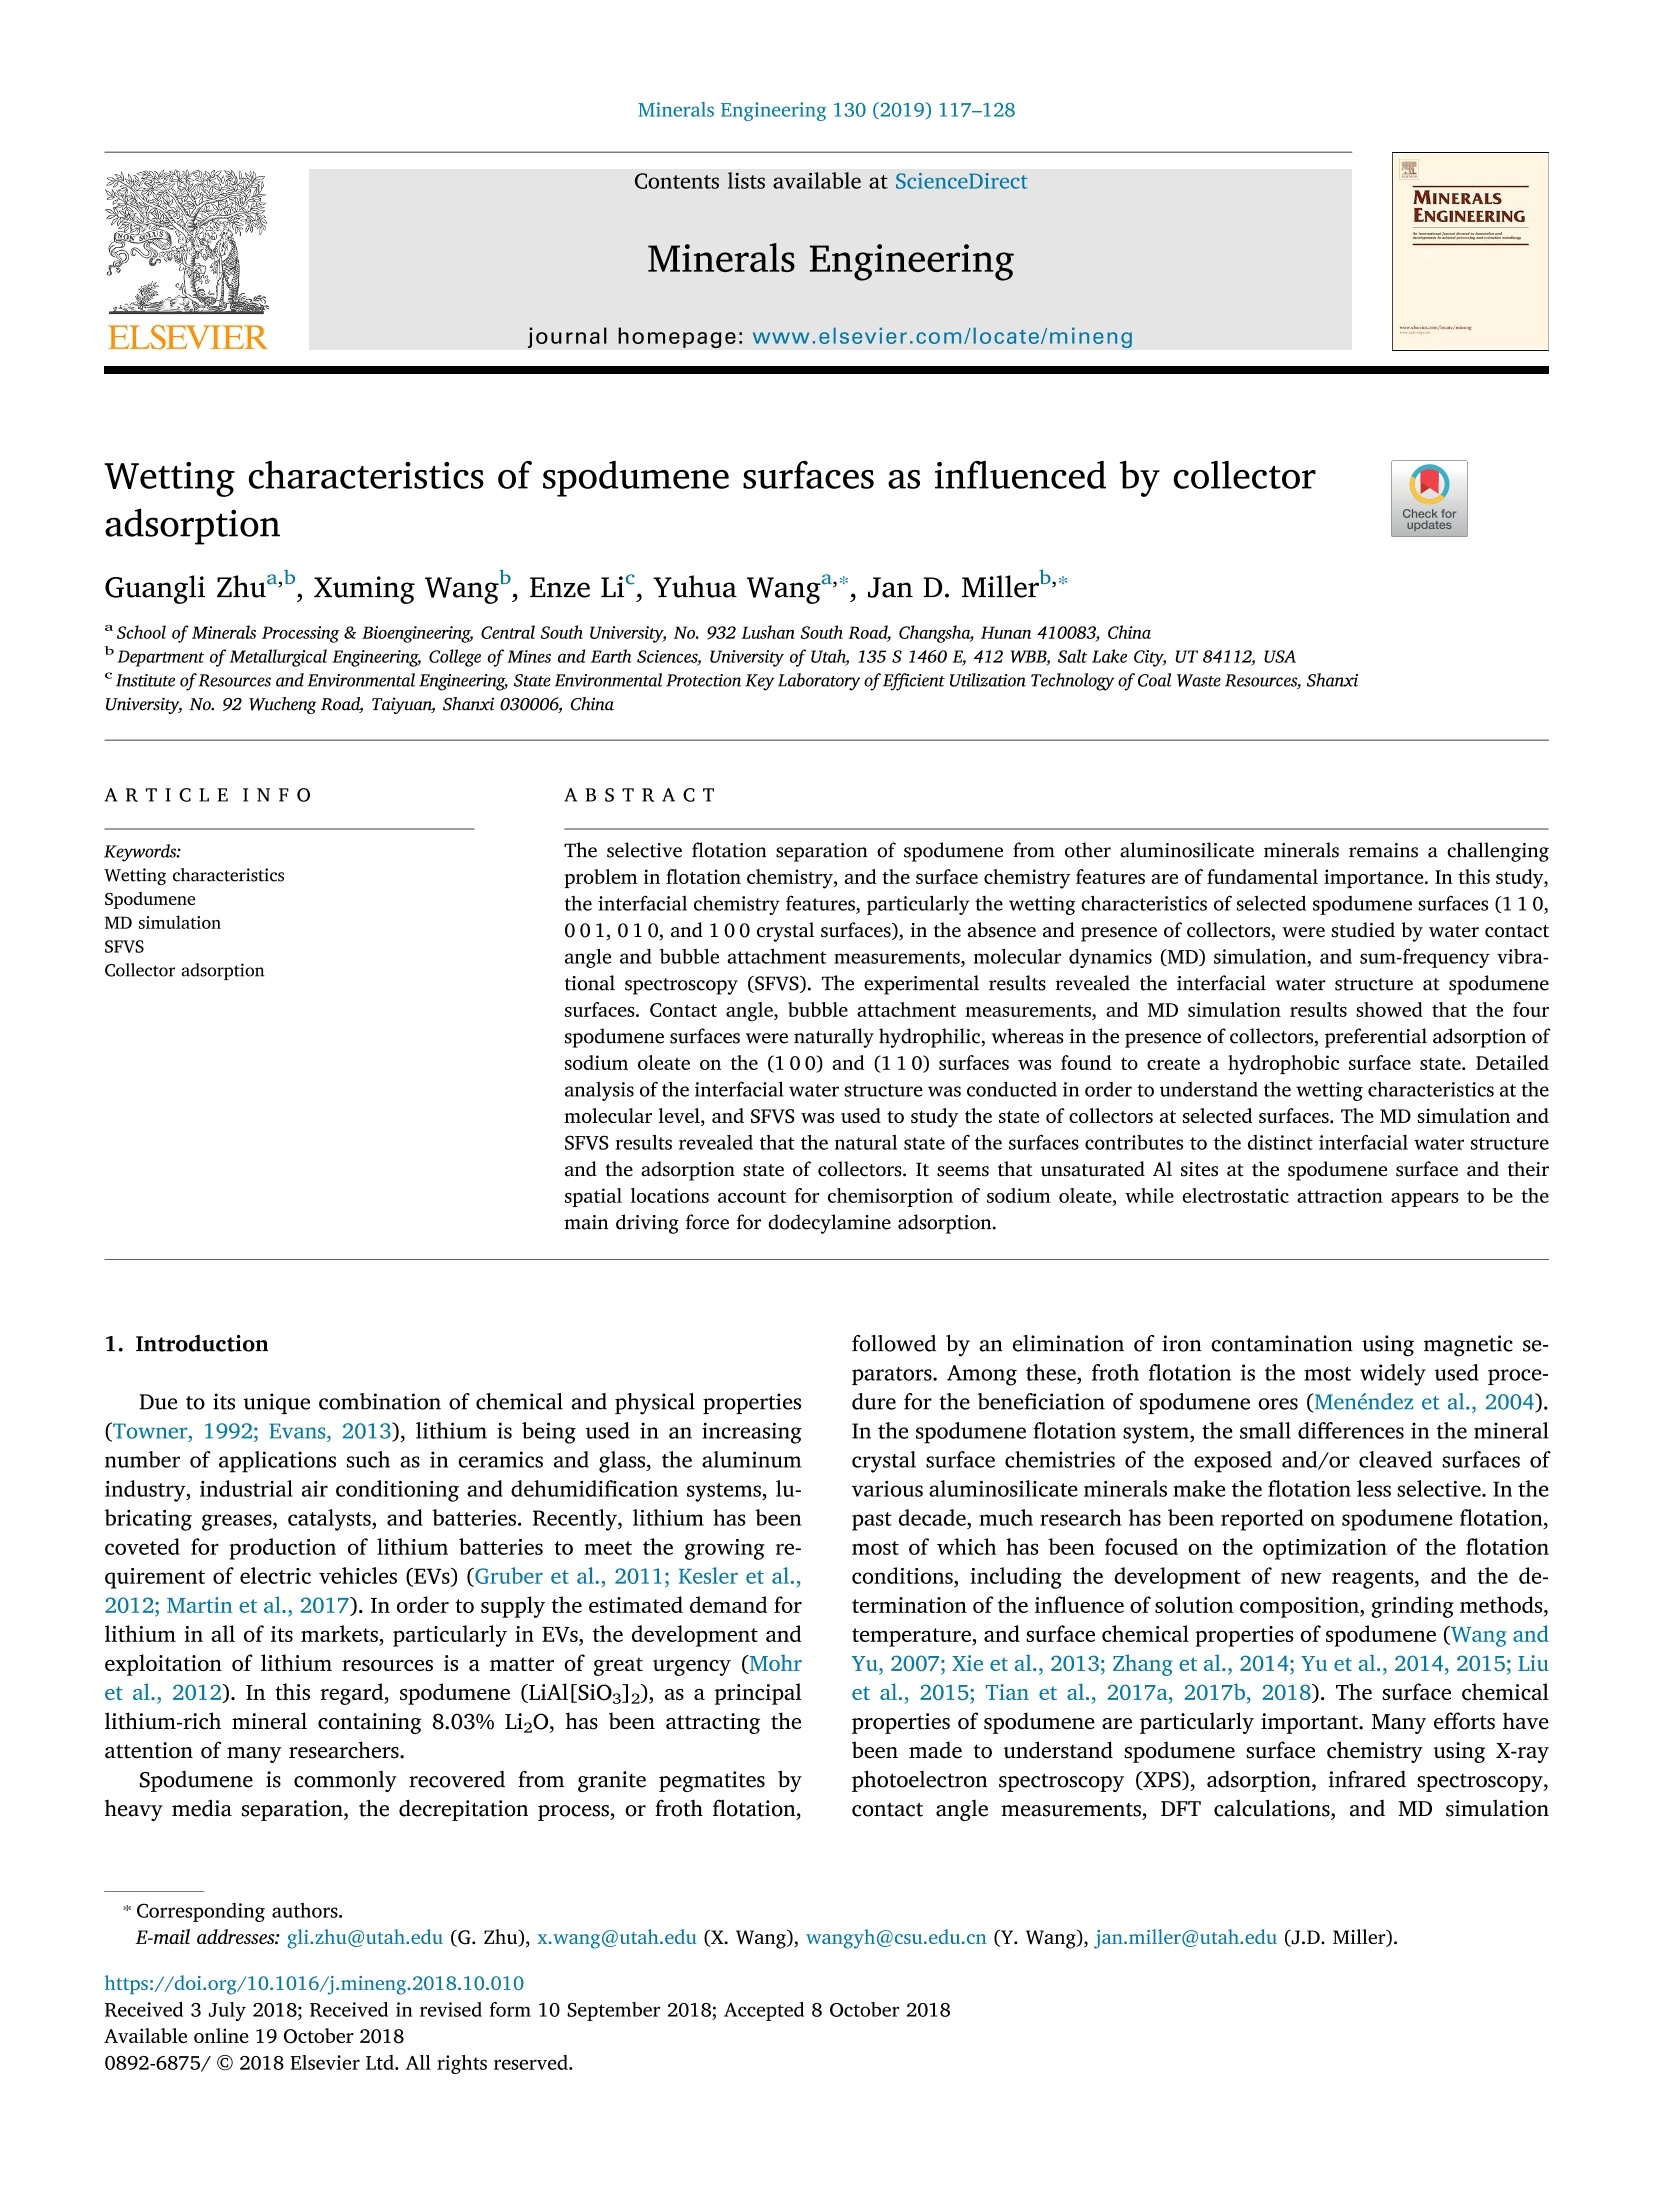
Minerals Engineering 130 (2019) 117-128Contents lists available at ScienceDirectMinerals Engineering Minerals Engineering 130 (2019) 117-128G. Zhu et al. journal homepage: www.elsevier.com/locate/mineng Wetting characteristics of spodumene surfaces as influenced by collectoradsorption Guangli Zhu,Xuming Wang, Enze Li, Yuhua Wanga*, Jan D. Miller * School of Minerals Processing & Bioengineering, Central South University, No. 932 Lushan South Road, Changsha, Hunan 410083, China Department of Metallurgical Engineering, College of Mines and Earth Sciences, University of Utah, 135 S 1460 E, 412 WBB, Salt Lake City, UT 84112, USA Institute of Resources and Environmental Engineering, State Environmental Protection Key Laboratory of Efficient Utilization Technology of Coal Waste Resources, Shanxi University, No. 92 Wucheng Road, Taiyuan, Shanxi 030006, China ARTICLEINFO ABSTRAC T Keywords:Wetting characteristicsSpodumeneMD simulationSFVSCollector adsorption The selective flotation separation of spodumene from other aluminosilicate minerals remains a challengingproblem in flotation chemistry, and the surface chemistry features are of fundamental importance. In this study,the interfacial chemistry features, particularly the wetting characteristics of selected spodumene surfaces (110,001,010, and 10 0 crystal surfaces), in the absence and presence of collectors, were studied by water contactangle and bubble attachment measurements, molecular dynamics (MD) simulation, and sum-frequency vibra-tional spectroscopy (SFVS). The experimental results revealed the interfacial water structure at spodumenesurfaces. Contact angle, bubble attachment measurements, and MD simulation results showed that the fourspodumene surfaces were naturally hydrophilic, whereas in the presence of collectors, preferential adsorption ofsodium oleate on the (100) and (110) surfaces was found to create a hydrophobic surface state. Detailedanalysis of the interfacial water structure was conducted in order to understand the wetting characteristics at themolecular level, and SFVS was used to study the state of collectors at selected surfaces. The MD simulation andSFVS results revealed that the natural state of the surfaces contributes to the distinct interfacial water structureand the adsorption state of collectors. It seems that unsaturated Al sites at the spodumene surface and theirspatial locations account for chemisorption of sodium oleate, while electrostatic attraction appears to be themain driving force for dodecylamine adsorption. 1. Introduction Due to its unique combination of chemical and physical properties(Towner, 1992; Evans, 2013), lithium is being used in an increasingnumber of applications such as in ceramics and glass, the aluminumindustry, industrial air conditioning and dehumidification systems, lu-bricating greases, catalysts, and batteries. Recently, lithium has beencoveted for production of lithium batteries to meet the growing re-quirement of electric vehicles (EVs) (Gruber et al., 2011; Kesler et al.,2012; Martin et al., 2017). In order to supply the estimated demand forlithium in all of its markets, particularly in EVs, the development andexploitation of lithium resources is a matter of great urgency (Mohret al.,2012). In this regard, spodumene (LiAl[SiO3]2), as a principallithium-rich mineral containing 8.03% LizO, has been attracting theattention of many researchers. Spodumene is commonly recovered from granite pegmatites byheavy media separation, the decrepitation process, or froth flotation, followed by an elimination of iron contamination using magnetic se-parators. Among these, froth flotation is the most widely used proce-dure for the beneficiation of spodumene ores (Menendez et al., 2004).In the spodumene flotation system, the small differences in the mineralcrystal surface chemistries of the exposed and/or cleaved surfaces ofvarious aluminosilicate minerals make the flotation less selective.In thepast decade, much research has been reported on spodumene flotation,most of which has been focused on the optimization of the flotationconditions, including the development of new reagents, and the de-termination of the influence of solution composition, grinding methods,temperature, and surface chemical properties of spodumene (Wang andYu, 2007; Xieet al., 2013; Zhang et al., 2014; Yu et al., 2014, 2015; Liuet al., 2015; Tian et al., 2017a,2017b,2018). The surface chemicalproperties of spodumene are particularly important. Many efforts havebeen made to understand spodumene surface chemistry using X-rayphotoelectron spectroscopy (XPS), adsorption, infrared spectroscopy,contact angle measurements, DFT calculations, and MD simulation ( * Corresponding authors. ) ( E-mail addresses: gli.zhu@utah . edu ( G. Zhu), x .wang@utah.edu (X. Wang), wangy h@csu .e du.cn (Y. Wang ) , jan.mille r @utah. e du ( J .D. Mill e r). ) ( https://doi.org/ 1 0.1016/ j .mineng.2018.10.010 ) ( Received 3 July 2018; Received in revised f orm 10 S e ptember 2018; Ac c epted 8 October 2018 Available online 19 October 2018 ) (110) Surface (001) Surface (010) Surface (100) Surface Fig. 1. XRD peaks for single spodumene crystal orientation. (Moon, 1986; Rai et al., 2011; He et al., 2014; Xu et al., 2016). It is noted that the characteristics of spodumene surfaces are dis-tinguished by the number and type of exposed surface sites. In 1986,Moon and Fuerstenau first studied the surface chemistry in selectiveflotation of spodumene from other aluminosilicates, and stated that thecharacteristic chemistry of spodumene surfaces was a major factorcontributing to the selective separation of spodumene (Moon, 1986;Moon and Fuerstenau, 2003). The surface aluminum sites at the spo-dumene (110) surface are more favored for the chemisorption of thecarboxylate functional group in oleate compared with those at othercrystal surfaces. More recent study of wet and dry grinding of spodu-mene was carried out, and showed that the two grinding methodsproduced particles with different relative content of exposed surfaces,resulting in different flotation behavior between the wet and dryground spodumene (Zhu et al., 2015). Fine spodumene particles with asize fraction of 38-45 um have superior flotability among four sizefractions (45-75 um, 38-45 um, 19-38 um and 0-19 um) of spodumenebecause of more exposure of the (110) edge surface, whereas finerspodumene particles with size fractions of 19-38 um and 0-19 um havemore exposure of the (001) basal plane surface, which adsorbs lesssodium oleate (NaOL) (Xu et al., 2016). At present, it has been widely accepted that the flotability of spo-dumene is closely related to the amount and type of exposed surfaceatoms, as determined by the crystal structure, and that the density of Alsites at different crystal surfaces contributes to the anisotropic ad-sorption of NaOL. On the other hand, it is well known that the entireprocess of froth flotation, involving three phases (mineral, water, andair), with many sub-processes and interactions, can be described bythree major sub-processes: bubble-particle collision, adhesion of themineral particles to the air bubble, and detachment from the air bubble.The primary requisite for flotation is the replacement of water at themineral surface by air bubbles, and this can be interpreted as wett-ability, to some extent. In this regard, it is significant to have a fun-damental understanding of surface chemistry and wettability in con-trolling the bubble/mineral particle adhesion sub-process (Fuerstenauand Han, 2003). However, detailed consideration of the wettability ofspodumene surfaces has been neglected. Thus, in addition to adsorptionsites, the interfacial water structure at spodumene surfaces may play animportant role in the preferential adsorption of NaOL and the corre-sponding wettability. Therefore, a systematic description of waterstructure at the surfaces deserves attention for a better understanding ofspodumene flotation chemistry. MD simulation is being used in flotation chemistry to explore in-teractions between water and minerals, and to provide molecular-levelinformation about the structure and dynamic properties of interfacialwater at selected mineral surfaces (Rustad, 2001; Gallo et al., 2002; Duand Miller, 2007a, 2007b; Rai, 2012; Yin et al., 2012; Zhang et al., 2013; Jin et al., 2014; Zhang, 2014; Li et al., 2015; Zhang et al., 2015;Shrimali et al., 2016; Karatas et al., 2017). In general, the hydrophilicsurfaces, which are well wetted by water, have oriented water dipoles.Very hydrophobic surfaces exhibit a“water exclusion zone,” smallerresidence time for interfacial water, and reduced H-bonding. In thisway, the wetting characteristics of selected spodumene surfaces areexamined, and hydrophobic surfaces distinguished from hydrophilicsurfaces. Also, even though many studies have been carried out to in-vestigate the interaction between collectors and spodumene, the ad-sorption states of the collectors are still not clear, due to lack of a directdetection method. The adsorption of collectors and their adsorptionstates at mineral surfaces is vital for improved spodumene flotationtechnology. In this regard, the adsorption of collectors and properties ofthe adsorbed layers at the spodumene surface can be examined usingSFVS, a powerful tool for probing molecular structure at interfaces andsurfaces (Shen and Ostroverkhov, 2006; Wang et al., 2008,2010,2015;Zhang et al., 2015; Li et al., 2017; Shrimali et al., 2017). In order to obtain a better understanding of spodumene flotationfundamentals, the wetting characteristics of spodumene, particularlythe interaction between water molecules and spodumene surfaces, aswell as the adsorption of NaOL and dodecylamine (DDA), have beenstudied using MD simulation and SFVS to reveal the interfacial waterstructure, and the configuration of adsorbed molecules at the basal andthe main cleavage surfaces of spodumene. It is intended that these re-sults will provide fundamental understanding and further insights withrespect to spodumene flotation chemistry, including the wettability ofsurfaces, the nature of the water structure, collector organization forselective flotation, etc., as well as determine the correlation of chemi-sorption of NaOL with the wetting characteristics of surfaces. 2. Materials and methods 2.1. Chemicals and materials The spodumene crystals used for the contact angle measurementsand SFVS measurements were obtained from Koktokay, XinjiangProvince, China. The single crystal was cut into four crystals with thedesired surface planes (1 10, 001,010, and 100), which were con-firmed by X-ray diffraction analysis, and the peaks are shown in Fig. 1.For each experiment, the crystal surfaces were polished with a micro-cloth using a MasterPolish II Alumina suspension purchased fromBuehler, and cleaned with acetone, methanol, and deionized (DI) water,followed by blow drying with high-purity nitrogen, and finally treatedwith plasma. DI water with a minimum resistivity of 18.2 MQ.cm wasused in all experiments, and was obtained from a Millennium waterpurification system. DDA (99%, ACROS organics), NaOL (> 97.0%,TCI), and NaOH (98%, Mallinckrodt) were used as received. 2.2.1. Contact angle and bubble attachment time measurements Contact angle measurements were carried out with a Rame-Hartgoniometer (Rame-Hart, Succasunna, NJ) using the sessile drop andcaptive bubble techniques. Clean spodumene surfaces without collectorwere used for the natural contact angle measurements. Before sessiledrop contact angle measurements were made, the crystals were pre-pared by conditioning in 2x10⁻⁴M DDA (pH=8.5-9.0) or 6×10⁻⁴MNaOL solutions (pH=8.5-9.0) for 40 min at room temperature ofabout 24℃. In the case of captive bubble contact angle measurementsat mineral surfaces, after conditioning crystals in collector solutions for40 min, the measurements were done in the same collector solutions.The stable contact angle was obtained when the attached sessile drop orbubble reached equilibrium. Bubble attachment time was measuredusing a high-speed camera (1000 frames per sec) from Eastman KodakCo., Rochester, NY. All measurements were repeated 10 times, and theaverage values were obtained. The maximum experimental variation incontact angle values was ± 1°. 2.2.2. Molecular dynamics (MD) simulations After the initial configuration, energy minimization was processedfor each system. The minimized system was simulated in an NVT en-semble using an Andersen thermostat (Martyna et al., 1996) with thepressure fixed at O Gpa and the temperature fixed at 298 K. The time step for all MD simulations was 1 fs. A final simulation time of 4 ns,including a 3 ns equilibration period, was performed, from which thelast 500 ps of simulation data was used for further analysis. 2.2.3. Sum frequency vibrational spectroscopy (SFVS) A sum-frequency generation spectrometer, model EKSPLA Ltd(Vilnius, Lithuania, Baltic States), was used for the spodumene sur-faces/collectors experiments. The visible beam at 532 nm, pulse dura-tion 20 ps, was generated after frequency doubling from the solid statemode-locked Nd: YAG laser (Continuum Surelite II) using a KTP(KTiPO4) crystal. The tunable IR beam was generated in an opticalparametric generator (OPG), based on an LBO nonlinear crystal with anAgGaS2 crystal of a difference frequency generation (DFG) extensionsystem from Laser Vision (Bellevue, WA), and pumped with the fun-damental output of Nd: YAG laser generating 1064 nm pulses at 10 Hz,with a pulse duration of 7 ns and an energy of 500 mJ/pulse. A poly-styrene sample was used to calibrate the OPG system. The visible and IRbeams were overlapped spatially at the solid/air interface over an areaof ca. 500 um in diameter and also overlapped temporally by using anoptical delay line in the path of the visible beam. The incident angles ofthe visible and IR beams at the interface were 60° and 55°, respectively,and the sum-frequency signal was collected in reflection at an angle ofabout 60°, passed through collimating optics, a holographic notch filter(wavelength: 532 nm, band width: <10 nm, optical density:>4)(Keiser Optical Systems, Inc.), Glan polarizer, and was focused on theentrance slit of a monochromator. A photomultiplier tube and a gatedelectronics system were used for the detection and collection of theSFVS signal. The spectra were recorded in SSP polarization (S: sum-frequency, S: visible, P: infrared), at 2 cm-1increments and each pointis the average of 100 laser shots. All spectra were obtained at a constanttemperature of 24℃. 3. Results for wetting in the absence of collectors 3.1. Contact angles Bubble attachment at selected spodumene surfaces in the absence ofcollectors did not occur, and consequently captive bubble contact angleandbubble-particle attachment time measurements were not made. Thesimulated contact angles at the surfaces were calculated in the X-Zprojection (left and right sides, separately) and Y-Z projection (left andright sides, separately), and the average of the four values is the finalcontact angle value. The results for experimental and simulated sessiledrop contact angles for selected spodumene surfaces are shown inTable 2 for DI water at a natural pH of 5.0-7.0. It is obvious that thedifferences in the contact angles for DI water at the crystal surfaces arenot significant. The (100) and (110) surfaces are more hydrophobiccompared with the (001) and (010) surfaces. However, all of thesesurfaces should be defined as naturally hydrophilic due to such smallcontact angle values. MD simulation snapshots of water droplets at thesurfaces of the spodumene crystal in the x-z plane are presented inFig. 2. As can be seen from Fig. 2, the water droplets spread and almostcompletely wet the spodumene surfaces, and the simulated sessile drop Table 1Simulation parameters and number of water molecules. System Contact angle simulations Interfacial water structure Charge (e) Spodumene surfaces Cell size (A) Number of water molecules Cell size (A) Number of water molecules Crystal Water X×Y×Z XXY×Z (110) 82.9×100.5×120 400 41.5×37.7×218 4530 Mulliken Charges calculated from H: 0.4238 (001) 100.5×100.5×120 400 37.7×37.7×218 4000 CASTEP O:-0.8476 (010) 103.6×108.7×120 400 41.5×36.2×218 3950 (100) 98.9×103.6×120 400 41.2×41.5×218 4730 Table 2 Contact angles at selected spodumene surfaces in DI water, pH=5.0-7.0. Surfaces (110) (001) (010) (100) Experimental sessile drop contact angle () 15.0 10.0 13.0 16.0 MD simulated sessile drop contact angle (°) 13.0 11.0 12.5 17.5 contact angles are very close to the experimental values, confirming thehydrophilic characteristics of the spodumene surfaces, as well as in-dicating that the simulated surfaces well represent the real surfaces. 3.2. Interfacial water structures The contact angle results showed that the four selected surfaces ofspodumene were naturally hydrophilic. Thus, the water structure wasanalyzed for detailed information on the wetting characteristics ofspodumene surfaces in order to see if there were differences at thesesurfaces. MD simulation snapshots of the equilibrated water/spodu-mene surfaces in the x-z and y- planes are shown in Fig. 3. It is ob-vious that there is direct coupling of water molecules at the surfaces.The relatively strong water/surface interaction on the molecular scale isthe origin of the macroscopic hydrophilic character of the spodumenesurfaces. More details of the interfacial water structure at selectedspodumene surfaces will be provided in the following sections. 3.2.1. Water density profiles The density distributions of oxygen and hydrogen atoms of watermolecules along the normal to spodumene surfaces are plotted in Fig. 4.As expected, due to the natural hydrophilicity of spodumene surfaces,water molecules have strong interactions with atoms at the surfaces asindicated by the close distance between the water molecules and sur-faces. The primary peak of the curves means that the water in this in-terfacial region is more condensed than in the bulk. The water densitypeaks for these surfaces are located within 3.0 A from the surface, andthis distance is close to the distance (~2.8A) between hydrogen-bonded water/water molecules (Dang and Pettitt, 1990; Rasaiah andZhu, 1990; Lee and Rasaiah, 1996), demonstrating strong interactionsbetween the water molecules and surfaces. The interaction of watermolecules with atoms at the four surfaces is almost similar, indicated bythe similar distance between the surface and the primary water densitypeak. In addition, the distance between the location where the relativedensity of oxygen/hydrogen atoms begins to increase from zero, andthe surface, can provide further information for the water structures atthe surfaces. Although the relative number density curves for oxygen(O) and hydrogen (H) atoms appear to be similar, the relative numberdensity for O atoms starts to increase from zero, ahead of that for H atoms at the (110) surface, indicating that the O atoms of the primarywater layer are oriented closer to the surface, which implies a stronginteraction of O atoms of the primary water layer with atoms at the(110) surface. On the contrary, a stronger interaction of H atoms thanO atoms of the primary water layer with atoms at the (001) and (100)surface is revealed. In the case of the (010) surface, the curves for therelative number density of O and H atoms are almost overlapped nearthe surface, showing that the O and H atoms of the primary water layerare located almost the same distance from the surface. There are plentyof electron donor/acceptor sites because of the polarity of the surfaceatoms such as lithium (Li), aluminum (Al),O, and silicon (Si), whichinteract with O and H atoms of water molecules, and contribute to thedifferent orientation of primary water molecules. 3.2.2. Radial distribution functions The H2O-H2O radial distribution functions for water moleculesprovide information about the water structure and molecular order.Asshown in Fig. 5, all the curves have two notable peaks at radii of0.975 A and 1.495 A, representing the first tight layer and second layerof water molecules, respectively. The two water layers have a distancebetween them of about 0.50 A, indicating that the two tight atoms arefrom different water molecules. The first peaks for water at the (1 00)and (010) surfaces are slightly higher than for the other systems, in-dicating that the water structure is denser on the (100) and (010)surfaces. The first peak for the (110) surface is the lowest, indicatingthat there are less numbers of water molecules at this distance awayfrom one referenced water molecule and H20-H20 interaction isweaker. The radial distribution functions for atoms at the surfaces withwater molecules are shown in Fig. 6. As the main active sites whichinteract with collectors, the O and Al atoms are chosen for further in-formation. The curved shapes are similar for the O-H20 and the Al-H2Oradial distribution functions. It is noted that for the Al-H20 radial dis-tribution functions, the primary peaks are located closer to the (110)and (100) surfaces than to the (001) and (010) surfaces, which mightbe due to the fact that the Al sites at the (110) and (100) surfaces areexposed and closer to the surface, while the Al sites are buried a littledeeper at the(001) and (010) surfaces, as shown in Figs. 2-3. It can beconcluded from the water density profiles and H2O-H2O radial dis-tribution function results that the H20-H2O interaction and the H2O-surface interaction is different and complicated in different spodumenesurface systems. The radial distribution functions provide partial in-formation about the water structure, but are incapable of interpretingthe exact structures of the water molecules in different systems. Thedistribution of hydrogen bonds for water molecules is a useful supple-ment for the results of the radial distribution functions, which is ana-lyzed in the following section. 3.2.3. Hydrogen bonds Spodumene Surface Fig. 3. Molecular dynamics snapshots of equilibrated water/spodumene surfaces. The color code of the atoms is as follows: red-O,yellow-Si, pink-Al, violet-Li, andwhite-H. (For interpretation of the references to colour in this figure legend, the reader is referred to the web version of this article.) Distance from Surface (A) Fig. 4. Density profiles of water molecules at selected spodumene surfaces along the z-axis. Fig. 5. Intermolecular H2O-H2O radial distribution functions at selected spo-dumene surfaces. distribution functions, hydrogen bonding between water molecules, aswell as between interfacial water molecules and surface oxygen atoms,is a crucial parameter for describing the characteristics of water mo-lecules. For the SPC/E water model, two water molecules are defined ashydrogen bonded if the distance between the two O atoms is less than3.5 A and the O-O-H angle is simultaneously less than 30° (Luzar andChandler, 1996). The distribution of the average number of hydrogenbonds per water molecule along the surface normal for selected spo-dumene surfaces is shown in Fig. 7. From the surface to the bulk water,the average number of hydrogen bonds per water molecule grows untilit peaks with a value around 3.50, which is the same value as previouslyreported (Nieto-Draghi et al., 2003). For the (110) surface, there arehydrogen bonds formed about 0.3 A from the surface, closer than thatfor the other surfaces. The number of hydrogen bonds for hydrogenatoms of interfacial water molecules andO atoms at surfaces have beencalculated and listed in Table 3. The hydrogen bonds of surface O atomsreveal the extent of their interaction with water molecules.As shown inTable 3,O atoms at the surfaces participate in the formation of hy-drogen bonds with water molecules in the primary water layer, in-dicating that O atoms are active sites and contribute to the hydrophilicstate of the surfaces, to some extent. Fig. 6. Radial distribution functions for O-H20 (left) and Al-H20 (right) at selected spodumene surfaces. 3.2.4. Orientation considerations The water structure at selected spodumene surfaces can be studiedfurther from water dipole moments and hydrogen position distribu-tions. Angle α (0° to 180°) is defined as the angle between the waterdipole moment and the surface normal. Angle β (0°to 90°) is the angleof the two H atom positions with respect to the surface normal (Zhanget al., 2013; Zhang, 2014). The water dipole moment and hydrogenposition distribution contours for selected surfaces are shown in Fig. 8.For the (110) surface, a weak peak for angle a, corresponding to theprimary water layer, occurs from 40° to 60°, and almost all the angles awithin this region are smaller than 90°, showing that most O atoms ofthe water molecules face toward the surface. In the same region, theangle B covers a range from 55° to 90°, implying that partial watermolecules are close to being parallel to the surface. As a result, most Oatoms of the water molecules face toward the surface, and a portion ofthe water molecules are oriented with one H atom facing toward thesurface, while the other water molecules have their two H atoms facingaway from the surface. This result is consistent with the water densitydistribution results which reveal that the O atoms of the primary watermolecules are oriented closer to the surface. At the (001) surface, thereis a density peak for angle a representing the primary water layer oc-curring from about 60° to 100°, indicating that a majority of watermolecules are oriented with their O atoms facing toward the surface,while a few water molecules have their O atoms facing away from thesurface. In the same region, the angle p ranges from 30° to 50°, showingthat the water molecules of the primary water layer are nearly per-pendicular to the surface. Consequently, most of the water molecules ofthe primary water layer are oriented with these H atoms facing towardthe surface. In the case of water molecules at the (010) surface, theangle a has two density peaks occurring from 50° to 80°, centering at70°, and from 85° to 110°, centering at 90°, corresponding to the pri-mary and secondary water layers, respectively. The hydrogen positionorientation (angle B) ranges from 15° to 90°, with the highest densitycentering near 52°. This indicates that in the primary layer of watermolecules, partial H atoms and partial O atoms face toward the surface.For the (100) surface, the angle a corresponding to the primary waterlayer ranges from 140° to 165°, and the angle B ranges from 65° to 90°,indicating that the oxygen atoms of the water molecules are orientedaway the surface, and the water molecules in this region are close tobeing parallel to the surface. Consequently, the majority of water mo-lecules of the primary water layer are oriented with one hydrogen atomfacing toward the surface. In conclusion, some O and H atoms of theprimary water layer face toward the (110) and (010) surfaces, whilefor the (1 00) and (001) surfaces, it is the majority of H atoms that facetoward the surfaces. The interaction of surface atoms with water Fig. 7. Distribution of hydrogen bonds per water molecule along the surface normal for selected spodumene surfaces. Hydrogen bonds of oxygen atoms at selected spodumene surfaces with watermolecules. Number of hydrogen bonds Number of oxygen atoms at different surfaces per oxygen atom at surfaces with water molecules (110) (001) (010) (100) 81 127 2 3 0 molecules contributes to these orientation characteristics. 3.3. Summary based on contact angles and interfacial water structure It is found that the spodumene surfaces all have the same wettingcharacteristics, and one surface could not be distinguished from theothers, as all the surfaces have contact angles of 10-20°. The interfacialwater structures show variation at different surfaces, as summarized inTable 4. The distinct surface atoms at selected spodumene surfacescontribute to these wetting and interfacial water structure character-istics. The correlation between the surface atoms, wetting, interfacialwater structure and collector adsorption will be discussed in the nextsection. 4. Results for wetting in the presence of collectors The wetting characteristics of selected spodumene surfaces in thepresence of collectors were studied with respect to experimental contactangles and bubble attachment times, as well as the spectroscopic fea-tures of adsorbed collectors, as discussed in the next sections. 4.1. Contact angle and bubble attachment time results As previously mentioned, all of the selected surfaces are naturallyhydrophilic as indicated by the small contact angle values. In the pre-sence of collectors, however, the results become considerably different,as shown in Table 5. The variation in sessile drop and captive bubblecontact angles at spodumene surfaces is consistent. For example, the captive bubble contact angles for the (100) and(110) surfaces of spodumene in 6× 10⁻⁴M NaOL at room temperatureof 24℃ are 78° and 75°, respectively, while much smaller values of 40°and 35°are obtained for the (001) and (010) surfaces. In the case ofbubble attachment time, the (100) and (110) surfaces have muchsmaller values of 36 ms and 44 ms, respectively, compared with the(001) and (010) surfaces which have values of 198 ms and 203 ms,respectively. These results indicate that the hydrophobicity of the sur-faces has varied as a consequence of the preferential adsorption ofNaOL at the (100) and (110) surfaces compared to the (001) and(010) surfaces. In 2×10⁻⁴M DDA solution, these surfaces exhibit similar hydro-phobicity with nearly the same contact angle values and bubble at-tachment time values, suggesting that there is no preferential adsorp-tion of DDA at these surfaces. For example, the captive bubble contactangle for DDA is about 80°, regardless of the spodumene surface plane.Interestingly, it should be noted that for adsorption of DDA at thesesurfaces, the captive bubble contact angles are larger than the sessiledrop contact angles. In general, the sessile drop contact angles (ad-vancing contact angles) should be larger than the captive bubble con-tact angles (receding contact angles). There may be two reasons for thisunusual result. One reason may be that in the case of sessile dropcontact angle measurements, surfaces with DDA adsorption were driedin air prior to measurements, and this procedure may have disorderedthe adsorption, resulting in smaller sessile drop contact angle results.The other reason may be that in the case of captive bubble contact anglemeasurements, DDA molecules may be adsorbed at the air bubble/so-lution interface and then transferred to the spodumene surface duringbubble attachment, as discussed in the literature (Niecikowska et al.,2011; Wang and Miller, 2018), giving rise to larger captive bubblecontact angles. 4.2. Spectroscopic features of adsorbed collectors Contact angle measurements and MD simulation results reveal thatthe spodumene surfaces are naturally hydrophilic, and water structureson different surfaces are distinct. As previously stated, there are nosignificant differences in the contact angles of DI water at the fourcrystal surfaces. In the case of the collector system, there is preferential Hydrogen Position Distance (A) Distance (A) Fig. 8. The distribution of (A) water dipole moment (angle a) and (B) hydrogen position (angle B) of water molecules at the selected surfaces. adsorption of NaOL on the (100) and (110) surfaces compared to the(001) and (010) surfaces, but no preferential adsorption of DDA isobserved. Obviously, different surface states account for these results,and the nature of the NaOL or DDA certainly is an important factor forfurther consideration. SFVS is a powerful tool for probing molecularstructure at interfaces and surfaces, and is ideally suited for studies ofcollector adsorption at mineral surfaces, due to its high surface speci-ficity and sensitivity. To provide a basis for the analysis of the adsorption state with respect to the NaOL or DDA collectors, SFVSstudies were conducted. Instead of a solid/aqueous interface, the statesof collectors at a solid/air interface were studied, due to the lack ofsuitable mineral crystals required for in-situ SFVS experiments.Consequently, the available mineral crystals with selected surfaces wereconditioned in the collector solutions for 40 min, and then dried in airfor the SFVS experiments. The (110) and (001) surfaces, as thecommon cleavage surface and basal plane surface,respectively, which Interfacial water structure Spodumene surfaces (110) (001) (010) (100) Water density profiles Strong interactions between water molecules and all surfaces O atoms are closer to the surface H atoms are closer to the surface H and O atoms are almost the samedistance from the surface H atoms are closer to the surface Radial distribution functions Water structure is loosest Water structure is moderately looser Water structure is denser Water structure is denser Hydrogen bonds 0atoms at all the surfaces participate in the formation of hydrogen bonds with water molecules Orientation considerations O and H atoms face towardthe surface A majority of H atoms face towardthe surface O and H atoms face toward the surface A majority of H atoms face towardthe surface Contact angles and bubble attachment times at selected spodumene surfaces inDI water (pH=5.0-7.0) and collector solutions(6x 10⁻⁴ ]MNaOLand2×10-4 MDDA,pH=8.5-9.0). Surfaces Contact Angle() Bubble attachment time (ms) Sessile drop Captive bubble NaOL DDA NaOL DDA NaOL DDA (110) 73 64 74 82 48 157 (001) 32 67 34 81 204 163 (010) 30 63 37 80 213 156 (100) 80 65 78 80 41 169 behave differently in the NaOL and DDA collector systems, as revealedby the contact angle measurement results, were selected for the SFVSstudies.The structure of collector molecules at an interface can be de-scribed by the gauche defects present in the alkyl chains. If the mole-cules at the interface are predominantly in the trans conformation theyare assumed to have a high degree of order, whereas if many of themolecules have gauche defects, the collector molecules are consideredto have a lower degree of order (Gragson et al., 1997). Fig. 9.Sum-frequency vibrational spectra (SSP) of adsorbed NaOL at the spo-dumene (110) and (001) surfaces (Ex-situ, spectra normalized to visible andinfrared laser energy). 4.2.1. Spectroscopic features of adsorbed NaOL The SFVS spectra for NaOL adsorption at the (110) and (001)surfaces from a 6× 10⁻⁴M NaOL solution at pH 8.5-9.0 are shown inFig. 9. At the spodumene (110) surface, the NaOL spectrum is domi-nated by two peaks which have been assigned to the CH symmetricstretch, CH-SS (2880 cm), and the CH Fermi resonance, CH-FR(2945 cm). There is little or no intensity from the CH2 symmetricstretch (CH2-SS), CH2 asymmetric stretch (CH2-AS), or CH2 Fermi re-sonance (CH2-FR). These spectral characteristics indicate that the mo-lecules have a high degree of order and nearly no gauche defects. Thecaptive bubble attachment time of 48 ms indicates a hydrophobic sur-face state that further supports a well organized NaOL monolayer at the(110) surface. In the case of the spodumene (001) surface, however, aconsiderably different spectrum is observed for NaOL, with few or nopeaks found, suggesting that NaOL is not adsorbed at this surface,randomly oriented at the surface, or that the adsorption cannot beobserved. The captive bubble contact angle of 34° at the (001) surfaceconfirms poor NaOL adsorption as well. 4.2.2. Spectroscopic features of adsorbed DDA The SFVS spectra for DDA adsorption at the (110) and (001)surfaces from a 2× 10⁻⁴M DDA solution at pH 8.5-9.0 are shown inFig. 10. It is obvious that the spectra for DDA adsorption at the (110)and (0 01) surfaces are almost the same. Similar to the NaOL spectra atthe spodumene (110) surface, the spectra for DDA adsorption at the Fig. 10. Sum-frequency vibrational spectra (SSP) of adsorbed DDA at the spo-dumene (110) and (001) surfaces (Ex-situ, spectra normalized to visible andinfrared laser energy). (110) and (0 01) surfaces are both dominated by two peaks assigned toCHg-SS (2880cm), and CH-FR (2945 cm-). In addition, there aresome small shoulders around the CHg-SS (2880 cm), which might beattributed to noise. Based on the SFVS spectra, the proposed organi-zation of the collector structures for the spodumene (110) and (001)surfaces are shown in Fig. 9 for NaOL and Fig. 10 for DDA. 4.3. Discussion and summary based on contact angles and adsorbedcollectors In the absence of collectors, contact angle measurement and MDsimulation results show similar natural hydrophilicity of the spodu-mene surfaces. In the presence of collectors, SFVS results reveal that thestate of NaOL adsorbed on the (110) and (001) surfaces is different,with a higher degree of order on the (11 0) surface, which confirms thepreferential adsorption of NaOL at the (110) surface. The preferentialadsorption of NaOL might be due to natural surface states and/or in-terfacial water structure. The interfacial water structure features in-clude packing density of water, the interaction of water with water andwith surfaces, and the orientation of interfacial water molecules. If thepacking density of water contributed to the collector adsorption states,NaOL should be well adsorbed on the (001) surface and be poorlyadsorbed on the (100) surface, since the water structure at the (1 00)surface is more loosely packed than that at the(001) surface. The factis that there is more NaOL adsorbed on the (100) surface than on the(001)Ssurface, as revealed by contact angle measureFurthermore, the interaction of water with the surfaces, and the or-ientation of interfacial water molecules might contribute to the col-lector adsorption states. Since the MD simulation results show that forthe (100) and (00 1) surfaces, the majority of H atoms face toward thesurfaces, it can be predicted that the (100) and (001) surfaces aresimilar and might not favor the adsorption of anionic NaOL. However,the fact is that the (100) surface is very favorable for the NaOL ad-sorption when compared to adsorption at the (001) surface, as re-vealed by contact angle results and SFVS spectra. It seems that theseinterfacial water structure features do not significantly affect the stateof NaOL/ DDA adsorption. Though the surfaces and interfacial water structures are distinct atthe atomic level, the interfacial water structures cannot be well con-nected with collector adsorption states. The nature of surface states(such as surface metal ion distribution and surface charge) seems tocontribute to collector adsorption states at different surfaces. As pre-viously studied (Moon, 1986; Rai et al., 2011; Zhu et al., 2015; Xuet al.,2017), there are Al sites on the surface that are responsible for the in-teraction of NaOL with spodumene surfaces. As shown in Table 6,thereare Al atoms with two and three broken bonds at the (110) and (100) surfaces, respectively, and the Al-0 broken bond density on these twosurfaces is greater than that at the (010) and (001) surfaces whichhave Al atoms with two and one broken bonds, respectively. Therefore,the surface with more unsatisfied Al sites and greater Al-O broken bonddensity is more favorable for chemisorption of NaOL, which is thereason for greater contact angle values for the (100) and (110) sur-faces than those for the (010) and (001) surfaces. However, it shouldbe noted that both the (110) and(010) surfaces have 2 Al-O brokenbonds per Al, and also the densities of Al-0 broken bonds at the (110)and (010) surfaces are very close, but NaOL adsorption at both surfacesis good. The broken bonds are Al-01 at the (110) surface and Al-02 atthe (010) surface, leaving Al sites with 0.84 and 1.16 unsaturatedelectrostatic charges for the (110) and (010) surfaces, respectively.Therefore, the (010) surface should be more favorable for NaOL ad-sorption, as it has more unsaturated electrostatic charges, which is in-consistent with the contact angle results. Furthermore, it should benoted that the surroundings and spatial locations of Al sites at the(110) and (010) surfaces are different. It can be seen from Figs. 2-3that Al sites are entirely exposed at the (110) surface, while Al sites areburied a little deeper at the (010) surface. The surroundings of Al sitesat the (010) surfaces have steric hindrance, which may make it hard toaccommodate NaOL for chemisorption at the (010) surface. As a result,there is preferential NaOL adsorption at the (110) surface compared tothe (010) surface. There are no significant differences in contact anglevalues for the surfaces with DDA as collector, and this might be due tonegatively charged surfaces of spodumene (Moon,1986), which favorthe adsorption of cationic DDA. Thus, it is concluded that electrostaticadsorption contributes little to NaOL adsorption at the spodumenesurfaces, and that the unsaturated Al sites at the spodumene surfacesaccount for chemisorption of NaOL. However, for cationic DDA ad-sorption, the electrostatic attraction appears to be the main drivingforce giving rise to similar adsorption at all spodumene surfaces. 5. Summary and conclusions In the absence of collectors, all four surfaces exhibit a natural hy-drophilicity with 10° to 20° water contact angles. MD simulationsconfirmed the experimental contact angle results. The water densitydistributions show that the water molecules have close interactionswith atoms at the crystal surfaces. The H2O-H2O radial distributionfunctions for water molecules at different spodumene surfaces revealthat the water molecules are densely packed on the surfaces, with thepacking of the water structure being looser on the (110) surface anddenser on the (100) and (010) surfaces. The hydrogen bond resultsshow that oxygen atoms at the surfaces are active sites that participatein the formation of hydrogen bonds with water molecules in the Items (110) Surfaces *(010) (100) (001) Contact angles in DI water () 15 13 16 10 Contact angles in NaOL system () 73 30 80 32 Contact angles in DDA system () 64 63 65 67 Broken bonds per A1 2 (Al-O1) 2 (Al-02) 3 (2A1-01,1Al-02) 1 (Al-O1) Number of Al-0 broken bonds per 2 2 6 1 area (NAl-o) Al-O Ionic Bond Strength 0.42 (Al-O) 0.58(Al-02) 0.42 (Al-O); 0.42 (Al-O) (valence) 0.50 (Al-01); 0.58 (Al-02) Calculation of surface area A A=5.1815×6.2821×sin105.51 A=5.1815×9.4869 × sin110.74 A=5.1815×8.2376× sin90 A =6.2821 × 6.2821 × sin81.94 (×10-20m²) Density of surface Al-0 broken bonds DAl-o (×108m) 2.6781 2.5233 7.0285 1.0769 primary water layer, and contribute to the hydrophilic surface states.The water dipole moment and hydrogen position distribution contoursfor the (001),(110),(100) and (010) surfaces of spodumene showthat some oxygen and hydrogen atoms of the primary water layer facetoward the (110) and (010) surfaces, while for the (100) and (001)surfaces, the majority of hydrogen atoms face toward the surfaces. In the presence of collectors, the hydrophobicity of the surfacesvaries due to the preferential adsorption of NaOL on the (100) and(110) surfaces compared to adsorption at the (001) and (010) sur-faces. In contrast, with DDA as collector, the four surfaces exhibit si-milar hydrophobicity with nearly the same contact angle and bubbleattachment values. SFVS results reveal that the NaOL adsorbed on the(1 10) surface is ordered to a higher degree than on the (001) surface,confirming the preferential adsorption of NaOL on the (110) surface.There are no significant differences in the DDA adsorption at these twosurfaces. There is no obvious correlation between natural hydrophilicity ofspodumene surfaces and NaOL/DDA adsorption, according to the con-tact angle measurements and MD simulations. It is the natural state ofthe surfaces, such as surface atomic sites, that contributes to the distinctwater structure and the adsorption state of collectors. Based on MDsimulation and SFVS results, it seems that unsaturated Al sites of thespodumene surfaces and their spatial locations account for chemisorp-tion of NaOL at pH 8.5-9.0. For the cationic DDA adsorption at pH8.5-9.0, the electrostatic attraction appears to be the main driving forcegiving rise to adsorption at the spodumene surfaces. Declarations of interest None. Acknowledgements The authors are thankful for the support of the National NaturalScience Foundation of China (Grant No.51674290 and No. 51504291),the China Scholarship council (Grant No. 201606370130), and theFunds for Postgraduate Innovation Project of Central South University(Grant No. 2016zzts107). References ( B ere n d s en, H . J.C., v an Gunsteren, W . F., Eg berts, E . , D e V lie g , J . , 1987. Dyn a mic s i mu - l a t ion of compl e x m olecular s ystems. I n : Supercomp u t e r R e se arch in C h emistry and Chemical En gi n e erin g . ACS Sympo s ium Series, vol. 3 53. American Chemical Society,Washington, D.C. , USA, pp. 1 06 - 122. ) ( C ameron, M. , S u e n o , S. , P r e w i tt, C . T ., Pa p i k e, J. J ., 1 9 73. H i g h- Temperature cryst a l chemis t ry of acmite, d i opside, hedenbergi te, j ad eite , spodum e ne, an d ure y ite. A m. Mi n eral. 58 , 594 - 618. ) ( D ang , L . X . , P ettitt, B.M. , 1 990. A theoretical study o f l i ke ion pairs in s olution. J . P hys. Chem. 94,4303-4308. ) ( D u, H . , M i l ler, J . D ., 2007a. A molecu la r dynamics simula t ion study of wa t er structure a nd a dsorpti o n states a t t alc su r faces. Int . J . Min e r . Proc e ss. 84, 172- 1 84. ) Du, H., Miller, J.D.,2007b. Interfacial water structure and surface charge of selected ( alkali chloride salt crystals in saturated solutions : a molecu l ar d ynamics m odeling stu dy . J . Phys . Chem . C 111 , 10013- 1 0022. ) ( E van s , K . , 2013. L ithium. I n: Critica l M etal s Handbook. John Wi l ey & S ons, Oxford, U K , p p. 230-260. ) Fuerstenau, M.C., Han,K.N. (Eds.), 2003. Principles of Mineral Processing. SME, Littleton,CO, USA. Gallo, P., Rapinesi, M., Rovere,M., 2002. Confined water in the low hydration regime.J.Chem. Phys. 117, 369-375. Gragson, D.E., McCarty, B.M., Richmond, G.L., 1997. Ordering of interfacial water mo-lecules at the charged air/water interface observed by vibrational sum frequencygeneration. J. Am. Chem. Soc. 119, 6144-6152. Gruber, P.W., Medina, P.A., Keoleian, G.A., Kesler, S.E., Everson, M.P., Wallington, T.J.,2011. Global lithium availability: a constraint for electric vehicles? J. Ind. Ecol. 15,760-775. He,G., Xiang, H., Jiang, W., Kang, Q., Chen, J., 2014. First-principles theory on electronicstructure and floatability of spodumene. Rare Met. 33,742-748. Jin, J., Miller, J.D., Dang, L.X., 2014. Molecular dynamics simulation and analysis ofinterfacial water at selected sulfide mineral surfaces under anaerobic conditions. Int.J. Miner. Process. 128, 55-67. Karatas, D., Tekin, A., Celik, M.S., 2017. Density functional theory computation of organic compound penetration into sepiolite tunnels. Clays Clay Miner. 65,1-13. Kesler, S.E., Gruber, P.W.,Medina, P.A., Keoleian, G.A., Everson, M.P., Wallington, T.J.,2012. Global lithium resources: relative importance of pegmatite, brine and otherdeposits. Ore Geol. Rev. 48, 55-69. Lee, S.H., Rasaiah, J.C., 1996.Molecular dynamics simulation of ion mobility. 2. Alkalimetal and halide ions using the SPC/E model for water at 25℃. J. Phys. Chem. 100(4),1420-1425. Li,E., Du, Z., Yuan, S., Cheng,F., 2015. Low temperature molecular dynamic simulationof water structure at sylvite crystal surface in saturated solution. Miner. Eng. 83,53-58. Li,E., Wang, X., Du, Z., Miller, J.D., Cheng,F., 2017. Specific anion effects on adsorptionand packing of octadecylamine hydrochloride molecules at the air/water interface.Colloids Surf. A: Physicochem. Eng. Asp. 522, 544-551. Liu, W., Zhang, S., Wang, W., Zhang,J., Yan, W., Deng,J., Feng, Q., Huang, Y., 2015. Theeffects of Ca(II) and Mg(II) ions on the flotation of spodumene using NaOL. Miner.Eng. 79, 40-46. Luzar, A., Chandler, D., 1996. Effect of environment on hydrogen bond dynamics in liquidwater. Phys. Rev. Lett. 76, 928-931. Martin, G., Rentsch, L., Hock, M., Bertau, M., 2017.Lithium market research-global supply, future demand and price development. Energy Storage Mater. 6, 171-179.Martyna, G.J., Tuckerman, M.E., Tobias, D.J., Klein, M.L., 1996. Explicit reversible in- tegrators for extended systems dynamics. Mol. Phys. 87, 1117-1157.Menendez, M., Vidal,A., Torano, J., Gent, M., 2004. Optimisation of spodumene flota- tion. Eur. J. Miner. Process. Environ. Prot. 4, 130-135. Mohr, S.H., Mudd, G., Giurco, D., 2012. Lithium resources and production: critical as-sessment and global projections. Minerals 2, 65-84. Moon, K., 1986. Surface and crystal chemistry of spodumene and its flotation behavior.PhD Thesis. University of California, Berkeley, UMI, Ann Arbor, MI, USA. Moon,K.S., Fuerstenau, D.W., 2003. Surface crystal chemistry in selective flotation ofspodumene (LiAl[SiO3]2) from other aluminosilicates. Int. J. Miner. Process. 72,11-24. Niecikowska, A., Zawala,J., Malysa, K., 2011. Influence of adsorption of n-alkyltrimethyl-ammonium bromides (C8, C12,C16) and bubble motion on kinetics of bubble at-tachment to mica surface. Physicochem. Probl.Miner. Process. 47, 237-248. Nieto-Draghi, C., Bonet Avalos, J., Rousseau, B., 2003. Transport properties of dimethylsulfoxide aqueous solutions. J. Chem. Phys. 119, 4782-4789. Payne, M.C., Teter, M.P., Allan, D.C., Arias, T.A., Joannopoulos, J.D., 1992. Iterativeminimization techniques for ab initio total-energy calculations: molecular dynamicsand conjugate gradients. Rev. Mod. Phys. 64, 1045-1097. Rai, B., Sathish, P., Tanwar, J., Pradip, Moon, K.S., Fuerstenau, D.W., 2011. A moleculardynamics study of the interaction of oleate and dodecylammonium chloride surfac-tants with complex aluminosilicate minerals. J.Colloid Interface Sci. 362, 510-516. Rai, B. (Ed.), 2012. Molecular modeling for the design of novel performance chemicalsand materials. CRC Press Boca Raton, FL, USA. Rasaiah, J.C., Zhu, J., 1990. Cavity functions and association in models for weak elec-trolytes and sticky hard spheres. J. Chem. Phys. 92, 7554-7564. Rustad, J.R., 2001. Molecular models of surface relaxation, hydroxylation, and surfacecharging at oxide-water interfaces. Rev. Mineral. Geochem. 42, 169-198. Shen, Y.R., Ostroverkhov, V., 2006. Sum-frequency vibrational spectroscopy on water interfaces: polar orientation of water molecules at interfaces. Chem. Rev.106,1140-1154. Shrimali, K., Jin,J., Vaziri Hassas, B., Wang, X., Miller, J.D., 2016. The surface state ofhematite and its wetting characteristics. J. Colloid Interface Sci. 477, 16-24. Shrimali, K., Yin, X., Wang,X., Miller, J.D., 2017. Fundamental issues on the influence ofstarch in amine adsorption by quartz. Colloids Surf. A: Physicochem. Eng. Asp. 522,642-651. Tian, J., Xu, L., Deng, W., Jiang, H., Gao, Z., Hu, Y., 2017a. Adsorption mechanism of new10mixed anionic/cationic collectors in a spodumene-feldspar flotation system. Chem.Eng. Sci. 164, 99-107. Tian, J., Xu, L., Yang, Y., Liu, J., Zeng, X., Deng, W., 2017b.Selective flotation separationof ilmenite from titanaugite using mixed anionic/cationic collectors. Int. J. Miner.Process. 166, 102-107. Tian,J., Xu,L., Wu, H., Fang, S., Deng, W., Peng, T.,2018. A novel approach for flotationrecovery of spodumene, mica and feldspar from a lithium pegmatite ore. J. Clean.Prod. 174,625-633. Towner, R.R., 1992. International Strategic Minerals Inventory Summary Report;Zirconium. NO.930-L, U.S. Dept. of the Interior, Geological Survey. Wang, X., Liu, J., Miller, J.D., 2008. Adsorption and self-assembly of octyl hydroxamicacid at a fluorite surface as revealed by sum-frequency vibrational spectroscopy. J.Colloid Interface Sci. 325, 398-403. Wang, X., Liu, J., Du, H., Miller, J.D., 2010. States of adsorbed dodecyl amine and waterat a silica surface as revealed by vibrational spectroscopy. Langmuir 26, 3407-3414. Wang, X., Miller, J.D.,2018. Dodecyl amine adsorption at different interfaces duringbubble attachment/detachment at a silica surface. Physicochem. Probl. Miner.Process. 54, 81-88. Wang, X., Yin, X., Nalaskowski, J., Du, H., Miller, J.D., 2015. Molecular features of waterfilms created with bubbles at silica surfaces. Surf. Innov. 3, 20-26. Wang, Y., Yu, F., 2007. Effects of metallic ions on the flotation of spodumene and beryl.J.China Univ. Min. Technol. 1, 35-39. Xie, Z., Wang, Y., Yu, F., Tang, Z., Zhu, G., 2013. Reviews of flotation research on peg-matite spodumene ores. Chinese J. Rare Met. 37, 641-649. Xu,L., Hu, Y., Wu, H., Tian, J., Liu, J., Gao, Z., Wang, L., 2016. Surface crystal chemistryof spodumene with different size fractions and implications for flotation. Sep. Purif.Technol. 169, 33-42. Xu, L., Peng, T., Tian, J., Lu, Z., Hu, Y., Sun, W., 2017. Anisotropic surface physico-chemical properties of spodumene and albite crystals: implications for flotation The selective flotation separation of spodumene from other aluminosilicate minerals remains a challenging problem in flotation chemistry, and the surface chemistry features are of fundamental importance. In this study,the interfacial chemistry features, particularly the wetting characteristics of selected spodumene surfaces (1 1 0,0 0 1, 0 1 0, and 1 0 0 crystal surfaces), in the absence and presence of collectors, were studied by water contact angle and bubble attachment measurements, molecular dynamics (MD) simulation, and sum-frequency vibrational spectroscopy (SFVS). The experimental results revealed the interfacial water structure at spodumene surfaces. Contact angle, bubble attachment measurements, and MD simulation results showed that the four spodumene surfaces were naturally hydrophilic, whereas in the presence of collectors, preferential adsorption of sodium oleate on the (1 0 0) and (1 1 0) surfaces was found to create a hydrophobic surface state. Detailedanalysis of the interfacial water structure was conducted in order to understand the wetting characteristics at the molecular level, and SFVS was used to study the state of collectors at selected surfaces. The MD simulation and SFVS results revealed that the natural state of the surfaces contributes to the distinct interfacial water structure and the adsorption state of collectors. It seems that unsaturated Al sites at the spodumene surface and their spatial locations account for chemisorption of sodium oleate, while electrostatic attraction appears to be the main driving force for dodecylamine adsorption.
关闭-
1/12
-
2/12
还剩10页未读,是否继续阅读?
继续免费阅读全文产品配置单
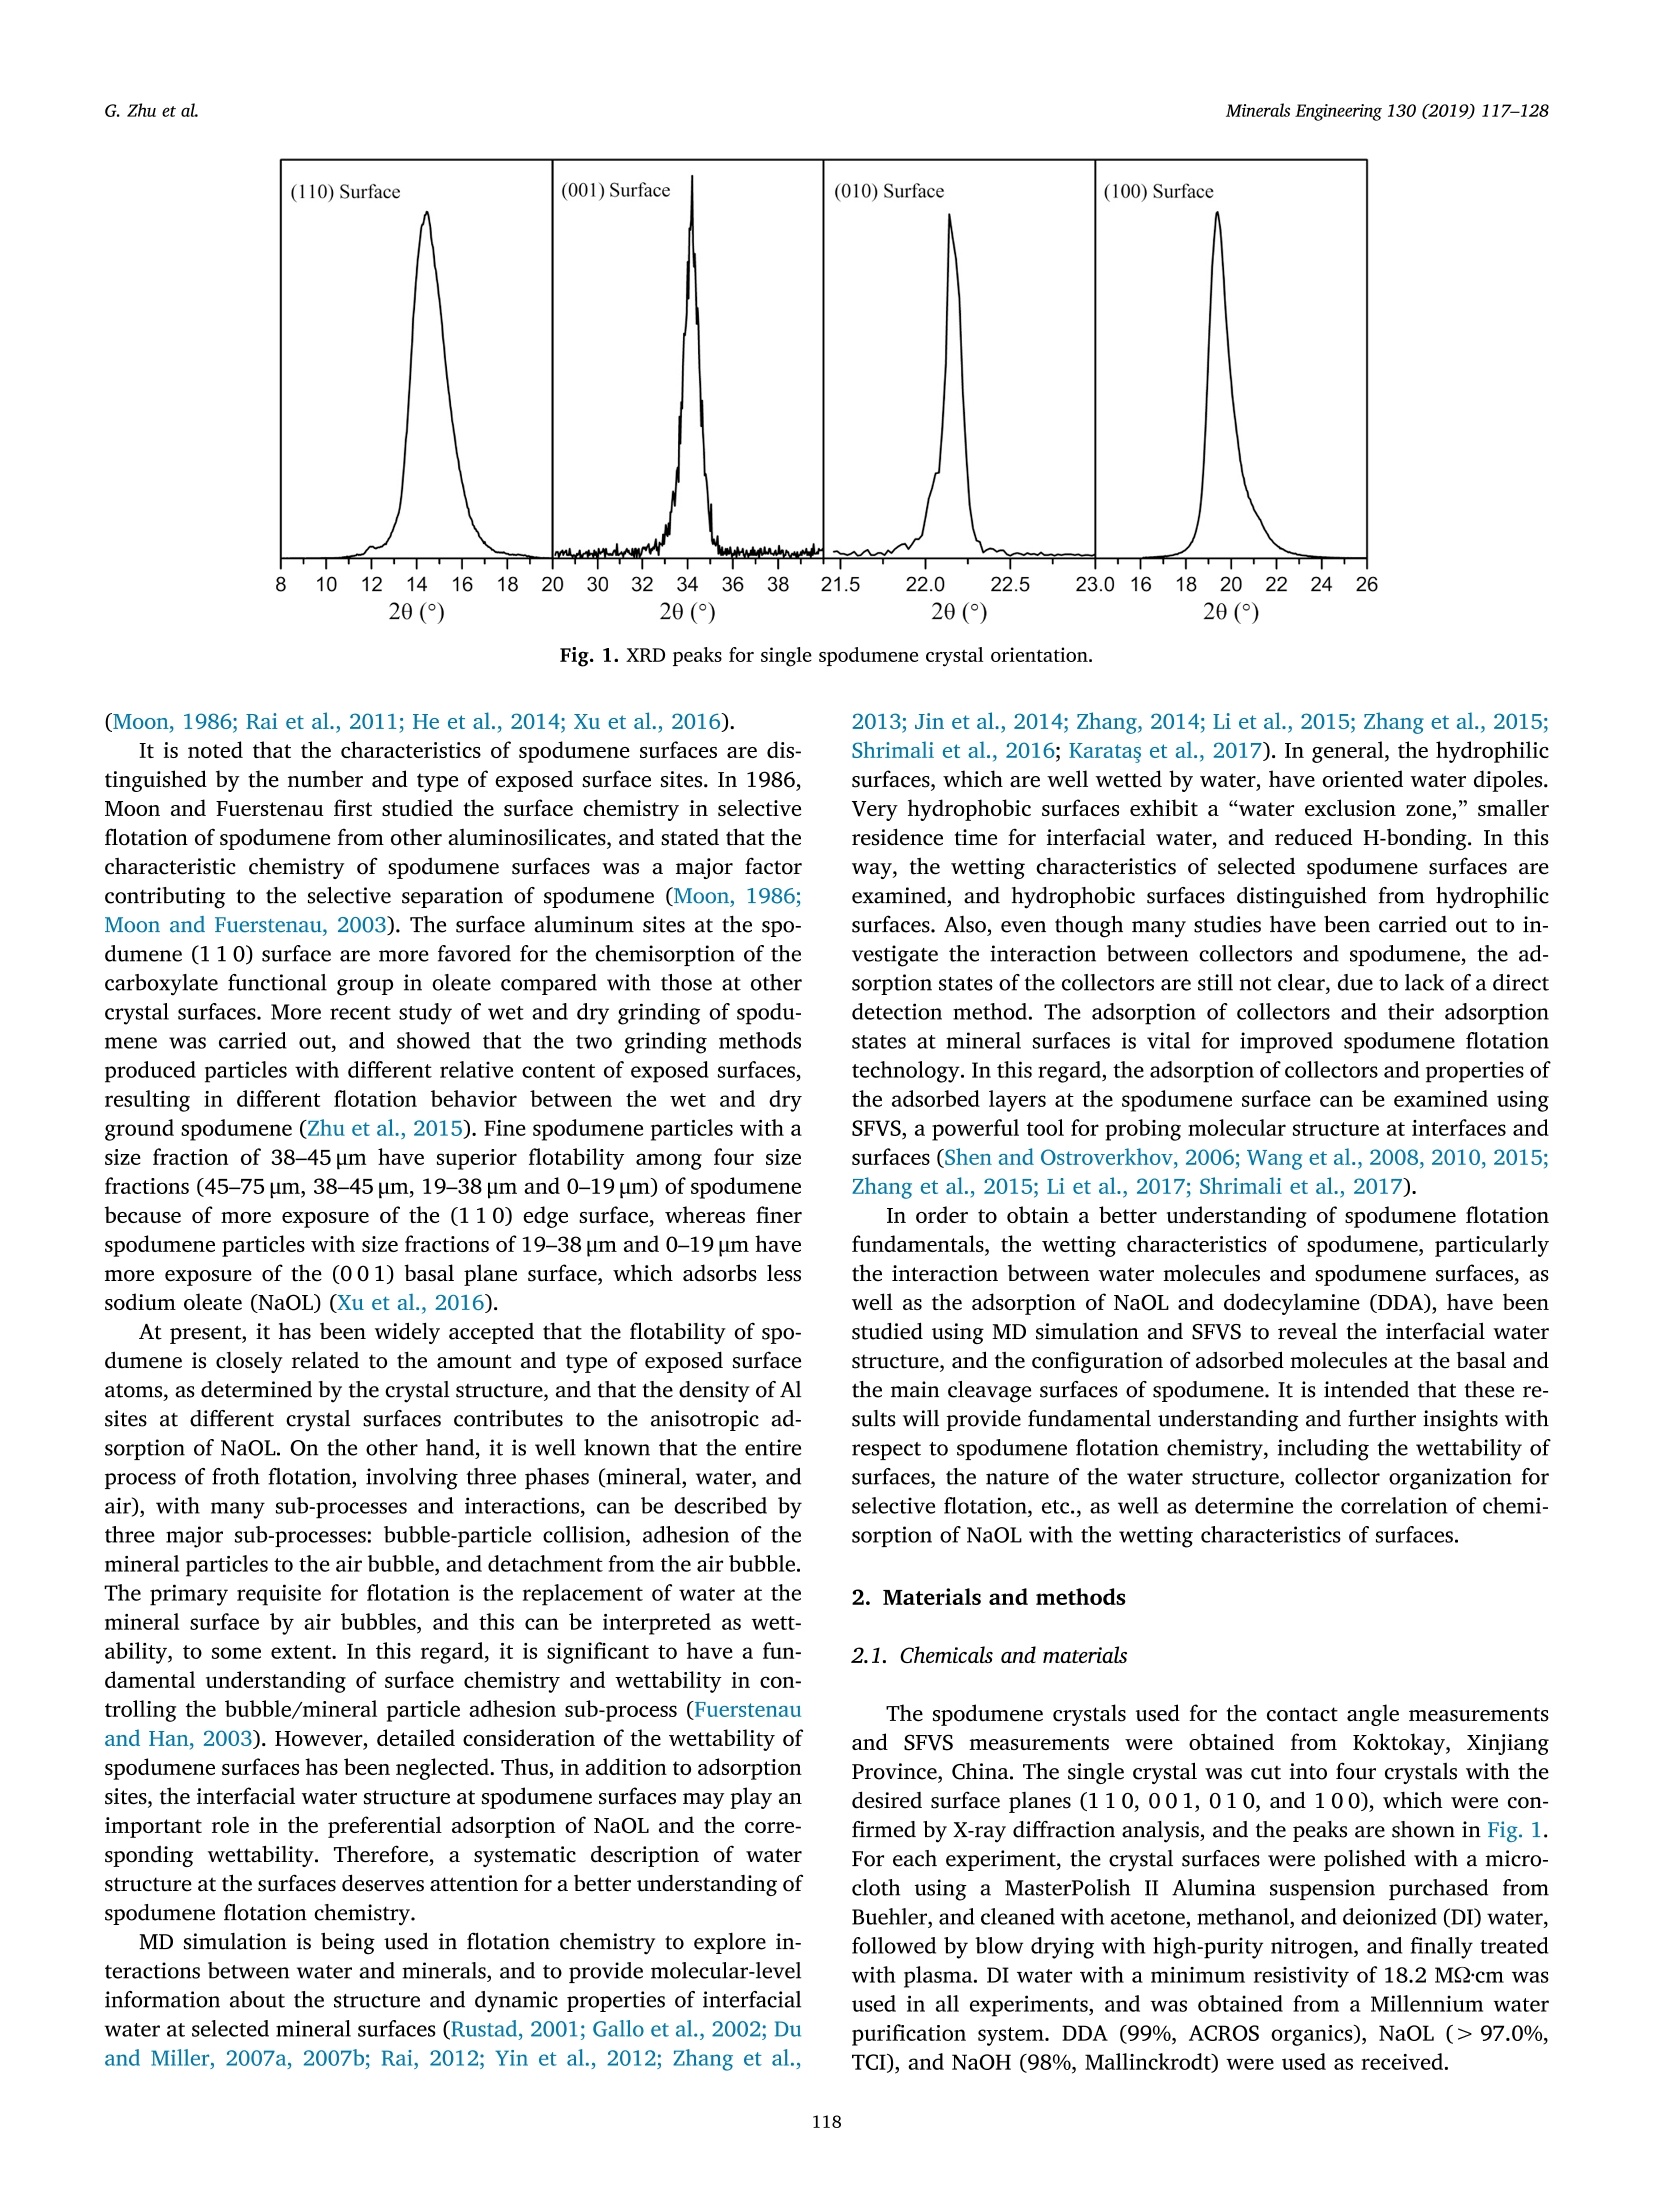
北京欧兰科技发展有限公司为您提供《锂辉石表面中和频光谱(SFG)检测方案(其它光谱仪)》,该方案主要用于非金属矿产中和频光谱(SFG)检测,参考标准《暂无》,《锂辉石表面中和频光谱(SFG)检测方案(其它光谱仪)》用到的仪器有Ekspla SFG 表面和频光谱分析系统。
我要纠错
推荐专场
其它光谱仪
更多
相关方案
 咨询
咨询