方案详情文
智能文字提取功能测试中
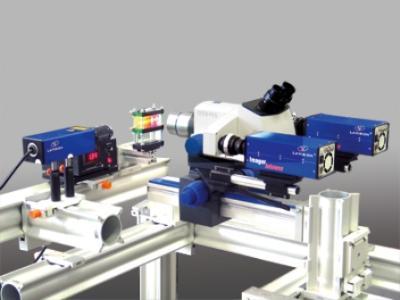
·PLOSONE :@·PLOSoNERed blood cell aggregates and their effect on non-Newtonian blood viscosity OPEN ACCESS Citation: Mehri R, Mavriplis C, Fenech M (2018)Red blood cell aggregates and their effect on non-Newtonian blood viscosity at low hematocrit in atwo-fluid low shear rate microfluidic system. PLoSONE 13(7):e0199911.https://doi.org/10.1371/journal.pone.0199911 Editor: Philippe Connes, Universite Claude BernardLyon 1, FRANCE Received: August 31, 2017 Accepted: June 16,2018 Published: July 19, 2018 Copyright:@ 2018 Mehri et al. This is an openaccess article distributed under the terms of theCreative Commons Attribution License, whichpermits unrestricted use, distribution,andreproduction in any medium, provided the originalauthor and source are credited. Data Availability Statement: The data underlyingthis study have been uploaded to the HarvardDataverse and can be accessed using the followinglink: https://doi.org/10.7910/DVN/6Z48CE. Funding: This work was funded by the NationalScience and Engineering Research Council ofCanada through Dr. R. Mehri (Alexander GrahamBell Canada Graduate Scholarship CGSD2-459381-2014) and through Dr. C. Mavriplis (#RGPIN-371562-2009) and Dr. M. Fenech (#RGPIN-2015-06188). This work was also supported by the Red blood cell aggregates and their effect onnon-Newtonian blood viscosity at lowhematocrit in a two-fluid low shear ratemicrofluidic system Rym Mehri*,Catherine Mavriplis, Marianne Fenech Department of Mechanical Engineering, University of Ottawa,Ottawa,Ontario, Canada *rmehri@uottawa.ca Abstract Red blood cells (RBCs) are the most abundant cells in human blood. Remarkably RBCsdeform and bridge together to form aggregates under very low shear rates. The theory andmechanics behind aggregation are, however, not yet completely understood. The mainobjective of this work is to quantify and characterize RBC aggregates in order to enhancethe current understanding of the non-Newtonian behaviour of blood in microcirculation.Suspensions of human blood were flowed and observed in vitro in poly-di-methyl-siloxane(PDMS) microchannels to characterize RBC aggregates. These microchannels were fabri-cated using standard photolithography methods. Experiments were performed using amicro particle image velocimetry (pPIV) system for shear rate measurements,coupled witha high-speed camera for flow visualization. RBC aggregate sizes were quantified in con-trolled and measurable shear rate environments for 5,10 and 15% hematocrit. Aggregatesizes were determined using image processing techniques, while apparent viscosity wasmeasured using optical viscometry. For the samples suspended at 5%H, aggregate sizewas not strongly correlated with shear rate. For the 10% H suspensions, in contrast, lower-ing the shear rate below 10 s°resulted in a significant increase of RBC aggregate sizes.The viscosity was found to increase with decreasing shear rate and increasing hematocrit,exemplifying the established non-Newtonian shear-thinning behaviour of blood. Increase inaggregation size did not translate into a linear increase of the blood viscosity. Temperaturewas shown to affect blood viscosity as expected, however,no correlation for aggregate sizewith temperature was observed.Non-Newtonian parameters associated with power law andCarreau models were determined by fitting the experimental data and can be used towardsthe simple modeling of blood's non-Newtonian behaviour in microcirculation. This workestablishes a relationship between RBC aggregate sizes and corresponding shear ratesand one between RBC aggregate sizes and apparent blood viscosity at body and room tem-peratures, in a microfluidic environment for low hematocrit. Effects of hematocrit, shear rate,viscosity and temperature on RBC aggregate sizes have been quantified. Canada Foundation for Innovation through Dr. M.Fenech (#31112).The funders had no role in studydesign, data collection and analysis, decision topublish, or preparation of the manuscript. Introduction Competing interests: The authors have declaredthat no competing interests exist. Red blood cells (RBCs) play a key role in dictating the rheological behaviour of blood in micro-circulation.They are responsible for the non-Newtonian behaviour of blood, due to theirunique properties; solid but pliable RBCs aggregate and form three-dimensional cell clustersand one-dimensional“rouleaux"stacks that account for the variation of blood viscosity inmicrocirculation, as they flow, tumble, form, disband and squeeze through small blood vessels.Factors affecting rouleaux formation in turn affect blood viscosity. These factors include thecomposition of the suspension medium, the elasticity of RBC membranes, the hematocrit ofblood and the applied shear rate. In vivo, blood viscosity is further affected by the geometryand diameter of the vessels; the apparent viscosity decreases with decreasing vessel diameterin a phenomenon called the Fahraeus-Lindqvist effect [1]. A further consequence of this effectis that blood in microcirculation also exhibits a decrease oflocal hematocrit with decreasingvessel diameter [2]. This is due to plasma skimming effects in microcirculation caused by theformation of the cell free layer, which greatly influences the Fahraeus-Lindqvist effect [3].In fact, it has been shown that the local hematocrit, defined as the percentage by volume ofRBCs (denoted H), in microcirculation does not exceed 20% H, compared to 45% H typical ofmacrocirculation [4]. Early experimental studies measured blood apparent viscosity using Couette or coaxial vis-cometers, for varying shear rates [5-7], including for very low shear rates near and at zero [8],varying aggregation levels (by varying fibrinogen concentration) [5], and varying hematocrit[6]. They found that, in general, blood apparent viscosity increases with increased aggregation[5] as well as with increased hematocrit [6]. Merrill [5] showed that the yield stress of blood isstrongly affected by the fibrinogen content in the blood as well as the proteins in the plasma. Previous non-Newtonian models Several non-Newtonian models have been developed to describe the measured viscous behav-iour of blood. One of the most known and used non-Newtonian models for blood is the powerlaw or Ostwald-de Waele power law [9]. According to this model, the fluid shear stress, t,canbe calculated as: where K represents the fluid consistency index, n the non-Newtonian behaviour index, u thestreamwise velocity of the fluid and y the coordinate normal to the vessel wall. This model,however, does not accurately predict the behaviour and viscosity of fluids at very high or verylow shear rates: at these extremes, the viscosity, estimated by the power law model, tends toinfinity rather than reaching a constant value as observed experimentally [10]. Despite thislimitation, the power law model is still widely used for its simplicity. The Casson model [11] characterizes a Non-Newtonian fluid exhibiting both shear-thin-ning behaviour and a yield stress, simultaneously. It models the shear stress as: where k is the Casson model constant and T, is the yield stress of blood. Cokelet [8] found thatthe Casson model describes blood viscosity well at very low shear rates, except that it does not account for the effects of hematocrit (e.g. the influence of hematocrit on the yield stress) northe effects of inter-aggregate forces. The Carreau-Yasuda model, first introduced by Pierre Carreau [12] and further developedby Kenji Yasuda [13], models the apparent viscosity of the non-Newtonian fluid as: where y represents the shear rate, uoo the viscosity at infinite shear, uo the viscosity at zeroshear, a the relaxation time, n the power law index and a the shape parameter. The Carreaumodel represents a special case of the Carreau-Yasuda model in which a=2. At high shearrates, the fluid thus behaves as a Newtonian fluid with a viscosity of u, whereas at low shearrates, the fluid acts as a Newtonian fluid with a viscosity of ho. The Carreau-Yasuda model iscapable of predicting the shear-thinning behaviour of blood, however the thixotropic (time-dependent) behaviour of blood is not captured. Several other models have attempted to mimicvarious aspects of blood behaviour, such as hematocrit dependence and yield stress behaviour,mostly at the macroscale [14-16]. Although it has been shown through experimental studiesthat these models can predict the behaviour of blood to some level of accuracy [17], none ofthese account for the effects of RBC aggregates, which greatly influence the micro-rheologicalbehaviour of blood [18-20]. Bureau et al. [21] presented a dynamical study of blood to investigate its rheological behav-iour in transient flow regimes at low shear rates. Several experiments were performed to deter-mine the stress variation in time when the systems were subjected to incremental rectangularand triangular shear rates (hysteresis cycles). They discovered that, dynamically, blood exhibitsa viscoelastic, shear-thinning and thixotropic behaviour, simultaneously. Owens [22] developed a new constitutive equation describing the behaviour of whole bloodbased on the linear spring law and the multi-mode generalized Maxwell equation, includingRBC aggregation as a parameter in the model. The model was compared to the study of Bureauet al. [21] and showed similar results when subjected to incremental triangular shear rates. Fedosov et al. [23] developed a numerical model of blood dynamics that predicted thedependence of blood viscosity on shear rate and hematocrit (at 20%, 30% and 45% H). Theirmodel incorporated coarse-grained molecular dynamics with RBC mechanics and simulatedthe formation ofrouleaux. Their simulations of blood (at 45%H and 37C) for shear ratesbetween 0.005 and 1000spredicted a steep increase in viscosity at very low shear rates owingto the significant formation of RBC aggregates, and closely matched the experimental resultsof Merrill et al. [5], Chien et al.[6], and Skalak et al. [7]. Optical viscometry The viscosity within in vitro microchannels can be measured using the optical viscometrymethod [24]. This technique is based on the analytical solution for two co-flowing fluids in arectangular channel,which can be obtained by a Fourier series expansion. This method wasfirst developed by Galambos and Forster [25] and was investigated in a transparent T-junctiondevice to estimate the viscosity ofa Newtonian fluid, based on the known viscosity of a refer-ence fluid. The reference fluid was mixed with a fluorescent dye so that the fluid interfacecould be clearly detected. High flow rates were used to minimize the diffusion between the twomiscible fluids. Later,Guillot et al. [26] extended the technique in a Y-shaped device to mea-sure the apparent viscosity of non-Newtonian fluids using immiscible fluids to prevent the flu-ids mixing at very low shear rates. The use of immiscible fluids, however, requires detailedknowledge of the shape of the interface between the fluids, which requires a more extensiveinvestigation. For this purpose, a fluorescent confocal microscope was used to map the three- dimensional shape of the fluid interface. Solomon and Vanapalli [27] extended the techniqueand designed a multiplexed viscometer allowing measurements of viscosity for up to eightsamples simultaneously, using miscible Newtonian and non-Newtonian fluids. Objectives Few experimental studies provide details on RBC aggregate sizes and behaviour [28-31].Most modelers have only the results of the classical references measuring blood viscosity inmacrocirculation to test their theories against, and most of these are for 45%H[5-7,32, 33].The present work investigates microcirculation conditions through the application ofrecent, affordable and simple microfabrication techniques. A two-fluid shear flow micro-channel system allows for direct measurement of blood velocities and RBC aggregate sizes,under controlled shear rate conditions and at hematocrit levels close to those typical ofmicrocirculation. We use the optical viscometry technique to measure the apparent viscosityof blood in a Y-microchannel system while taking simultaneous measurements of shearrates and aggregate sizes. This work establishes a sound methodology for experimental RBCaggregate analysis and provides new, more detailed experimental data for the blood rheologyliterature. Materials and methods Experimental set up The experimental set-up (Fig 1) consisted of a uPIV system (MITAS; LaVision, Germany) cou-pled with a near infrared high-speed camera (Basler ace, acA2000-340km-NIR; BASLER, Fig 1. Experimental set-up and light path within the system. https://doi.org/10.1371/journal.pone.0199911.g001 Germany) controlled using LabVIEW software (National Instruments, USA), and a tempera-ture control system controlled using Arduino software. The uPIV system comprised acharged-coupled device (CCD) camera (Imager Intense; LaVision), a Nd:YAG laser (Solo-II;New Wave Research, USA) emitting a wavelength Aemission= 532 nm and an inverted micro-scope (MITAS, LaVision) with 20X lens magnification. The 20X objective lens provided anumerical aperture of 0.4 and a depth of field of 4 um. In order to control the position of themicrochannel relative to the measurement plane, the uPIV set-up included a moving stage(xyz directions) with a minimum step size of 1 um, controlled by Davis Imaging Software(LaVision GmbH, Germany). Tracer particles c上were mixed with the fluid samples (diluted at1% in water,dp=0.79 um,Aabs= 542 nm and Aemission=612 nm), which illuminated whenexposed to the appropriate wavelength. Each fluid sample, drawn into a glass syringe or100 uL) (Hamilton, USA), was injected at different flow rates into a disposable PDMS micro-channel (110 um in width and 60 um in depth) using a pressure driven pump (Nexus3000,Chemyx,USA). Blood flow was observed in the microchannel, normal to the velocity gradient, providinga different angle for the flow investigation than used in previous studies, such as the one byKaliviotis and Yianneskis [34], in which aggregates were visualized in the direction of velocityvariation. A dual camera port directed the light path to the different cameras: white light wasdirected to the high-speed camera for imaging the blood aggregates, whereas the light emittedfrom the laser was directed to the CCD camera for the uPIV measurements. For the uPIV mea-surements, 100 image pairs were recorded at 5 Hz, the results of which were averaged to obtainthe average velocity field. The spatial resolution of the CCD camera was 0.27 um/pixel whenusing the 20X lens. For imaging the RBC aggregates, high-speed images having resolution0.2 um/pixel were recorded at 160 frames/s. Throughout the experiment, the temperature of the blood sample was monitored and con-trolled using a custom-made temperature control system. The system comprised a heatinglamp, a dimmer circuit to modify the lamp temperature, a thermocouple (Adafruit, USA) as afeedback sensor and a microcontroller (Adafruit, USA). The system monitored and adjustedthe heating lamp every 2 seconds to maintain the target temperature. To acquire an accuratetemperature reading without affecting the flow, the thermocouple was positioned at the outletport of the microchannel, ensuring no contact with the channel walls. Experimental procedure Human RBC aggregates were visualized and investigated in Y-microchannels (Fig 2). Themicrochannels were fabricated using standard photolithography methods [35]. The PDMSmicrochannel fabrication is inexpensive and allows easy bonding to different surfaces. Addi-tional details of the fabrication process are provided in Mehri et al. [36]. Each RBC suspen-sion was tested at five different flow rates ranging from 5 to 35 uL/hr to quantify the effectof shear rate on RBC aggregate sizes in controlled shear flows and at two different tempera-tures: 23℃ (room temperature) and 37°℃ (body temperature). The flow rate range was cho-sen in order to provide shear rates in the blood layer within the ranges of blood aggregation(1-50 s). To shear the fluid, blood entering from the bottom branch of the microchannelwas entrained by a phosphate buffered saline (PBS) solution, which entered from the topbranch at a flow rate four times higher than that of the blood (Fig 2). The flow was imagedusing the high-speed camera while the velocity field was measured using the uPIV system.This set-up provided measurable, constant and controlled shear rates within the range atwhich blood aggregates [37]. Shear rates were calculated from the slopes of the linear velocity Fig 2. Blood entrained by phosphate buffered saline (PBS) in a double Y-microchannel configuration.https://doi.org/10.1371/journal.pone.0199911.g002 profiles that were measured within the blood fluid layer. The blood apparent viscosity wasestimated from the velocity profiles measured in the branches using the optical viscometrymethod mentioned in the introduction and further detailed in the viscosity measurementssection. The viscosity data were fitted using two empirical models commonly used to modelblood flow: the power law and Carreau models [9, 13] (also described in the introduction).These models are widely used in the literature for their simplicity [38, 39]. The high-speedimages of the RBC aggregates were processed in MATLAB, using techniques described inMehri et al. [40]. Blood sample preparation Human blood was collected from 11 healthy adult volunteers (4 males and 7 females) in 2015with the approval of the University of Ottawa ethics committee (H11-13-06). Informed con-sent was obtained in writing from each of the participants. The blood was collected in 4 mLtubes coated with ethylenediaminetetraacetic acid (EDTA) to prevent coagulation.All samples(whole blood) were centrifuged three times, following standard procedures, each for 10 min-utes at 3000 rpm in order to separate the blood constituents. Blood plasma was collected onlyfrom the first centrifugation. The plasma was then filtered using a 0.2 um plasma filter (NylonNon-Sterile, Fisher Scientific, Ireland) to ensure no white blood cells and platelets are presentwithout interfering with the plasma proteins. Removing these constituents for experimentsfacilitates the use of uPIV, improves the image quality and prevents blood clot formation.The RBCs of each sample were then suspended in their original plasma at three hematocrits(5%,10%, and 15%) in order to measure the effect of hematocrit on the aggregate sizes. Thereported hematocrits in this study represents the sample hematocrit at the entrance of the feed-ing tube To verify the hematocrit of each suspension, a capillary tube filled with a sample ofeach suspension was centrifuged in a microcentrifuge (CritSpin, Thermo Fisher Scientific,China) to determine the volume of the separated RBCs in the tube. Red fluorescent tracer particles (diameter =0.79 um; Fluoro-Max, USA) were added to the RBC suspensions for thevelocity measurements: 60 uL of an aqueous particle solution (1% solids) was added to each 1mL suspension, resulting in a 0.06% particle concentration. The experiments were performedwithin eight hours after blood collection. Velocity measurement Velocities inside the microchannels were measured using the uPIV system. The methodologyused for the velocity field measurements was previously validated for the study of bloodmicro-flows in a study by Pitts et al. [41].In that study, different uPIV pre-processing and pro-cessing methods were compared for flows in two microchannel geometries. Based on thatinvestigation, the cross-correlation method with image background removal was selectedfor the present measurements. A multi-pass approach was used for the velocity calculationswithin the correlation window, starting from a correlation window size of 64×64 pixels , anddecreasing to a window size of 32×32 pixelswith a 50% overlap for the different passes. Thecorrelation windows were weighted in the x-direction with a ratio of 4:1 corresponding to thedirection of the flow in the microchannel. The time between the laser pulses, dt, was variedbetween 2 and 15 ms depending on the flow rate in the channel (5<=Q<=35 uL/hr) inorder to cause particle displacements between 6 and 10 pixels between consecutive frames.The dt was optimized for measurements in the blood layer in order to obtain accurate shearrate measurements within the blood layer. To verify the accuracy of the velocity measure-ments, the root mean square (RMS) of the velocity was calculated for the 100 images of eachsample as: where N is the total number of images and u; is the velocity value of image i. The results weregiven in terms of pixel displacement which were then scaled to the units of velocity (mm/s)based on the time interval between the images pairs, dt, and the scale factor ae determined bythe calibration of the CCD camera. The velocity profiles were averaged in time (for N=100)and then averaged again along the streamwise direction, along the length of the visualizationwindow, to produce a single representative profile for the measurement, as shown in Fig 3.The velocity profiles were measured at a distance of 1.3 mm from the intersection of the twofluids. The shear rates for each measurement were calculated as the slope of the 2D velocityprofile at the channel mid-plane within the blood layer (Fig 3). The boundaries of the bloodlayer were identified based on the visualization of the fluorescent particles measured withthe uPIV system. Further details of the methodology are provided in the study of Mehri et al.[40]. Aggregate detection and image processing technique For each test, the RBC aggregates flowing in the channel were recorded for 7 seconds, captur-ing 1200 frames. The field of view was 487 um long, allowing for visualization of multipleaggregates at a time. The images recorded for each test were processed using a MATLAB pro-gram based on image pixel intensity. A flowchart illustrating the processing steps is shown inFig 4, and full details of the image processing method and its validation are provided in Mehriet al. [42]. Each image in Fig 4 represents 1286×300 pixels. The two-dimensional areas of the Position across the channel(y)[mm] a) b) Fig 3. Velocity profiles (black data points) averaged temporally and spatially and extracted from the vector fields at x=1.3 mm from the intersection of the twofluidsfor RBCs suspended at 10% H flowing with (a)Q=20 uL/hr and (b) Q=7.5 uL/hr. The red data points show the Root Mean Square (RMS) associated with thevelocity measurements. The slope of the red dashed line indicates the shear rate within the blood layer. https://doi.org/10.1371/journal.pone.0199911.g003 aggregates were measured for each frame to obtain an average aggregate size per frame; these,in turn, were averaged for the entire recording to obtain a global average aggregate size perrecording. The areas detected in pixels were then converted to um based on the conversionfactor for the specific lens used. From these images, the distributions of RBCs within the aggre-gates were also analyzed.No distinction was made between the “rouleaux"and three dimen-sional cluster structures described in the introduction. RBC aggregates detected from sample #11 flowing at Q=10 uL/hr are shown in Fig 5a,5b and 5c for hematocrit of 5, 10 and 15% hematocrit respectively and labeled based ontheir respective sizes as shown in Fig 6. Fig 7a-7e show the RBC aggregates (sample #11)at 10% hematocrit flowing at 35, 20, 10,7.5 and 5 uL/hr, respectively, labeled based ontheir respective sizes using image processing. Fig 8 shows an enlargement of the differentaggregate shapes (“rouleaux"and three dimensional clusters) identified in the flow (sample#11) Viscosity measurements The apparent viscosity of the blood suspension was measured in the microchannel usingthe concept ofoptical viscometers [24]. This concept is based on the analytical solutionoftwo co-flowing fluids in a rectangular cross-section that can be obtained by a Fourierseries expansion. For a rectangular channel of width w and depth h (Fig 2), the analyticalsolution of two co-flowing laminar streams of incompressible fluids in a rectangularchannel can be used to obtain the flow rate ratio as a function of the viscosity ratio as follows Fig 4. Flowchart of the MATLAB code for image processing of RBC aggregates flowing in microchannels. The red circles in the image show examples of theincomplete aggregate detection due to the non-uniform light distribution in the image.https://doi.org/10.1371/journal.pone.0199911.g004 (c) Fig 5. Processed images of human RBC aggregates flowing at 10 uL/hr suspended at (a) 5%, (b) 10% and (c) 15%H. The color coding is based on the sizes of the aggregates as shown in Fig 6A and 6B are two"rouleaux" present in theflow. https://doi.org/10.1371/journal.pone.0199911.g005 Fig 6. Color coding of the detected aggregates based on the aggregate sizes. https://doi.org/10.1371/journal.pone.0199911.g006 (e) Fig 7. Processed images of human RBC aggregates suspended at 10% H, flowing at (a) 35 pL/hr, (b) 20 uL/hr, (c)10 uL/hr,(d) 7.5 uL/hr and (e) 5uL/hr. The color coding is based on the sizes of the aggregates as shown in Fig 6. Crepresents a three dimensional cell cluster present in the flow. https://doi.org/10.1371/journal.pone.0199911.g007 A B C Fig 8. RBC aggregate shapes: “rouleaux"(A and B) as identified in Fig 5a at 5% H and three dimensional cellcluster (C) as identified in Fig 7b at 10%H. https://doi.org/10.1371/journal.pone.0199911.g008 27: where: Here, ui is the viscosity of the reference fluid (PBS), u2 is the viscosity of the test fluid(blood; in this case u2 is an apparent viscosity), Qi is the flow rate of the reference fluid, Q2 isthe flow rate of the test fluid, w is the width of the reference fluid in the channel, w is thewidth of the test fluid in the channel (w=W1+W2), Y is the dimensionless location of the inter-face and B is the channel aspect ratio denoted as β=h/w. For the known flow rates Qi and Q2in our double-Y microchannel device, we determined the apparent viscosity of the blood fromEq 5. The diffusion layer between the blood and the phosphate buffered saline was examinedexperimentally using fluoroscopy and shown to be minimal due to the small Reynolds number(Re=0.03). Plasma viscosity has been shown to be indicative of the molecular weight and molecularshape of the protein [43]. Therefore, plasma viscosity can be used as a controlling factor tocompare the aggregation size and viscosity between samples. The plasma viscosity was mea-sured using the m-VROCM viscometer (Rheosence Inc., USA) with temperature control. Inorder to obtain more control over the viscosity data, the apparent viscosity is divided by thedonor-specific plasma viscosity to obtain the relative viscosity. The experimental apparent viscosities measured using optical viscometry were fitted usinga linear least squares method to a power law model, wherein the fluid consistency index K andthe non-Newtonian behaviour index n were identified as the intercept and the slope of theregression, respectively. The experimental data were also fitted using a nonlinear least-squaressolver using the Levenberg-Marquart method [44] to a Carreau model. The parameters,namely the infinite shear viscosity, the zero shear viscosity, the relaxation time, and the power law index n were extracted from the fitted curves. The coefficient of determination, R’, was cal-culated as a measure of the “goodness of fit". It is important to note that the coefficient ofdetermination is usually calculated for linear least squares fits and was shown to be less rele-vant for non-linear least squares models, despite its extensive use in biochemical research [45].For this purpose, the root mean square error (RMSE) is additionally presented in Tables 1-6,and is calculated as follows: where pex,j represents the experimental data point j of viscosity, Wfitj the fitted data point jofviscosity, m the number of data points and p the number of parameters to be determined fromthe fitted curve (2 for the power law model and 4 for the Carreau model).The RMSE estimatesthe standard deviation of the random component of the data. This measure is intuitive, as ithas the same units as the fitted variable, however, because it is relative to the absolute viscositymeasurement, it is not always appropriate to compare fits for data of different conditions, hav-ing different absolute viscosity values. For this reason, and because of its widespread familiar-ity, the coefficients of determination for the different hematocrits are still provided in thisstudy for comparison purposes. Results Room temperature results Healthy and fresh human blood samples obtained from six volunteers (nsamples =6) were usedfor the experiments conducted at 23°C. It is important to note that, for the different hemato-crits, RBCs were suspended in their native plasma where protein concentration varied fromone sample to another, hence causing some natural variation in aggregation. All the RBC sus-pensions were tested following the procedure outlined in the experimental procedure section. In Fig 9a, 9b and 9c the average aggregate sizes are plotted as a function of shear rate foreach sample 5%, 10%, and 15%H, respectively. Error bars shown for each measurement depictthe standard error obtained when averaging the results of several tests (2-5) performed con-secutively under the same conditions. The results show that for the 5% H suspensions (Fig 9a), changes in shear rates do notstrongly influence the aggregate sizes detected. The aggregate sizes, for all the shear rate values,ranged from approximately 100 to 550 um. For the 10% H samples (Fig 9b), for larger shearrates (>10 s ), aggregate sizes ranged from approximately 200 to 1500 um , whereas for shearrates less than 10 s, the aggregate sizes were as large as 3500 um. Increasing the hematocritto 15%(Fig 9c), the aggregate sizes increased dramatically, typically ranging from 1500 to8000 um for the same shear rates. The trend for the 10% H case is also observed for 15% H,in which the average aggregate size increases for shear rates smaller than 10 s, although thetrend is not as pronounced. The measured viscosities are plotted in Fig 10a, 10b and 10c, as a function of shear rate foreach of the three hematocrits (5%, 10% and 15% H, respectively). As expected, viscosity isquite large for low shear rates (<10 s')tailing off to lower values at higher shear rates for allthree hematocrits studied. The trend is more pronounced for the 10% and 15%H. Tables 1 and2 summarize the parameters obtained for the power law and Carreau models, respectively,for the different hematocrits with the corresponding Rand RMSE values. The viscosity datawere better represented by the power law and Carreau models for the higher hematocrits Table 1. Summary of the non-Newtonian parameters for the power law model for human blood suspended at 5%,10% and 15% H at 23C with the corresponding R²and RMSE. Hematocrit(%) K (Pa.s") R2 RMSE (cP) 5 9.9 0.603 0.33 1.81 10 50.9 0.156 0.80 4.93 62.2 0.197 0.78 3.62 https://doi.org/10.1371/journal.pone.0199911.t001 Table 2. Summary of the non-Newtonian parameters for the Carreau model for human blood suspended at 5%,10%and 15% H at 23°C with the corresponding Rand RMSE. Hematocrit (%) uo (cP) uoo (cP) a (s) N R² RMSE (cP) 5 26.9 1.6 3.313 0.353 0.33 1.85 10 89.9 1.6 3.312 0.369 0.62 4.98 15 118.6 2.3 3.312 0.362 0.80 3.85 https://doi.org/10.1371/journal.pone.0199911.t002 Table 3. Summary of the non-Newtonian parameters for the power law model for human blood suspended at 5%,10% and 15% H fit to the apparent viscosity data, with the corresponding Rand RMSE at 37°C. The parameterscurrently proposed in the literature for blood at 45% H tested at 37°C are provided for reference. Hematocrit (%) K(Pa.s") n R² RMSE (cP) 5 9.3 0.660 0.58 1.10 10 10.8 0.680 0.64 1.40 15 17.1 0.568 0.22 4.31 45 35.0 0.600 Cho and Kensey [32] 45 17.0 0.708 Shibeshi and Collins [33] https://doi.org/10.1371/journal.pone.0199911.t003 Table 4. Summary of the non-Newtonian parameters for the Carreau model for human blood suspended at 5%, 10% and 15% H fit to the apparent viscosity data,with the corresponding R and RMSE at 37°C. The parameters currently proposed in the literature for blood at 45% H tested at 37°C are provided for reference. Hematocrit(%) uo (cP) u.o (cP) a (s) N R² RMSE (cP) 5 23.3 2.0 3.313 0.352 0.52 1.06 10 26.4 2.6 3.312 0.353 0.52 1.47 15 139.5 4.2 3.314 -0.152 0.64 3.49 45 56.0 3.45 3.313 0.356 https://doi.org/10.1371/journal.pone.0199911.t004 Table 5. Summary of the non-Newtonian parameters for the power law model for human blood suspended at 5%,10% and 15% H fit to the relative viscosity data, with the corresponding Rand RMSE at 37°C. The values for Kare given as relative values to the plasma viscosity p. Hematocrit (%) KIup(s") n R² RMSE/u, 5 5.6 0.611 0.62 0.50 10 6.2 0.646 0.75 0.59 15 8.7 0.586 0.22 2.47 https://doi.org/10.1371/journal.pone.0199911.t005 Table 6. Summary of the non-Newtonian parameters for the Carreau model for human blood suspended at 5%, 10% and 15% H, fit to the relative viscosity data,with the corresponding R and RMSE at 37°C. The values of po oo and RMSE are given as relative values to the plasma viscosity up. Hematocrit (%) Holup toolHp a (s) n R² RMSE/up 5 14.1 0.9 3.313 0.352 0.64 0.51 10 15.3 1.2 3.313 0.353 0.68 0.62 15 27.3 1.0 3.314 0.354 0.42 2.35 https://doi.org/10.1371/journal.pone.0199911.t006 #1: 10%H#2: 10%H7#3:10%H*#4:10%H#5:10%H+#6:10%H Shear rate (s ) c) Fig 9. Average human RBC aggregate sizes for six different blood samples suspended at (a) 5% (b) 10% and (c) 15% H as a function of shear rate at 23°C. Error barsfor each sample are provided for the standard error of several (2-5) tests performed consecutively. https://doi.org/10.1371/journal.pone.0199911.g009 (Fig 10b and 10c), as depicted by the coefficients of determination shown in Tables 1 and 2.For 5% H, the videos of the flow confirmed that the flow of aggregates was more variable thanin the 10% H case, since there were so few and they sometimes would get stuck in the entranceor suddenly get released. Body temperature results Fresh human blood samples, obtained from five healthy volunteers (nsamples =5), were usedfor the experiments at 37C. As was done for the tests performed at room temperature, all the 个 #1:10%H #2: 10%H #3:10%H 米 #4:10%H 本 #5:10%H + #6:10%H -C Carreau model R2=0.618 Power law model R2=0.795 a) b) c) Fig 10. Viscosity measurement for six different human blood samples suspended at (a) 5%(b) 10% and (c) 15% H as a function of shear rate at 23°C. Curve fittingsof power law (dotted black curve) and Carreau (solid black curve) models are also shown with the associated R²value. https://doi.org/10.1371/journal.pone.0199911.g010 RBC suspensions were tested following the procedure detailed in the experimental proceduresection. Fig 11a, 11b and 11c present the average RBC aggregate sizes measured vs. shearrate for 5%,10%, and 15% H, respectively at 37°C. Error bars shown for each measurementdepict the standard error obtained when averaging the results of several tests performed 700 @ #7:10%H,w=2.31cP #8:10%H, wp=1.97 cP#9:10%H, =1.33 cP米 #10:10%H,"=1.83 cP #11:10%H,g=2.19 cP Shear rate (s) Shear rate(s ) a) b) c) Fig 11. Average RBC aggregate sizes for five different human blood samples suspended at (a) 5%(b) 10% and (c) 15% H as a function ofshear rate at 37°C. Errorbars for each sample are provided for the standard error of several (2-5) tests performed consecutively. The plasma viscosity up is provided for each sample. ( ht tps: // do i.or g /1 0 . 1 37 1 /j ou rn a l. p o n e.0 19 9911. g 0 11 ) consecutively under the same conditions. The plasma viscosity up is provided in the Figs 11and 12 for reference. At 37°C, the average RBC aggregate sizes found for the 5% H blood samples in Fig lla donot vary greatly with the shear rate, as was observed for the room temperature experiments.The samples that present higher average aggregate sizes (159-586 um) for different shearrates (4.6-41.9 s ) have a relatively high plasma viscosity (e.g.pp#11=2.19±0.13cP). For thesample having the lowest plasma viscosity (up #9=1.33±0.05 cP) lower average aggregate sizes(145-262 um’) were found for the varying shear rates (2.9-30.3 s l). These results suggest thathigher plasma viscosities correlate with larger aggregate sizes, which may be explained bythem having higher levels of proteins that promote aggregation. For the 10% H suspensions(Fig 11b), the average aggregate size does vary with the shear rate and increases especially atlow shear rates (<10 s ). However, for intermediate shear rates (10-30s ), there was a 4 Shear rate(s) Shear rate (s) a) b) c) Fig 12. Relative viscosity measurement for five different human blood samples suspended at (a) 5% (b) 10% and (c) 15% H as a function of shear rate at 37°C.Curve fittings of power law (dotted black curve) and Carreau (solid black curve) models are also shown with the associated R value. The plasma viscosity n is providedfor each sample. ( h t t ps: / / d o i . org/10.137 1 / j ou r nal.pon e. 019 9 911 . g 0 1 2 ) relatively large spread in the measured aggregate sizes. As was found for the 5% H suspensions,the larger aggregation sizes corresponded to the samples with higher plasma viscosities (up #7=2.31± 0.08 cP and pp #11=2.19±0.13 cP). No clear trend could be detected for the 15% H sus-pensions due to the difficulty in distinguishing separate aggregates among the compact RBCs. The measured apparent viscosity of the suspensions is normalized by the donor-specificplasma viscosity to obtain the relative viscosity prelative, shown as a function of shear rate inFig 12a, 12b and 12c for 5%, 10% and 15% H, respectively. As for the room temperature resultsof apparent viscosity, high relative viscosity values were obtained at lower shear rates (<10 s ).The viscosity was found to decrease for larger shear rates, depicting the shear-thinning bloodbehaviour. Tables 3 and 4 summarize the non-Newtonian parameters obtained for the power law andCarreau models, respectively, fit to the apparent viscosity data, along with the correspondingRand RMSE values. Both fits for the suspensions at 5% H were found to be moderate (R²=0.58 and R’=0.52 for power law and Carreau models respectively). Increasing the hematocritto 10% and 15% H slightly improves the corresponding coefficients of determination for thepower law fit of the 10%H and the Carreau fit of the 15%H. The highest R(0.64)were foundto correspond to the fitted curve of the power law model at 10% H and the Carreau model forthe 15% H suspensions. However, the viscosity data at 15% H were not well represented by thepower law model. These results differ from the results obtained at room temperature, where better fits ofthe Carreau and power law model were found at 10% and 15% H: i.e. a larger spread of databetween the samples was obtained at body temperature. Tables 5 and 6 summarize the normalized non-Newtonian parameters obtained for thepower law and Carreau models, respectively, fit to the relative viscosity data, along with thecorresponding Rand normalized RMSE. For the 5% H and 10% H suspensions, good repre-sentation by both models was obtained for the relative viscosity. For the 15% Hsuspensions,the relative viscosity variation is not well represented by either the power law or Carreau mod-els (Tables 5 and 6). Fig 13a, 13b and 13c present the relative viscosity as a function ofaverage aggregate size for5%, 10% and 15% H, respectively at 37°C. The trend for the combined samples shows that anincrease in the aggregate sizes results in an increase in viscosity. Increase in viscosity per unitincrease in aggregate size (i.e. the slope of the fitted data) varies not only from sample to sam-ple but also with hematocrit. In fact, an increase in blood hematocrit results in a smaller degreeof viscosity increase per unit change ofaggregate size. Temperature effect In order to assess the effect of the temperature on the blood samples, the average aggregatesizes (Fig 13a) and the viscosity of the blood (Fig 14b) at 10% H were plotted as a function ofthe shear rate for both temperatures 23°C and 37°C. An increase in viscosity is noted for thelower temperature. These findings agree with previous studies [46, 47]. Fig 14a shows slightlysmaller aggregate sizes at higher temperatures,however, no clear correlation was observed.1. Discussion Effect of shear rate and hematocrit on RBC aggregation inmicrocirculation The average RBC aggregates, measured in the two fluid-flow shear flow microchannel system,were quantified for different shear rates and for three low hematocrits at different tempera-tures. It was found that the shear rate did not strongly influence the aggregate sizes at 5% H atboth temperatures. At 10% H, an increase of the aggregate sizes is observed for shear ratesbelow 10 s. Higher sample plasma viscosity also correlated with higher aggregate sizes. At15% H, the aggregates were shown to increase at lower shear rates. However, no clear trendcould be detected for the 15% H suspensions due to the large number of cells in the field ofview. The sample hematocrit was also shown to influence the average aggregate sizes where anincrease in hematocrit resulted in an increase in aggregate size. The results obtained agree withthe conclusion of Kim et al. [48, 49], who investigated the link between the collision rate oferythrocytes and the degree of aggregation in vivo noting a hematocrit of 9%. The number of a) b) c) Fig 13. Relative viscosity measurement for five different human blood samples suspended at (a) 5% (b) 10% and (c) 15% H as a function of average aggregate sizeat 37°C. ( h t tp s : //d o i . or g /10. 1 3 7 1 /j o ur n al.p o n e .019991 1 . g01 3 ) RBCs present within the medium greatly affects the collision rate since the fewer the numberofcells, the lower the probability of the RBCs to encounter, collide and initiate rouleaux forma-tion, thereby decreasing aggregation [20]. The findings of this study provide quantitative dataon the average aggregate sizes in microcirculation under different conditions. Although a trend can be seen when considering all the samples in Figs 9 and 10, discrepan-cies between the different blood samples are clearly present. This is mainly due to the physio-logical nature of blood varying from one individual to another. A predominant source ofspread in the results is likely the variation in fibrinogen concentration in the plasma. Fibrino-gen is also known to affect the aggregation mechanism and varies from person to person.Plasma viscosity has been shown to be indicative of the molecular weight and molecular shapeof the protein [43], and can therefore be used as another influencing factor to compare theaggregation size and viscosity between samples. Plasma viscosity, however, is not directly 4000 30 Fig 14. Variation of (a) RBC aggregate size and (b) apparent viscosity with shear rate for all 10% H tests by temperature: 23°C (blue) and 37°C(red). https://doi.org/10.1371/journal.pone.0199911.g014 linked to fibrinogen concentration and therefore cannot fully explain the differences betweenthe samples [43]. Effect of shear rate and hematocrit on blood viscosity in microcirculation Viscosity measurements, performed using the optical viscometer technique, were shown to beshear rate dependent with a shear-thinning behaviour. The viscosity of blood was found toincrease with decreasing shear rate. The viscosity was also found to increase with increasingthe hematocrit, especially at low shear rates. This shear-thinning behaviour was expected andhas been extensively reported [15, 20-22]. The non-Newtonian parameters obtained by fittingthe viscosity data to the power law and Carreau models showed different behaviours at differ-ent hematocrits and temperatures. For the power law model, the consistency index (K) wasfound to increase with increasing the hematocrit at both temperatures. The power law index(n) values indicate a more prominent shear-thinning behaviour at higher hematocrits at roomtemperature. At body temperature, the power law index remains nearly constant showing sim-ilar shear-thinning behaviour between hematocrits. The power law parameters obtained at lowhematocrits in microcirculation were compared to the parameters currently used in the litera-ture [32, 33] at 45% H (Table 3). As observed in Table 3, the power law parameters available inthe literature do vary for similar hematocrits. The results obtained at 15% H approach theparameters reported by Shibeshi and Collins [33] at 45% H while differing from the parame-ters used in the study of Cho and Kensey [32]. However, a low coefficient of determinationwas reported for the power law fit at 15% H. The non-Newtonian parameters obtained by fitting the viscosity data to the Carreau model,were found to better represent the data. For the temperatures tested, the viscosity at zero shear(ro) and the viscosity at infinite shear (u) increase with increasing hematocrit. The parame-ters obtained at body temperature were also compared to the parameters reported in the studyof Cho and Kensey [32]. At 15%H, the larger spread of data between the samples at body tem-perature made the results inconclusive. Different samples used exhibited differences in theirspecific non-Newtonian behaviours, producing significant variations in viscosity from onesample to another. These non-Newtonian models better represent the viscous behaviour ofblood when fitted for each individual subject, instead of fitted to the ensemble data. For exam-ple, there was significant variation in the plasma viscosities measured for the different subjects(between 1.33 and 2.31 cP). Measurements reported by Mehri [50] revealed that the plasmaviscosity had a strong influence on the apparent viscosity of RBC suspensions at low shearrates (<10 s), with a diminishing influence at higher shear rates. While we recognize thatindividual blood samples vary in their exact viscous behaviour, we report here the modelparameters for the data fitted as an ensemble, in order to provide parameters representative ofaverage blood for future use. The parameters obtained from the fitted curves can be used forsimple modeling of the non-Newtonian behaviour of blood in microcirculation. Effect of RBC aggregation on blood viscosity It is clear from our data that viscosity increases with RBC aggregate size. Our study ofthreehematocrits shows that as hematocrit increases, the rate of increase of viscosity per unitincrease of aggregate size does not necessarily follow a linear trend, as previously reported byKaliviotis and Yianneskis [34]. Nor would we expect it to due to the complex interaction ofirregularly shaped aggregates. This relationship could be due to differences in the structuralintegrity of the RBC network: Aggregates were observed to form and break apart under shearwhich would affect the apparent viscosity measured. However, a systematic study was not per-formed. A better understanding of the molecular interaction of the aggregates is required inorder to interpret the results with certitude. Temperature effects on RBC aggregate size and blood viscosity The same trends were found for both the results obtained at room temperature and body tem-perature, with lower viscosities measured at body temperature as shown in Fig 14a and 14b. Itis well known that temperature greatly affects blood behaviour [20]. The temperature effect iscommonly reported in viscosity measurements, however no quantification of the temperatureeffect has been provided in terms of aggregate size. Neumann et al. [46] did show the tempera-ture effects on RBC aggregation and stated that a decrease in temperature engenders a higherresistance of the aggregates to hydrodynamic dispersion and hence would increase the absorp-tion energy of the aggregates due to an increase in molecular adsorption stress. However, thistemperature dependence was not directly related to RBC aggregate size. The results of the pres-ent investigation confirm the conclusions of Neumann et al. [46]: significantly higher viscosi-ties were measured at low shear rates for the room temperature results than for the bodytemperature results, as shown in Fig 14b, however no correlation for aggregate size with tem-perature was observed (Fig 14a). Limitations For this study, the control of several parameters was essential in order to assess the sizes of theRBC aggregates in a controlled microfluidic environment. However, parameter variation wasinevitable and is discussed in this section. The reported hematocrit in this study represents the sample hematocrit at the entrance ofthe feeding tube. Although the hematocrit at the entrance of the microchannel is controlled,variations in local hematocrit were observed. These variations were expected as observed in invivo studies [51]. In order to account for the hematocrit variation within the microchannel, theaggregate sizes are reported as an average of multiple consecutives frames. Different hematocrits, up to 15%, were analyzed in this study. Higher hematocrits were notfurther analyzed due to the optical system limitations. As previously noted, difficulties wereencountered in the visualization of the aggregate at 15% at lower shear rates. Therefore, assess-ing the sizes of the aggregates at higher hematocrits (up to 20-25% in the microcirculation)would require further investigation. It is hypothesized that combining the methodology usedin this study with a confocal microscope could provide further understanding of aggregate for-mation in three dimensions. However, this would require analyzing the aggregate in a “freeze-frame"manner in order to reconstruct the aggregates in three dimensions which is extremelychallenging with a dynamic flow. Due to the depth of the microchannel (allowing the formation of aggregates with no con-straint), overlapping of aggregates flowing in different planes in the microchannel was visual-ized which could affect the sizes of the aggregates detected. In order to remedy the problem,the aggregates were detected on multiple consecutive frames where the aggregate sizes areaveraged in time and space hence reducing the effect of aggregate overlap. In this study, we considered only steady flows. However, in vivo, blood flow is pulsatile.Intuitively, due to the unsteady nature of the flow, it is believed that the pulsatile flow couldaffect the blood viscosity and aggregation, however this was not investigated in this study. Thepurpose of the study was to investigate blood behaviour and red blood cells aggregation inmicrocirculation, under controlled flow conditions. In order to provide controlled conditionsfor shear rate and aggregate size measurements, a steady flow was required. In microcircula-tion, the effects of pulsatile flow are minor [52] and the microcirculatory network represents arelatively compliant system [53]. In this study, two of the more common models used to model blood flows in complexgeometries were used to fit the apparent viscosity data. However, these models do not considerhematocrit or RBC aggregation. Several other models have attempted to mimic hematocritdependence and yield stress behaviour at the macroscale [14-16]. In order to obtain an accu-rate model mimicking the microrheological behaviour of blood at low hematocrits furtherinvestigation is required. We provided non-Newtonian parameters at low hematocrits for thecommon models for future use of simple models and to validate our results to some degreesince there is little data available to compare. Conclusion This research investigated blood behaviour in a controlled microfluidic system for varyingshear rate, three different hematocrits, at both room and body temperatures. Human RBCaggregate sizes were quantified and plotted as a function of corresponding shear rates at differ-ent hematocrits. The results give quantitative effects of temperature, hematocrit, shear rate andviscosity on RBC aggregate sizes. The viscosity data were fitted to two simple empirical modelsthat were previously developed to analyze the non-Newtonian behaviour of polymers: thepower law model and the Carreau model. The non-Newtonian parameters associated withthese models were determined by fitting the experimental data and can be used towards thesimple modeling of blood’s non-Newtonian behaviour in microcirculation.1. This work provides important contributions to the understanding of blood behaviour inmicrocirculation and the hemorheology field. The results obtained at room temperature constitute a framework for the design of lab-on-chip devices and artificial organs on chips.Overall, the results obtained provide a deeper understanding of human RBC aggregates inmicrocirculation by quantifying aggregate sizes and associated viscosity variation at low shearrates and could help to determine aggregate behaviour in clinical settings. Acknowledgments Microfabrication was performed in the facilities of the Department of Electronics at CarletonUniversity. The careful editing of Laura Haya greatly contributed to this paper. Author Contributions Conceptualization: Rym Mehri. Data curation: Rym Mehri. Formal analysis: Rym Mehri. Funding acquisition: Catherine Mavriplis, Marianne Fenech. Investigation: Rym Mehri. Methodology: Rym Mehri. Project administration: Catherine Mavriplis, Marianne Fenech.Resources: Catherine Mavriplis, Marianne Fenech. Software: Rym Mehri, Marianne Fenech. Supervision: Catherine Mavriplis, Marianne Fenech.Validation: Rym Mehri. Writing-original draft: Rym Mehri. Writing - review & editing: Catherine Mavriplis, Marianne Fenech. References 1. Fahraeus R, Lindqvist T. The viscosity of the blood in narrow capillary tubes. Am J Physiol-LegacyContent. 1931;96:562-568. 2. Pries AR, Neuhaus D, Gaehtgens P. Blood viscosity in tube flow: dependence on diameter and hemato-crit. Am J Physiol Heart Circ Physiol. 1992;263: H1770-H1778. 3. Cokelet GR, Goldsmith HL. Decreased hydrodynamic resistance in the two-phase flow of blood throughsmall vertical tubes at low flow rates. Circ Res. 1991; 68: 1-17. https://doi.org/10.1161/01.RES.68.1.1PMID: 1984854 4. Perkkio J, Keskinen R. Hematocrit reduction in bifurcations due to plasma skimming. Bull Math Biol.1983;45:41-50.https://doi.org/10.1016/S0092-8240(83)80040-8 PMID: 6850160 5. Merrill EW,Gilliland ER, Lee TS, Salzman EW. Blood Rheology: Effect of Fibrinogen Deduced by Addi-tion. Circ Res. 1966;18: 437-446.PMID: 4952703 6. Chien S, Usami S, Taylor HM, Lundberg JL, Gregersen MI. Effects of hematocrit and plasma proteinson human blood rheology at low shear rates. J Appl Physiol. 1966;21:81-87. https://doi.org/10.1152/jappl.1966.21.1.81 PMID:5903948 7. Skalak R, Keller SR, Secomb TW. Mechanics of blood flow. J Biomech Eng. 1981;103:102-115.https://doi.org/10.1115/1.3138253 PMID: 7024641 8. Cokelet GR, Merrill EW, Gilliland ER, Shin H. The rheology of human blood-Measurement near and atzero shear rate. J Rheol.1963;7: 303-317. https://doi.org/10.1122/1.548959 9Reiner M. Rheologie Theorique. Paris: Dunod; 1955.n Pries AR, Secomb TW. Rheology of the microcirculation. Clin Hemorheol Microcirc. 2003;29:143-148.PMID: 14724335 11. Casson N. A flow equation for pigment-oil suspensions of the printing ink type. Rheology of DisperseSystems 1959. 12. Carreau PJ. Rheological equations from molecular network theories. Trans Soc of Rheol. 1972; 16:99-127. https://doi.org/10.1122/1.549276 13. Yasuda K. Investigation of the analogies between viscometric and linear viscoelastic properties of poly-styrene fluids. Ph.D. Thesis, Massachusetts Institute of Technology. 1979. 14. Caton F. The sol-gel transition of blood. Presented at the Workshop Agregation erythrocytaire & ecoule-ment sanguine, Marseille, France. 2015. 15. Walburn FJ,Schneck DJ. A constitutive equation for whole human blood. ASME Bioengineering Divi-sion. Winter Annual Meeting; 1975. 16. HerschelW, Bulkley R. Konsistenzmessungen von gummi-benzollosungen.Colloid Polym Sci.1926;39:291-300. 17. Zhang JB, Kuang ZB. Study on blood constitutive parameters in different blood constitutive equations. JBiomech. 2000;33:355-360.PMID:10673119 18. Cabel M, Meiselman HJ, Popel AS, Johnson PC. Contribution of red blood cell aggregation to venousvascular resistance in skeletal muscle. Am J Physiol. 1997;272: H1020-32. https://doi.org/10.1152/ajpheart.1997.272.2.H1020 PMID: 9124410 19. Bishop JJ, Nance PR, Popel AS, Intaglietta M, Johnson PC. Effect of erythrocyte aggregation on veloc-ity profiles in venules. Am J Physiol Heart Circ Physiol. 2001; 280: H222-H236.https://doi.org/10.1152/ajpheart.2001.280.1.H222PMID: 11123237 20. Baskurt OK,Neu B, Meiselman HJ. Red Blood Cell Aggregation. Boca Raton: CRC Press;2011. 21. Bureau M, Healy JC, Bourgoin D, Joly M. Rheological hysteresis of blood at low shear rate. Biorheology1980;17:191-203.PMID: 6157430 22. Owens RG. A new microstructure-based constitutive model for human blood. J Non-Newtonian FluidMech.2006;140:57-70. https://doi.org/10.1016/j.jnnfm.2006.01.015 23. Fedosov DA, Wenxiao P, Caswell B, Gompper G, Karniadakis GE. Predicting human blood viscosity insilico. Proc Natl Acad Sci USA. 2011;108:11772-11777. https://doi.org/10.1073/pnas.1101210108PMID:21730178 24. Chevalier J, Ayela F.Microfluidic on chip viscometers.Rev Sci Instrum. 2008;79:076102-1-076102-3.https://doi.org/10.1063/1.2940219 PMID: 18681739 25. Galambos P, Forster F. An optical micro-fluidic viscometer. Int Mech Eng Cong Exp (Anaheim, CA:Dynamic Systems and Control Division, ASME). 1998; 66:187-191. 26. Guillot P, Panizza P, Salmon JB, Joanicot M, Colin A, Bruneau CH et al. Viscosimeter on amicrofluidicchip.Langmuir. 2006; 22:6438-6445. https://doi.org/10.1021/la060131z PMID: 16800711 27. Solomon DE, Vanapalli SA. Multiplexed microfluidic viscometer for high-throughput complex fluid rheol-ogy. Microfluid Nanofluidics.2014;16:677-690.https://doi.org/10.1007/s10404-013-1261-2 28. Kaliviotis E, Dusting J, and Balabani S. Spatial variation of blood viscosity: Modelling using shear fieldsmeasured by a pPIV based technique. Med Eng Phys.2011;33:824-831. https://doi.org/10.1016/j.medengphy.2010.09.004 PMID: 20943426 29. Dusting J, Kaliviotis E, Balabani S, and Yianneskis M. Coupled human erythrocyte velocity field andaggregation measurements at physiological haematocrit levels. J Biomech. 2009;42:1438-1443.https://doi.org/10.1016/j.jbiomech.2009.04.004 PMID: 19428015 30. Sherwood JM, Kaliviotis E, Dusting J, and Balabani S. Hematocrit, viscosity and velocity distributions ofaggregating and non-aggregating blood in a bifurcating microchannel. Biomech Model Mechanobiol.2014;13:259-273.https://doi.org/10.1007/s10237-012-0449-9 PMID: 23114881 31. Chen S, Barshtein G, Gavish B, Mahler Y, and Yedgar S. Monitoring of red blood cell aggregability in aflow-chamber by computerized image analysis. Clin Hemorheol Microcirc. 1994; 14:497-508. https://doi.org/10.3233/CH-1994-14405 32. Cho YI, Kensey KR. Effects of the non-Newtonian viscosity of blood on flows in a diseased arterial ves-sel. Part 1: Steady flows. Biorheology.1991;28:241-262.PMID: 1932716 33. Shibeshi SS, Collins WE. The rheology of blood flow in a branched arterial system. Appl Rheol.2005;15:398-405.PMID:16932804 34. Kaliviotis E, Yianneskis M. On the effect of microstructural changes of blood on energy dissipation inCouette flow. Clin Hemorheol Microcirc.2008;39:235-242.https://doi.org/10.3233/CH-2008-1087PMID: 18503131 35. Cheung YK, Shiovitz D, Sia SK. Microfluidic-based lithography for fabrication of multicomponent bio-compatible microstructures. In: Herold KE, Rasooly A, editors. Lab on a Chip Technology: Fabricationand Microfluidics. Norfolk: Caister Academic Press; 2009. pp115-124. 36. Mehri R, LaplanteJ, Mavriplis C, Fenech M. Investigation of blood flow analysis and red blood cellaggregation. J Med Biol Eng. 2014;34:469-474. https://doi.org/10.5405/jmbe.1695 37. Mehri R, Mavriplis C, Fenech. Design of a microfluidic system for red blood cell aggregationinvestigation. J Biomech Eng, M. 2014;136:064501.https://doi.org/10.1115/1.4027351 PMID:24700377 38. Abdollahzadeh Jamalabadi MY, Daqiqshirazi M,Nasiri H, Safaei MR, Nguyen TK (2018) Modeling andanalysis of biomagnetic blood Carreau fluid flow through a stenosis artery with magnetic heat transfer:A transient study. PLoS One. 2018; 13:e0192138.https://doi.org/10.1371/journal.pone.0192138PMID:29489852 39. Vijayaratnam PRS,O'Brien CC, Reizes JA, Barber TJ, Edelman ER (2015) The impact of blood rheol-ogy on drug transport in stented arteries: steady simulations. PLoS One. 2015; 10(6):e0128178.https://doi.org/10.1371/journal.pone.0128178 PMID: 26066041 40. Mehri R, MavriplisC, Fenech M. Controlled microfluidic environment for dynamic investigation of redblood cell aggregation. J Vis Exp. 2015; 100: e52719. https://doi.org/10.3791/52719 PMID: 26065667 41. Pitts K, Mehri R, Fenech M, Mavriplis C. Micro-particle image velocimetry measurement of blood flow:Validation and analysis of data pre-processing and processing methods. Meas Sci Technol.2012; 23:105302. https://doi.org/10.1088/0957-0233/23/10/105302 42. Mehri R,Niazi E, Mavriplis C, Fenech M. An automatic method for dynamic Red Blood Cell aggregatedetection in microfluidic flow. Physiol Meas. 2018;39:01NT02. https://doi.org/10.1088/1361-6579/aaaOad PMID: 29227278 43. Ke'sma’rky G, Kenyeres P,Ra'bai M, To th K. Plasma viscosity: A forgotten variable. Clin HemorheolMicrocirc.2009;41:243-246.https://doi.org/10.3233/CH-2008-1088 44. More’JJ. The Levenberg-Marquardt algorithm: Implementation and theory. In: Watson GA, editors.Numerical Analysis: Lecture notes in Mathematics vol 630. Berlin,Heidelberg: Springer; 1977. pp105-116. 45. Spiess A, Neumeyer N. An evaluation of R?as an inadequate measure for nonlinear models in pharma-cological and biochemical research: A Monte Carlo approach.BMC Pharmacol.2010; 10: 1-11. 46. Neumann FJ,Schmid-Scho nbein H,Ohlenbusch H. Temperature-dependence of red cell aggregation.Pflu"gers Archiv. 1987; 408:524-530.https://doi.org/10.1007/BF00585080 47. Bessonov N, Sequeira A, Simakov S,Vassilevskii Yu, Volpert V. Methods of Blood Flow Modelling.Math Model Nat. 2016; 11:1-25.https://doi.org/10.1051/mmnp/201611101 48. Kim S, Popel AS, Intaglietta M, Johnson PC.Aggregate formation of erythrocytes in postcapillaryvenules. Am J Physiol Heart Circ Physiol. 2005;288: H584-H590. https://doi.org/10.1152/ajpheart.00690.2004 PMID: 15458951 49. Kim S,Zhen J, Popel AS, Intaglietta M, Johnson PC. Contributions of collision rate and collision effi-ciency to erythrocyte aggregation in postcapillary venules at low flow rates. AmJ Physiol Heart CircPhysiol.2007;293:H1947-H1954. https://doi.org/10.1152/ajpheart.00764.2006 PMID: 17616741 50. Mehri, R. Red Blood Cell Aggregation Characterization: Quantification and modeling implications of redblood cell aggregation at low shear rates. PhD Thesis, University of Ottawa.2016. 51. Lipowsky H, USAMI S, Chien S. In vivo measurements of“apparent viscosity" and mcrovessel hemato-crit in the mesentery of the cat. Microvasc Res. 1980;19:297-319. https://doi.org/10.1016/0026-2862(80)90050-3 PMID:7382851 ( 52. Popel AS, Johnson PC. Microcirculation and Hemorheology. Annu Rev Fluid Mech. 2005;37:43-69. https: / /d o i .o rg/ 1 0. 1 146/ a n n urev. flu id . 3 7 .042 60 4 .13393 3 PMID: 21 1 51 769 ) ( 53. Gross JF, Intaglietta M, Zweifach BW. Network m o del of pulsatile hemodynamics in t he microcirculation of the rabbit omentum. Am J Physiol. 1974; 226: 1117-1123.ht t ps : / /d o i.o rg / 1 0 . 1 1 5 2/ajpl e gacy . 1 9 74. 226.5. 1 1 17 PMID: 482 4 864 ) PLOS ONE|https://doi.org/journal.pone. July Red blood cells (RBCs) are the most abundant cells in human blood. Remarkably RBCsdeform and bridge together to form aggregates under very low shear rates. The theory andmechanics behind aggregation are, however, not yet completely understood. The mainobjective of this work is to quantify and characterize RBC aggregates in order to enhancethe current understanding of the non-Newtonian behaviour of blood in microcirculation.Suspensions of human blood were flowed and observed in vitro in poly-di-methyl-siloxane(PDMS) microchannels to characterize RBC aggregates. These microchannels were fabricated using standard photolithography methods. Experiments were performed using amicro particle image velocimetry (μPIV) system for shear rate measurements, coupled witha high-speed camera for flow visualization. RBC aggregate sizes were quantified in controlledand measurable shear rate environments for 5, 10 and 15% hematocrit. Aggregatesizes were determined using image processing techniques, while apparent viscosity wasmeasured using optical viscometry. For the samples suspended at 5% H, aggregate sizewas not strongly correlated with shear rate. For the 10% H suspensions, in contrast, loweringthe shear rate below 10 s-1 resulted in a significant increase of RBC aggregate sizes.The viscosity was found to increase with decreasing shear rate and increasing hematocrit,exemplifying the established non-Newtonian shear-thinning behaviour of blood. Increase inaggregation size did not translate into a linear increase of the blood viscosity. Temperaturewas shown to affect blood viscosity as expected, however, no correlation for aggregate sizewith temperature was observed. Non-Newtonian parameters associated with power law andCarreau models were determined by fitting the experimental data and can be used towardsthe simple modeling of blood's non-Newtonian behaviour in microcirculation. This workestablishes a relationship between RBC aggregate sizes and corresponding shear ratesand one between RBC aggregate sizes and apparent blood viscosity at body and room temperatures,in a microfluidic environment for low hematocrit. Effects of hematocrit, shear rate,viscosity and temperature on RBC aggregate sizes have been quantified.
关闭-
1/26
-
2/26
还剩24页未读,是否继续阅读?
继续免费阅读全文产品配置单
北京欧兰科技发展有限公司为您提供《微流控系统红细胞聚集对非牛顿血液中速度场粘度检测方案(粒子图像测速)》,该方案主要用于全血/血清/血浆中物理指标检测,参考标准《暂无》,《微流控系统红细胞聚集对非牛顿血液中速度场粘度检测方案(粒子图像测速)》用到的仪器有显微粒子成像测速系统(Micro PIV)。
我要纠错
推荐专场


相关方案
 咨询
咨询