

方案详情文
智能文字提取功能测试中
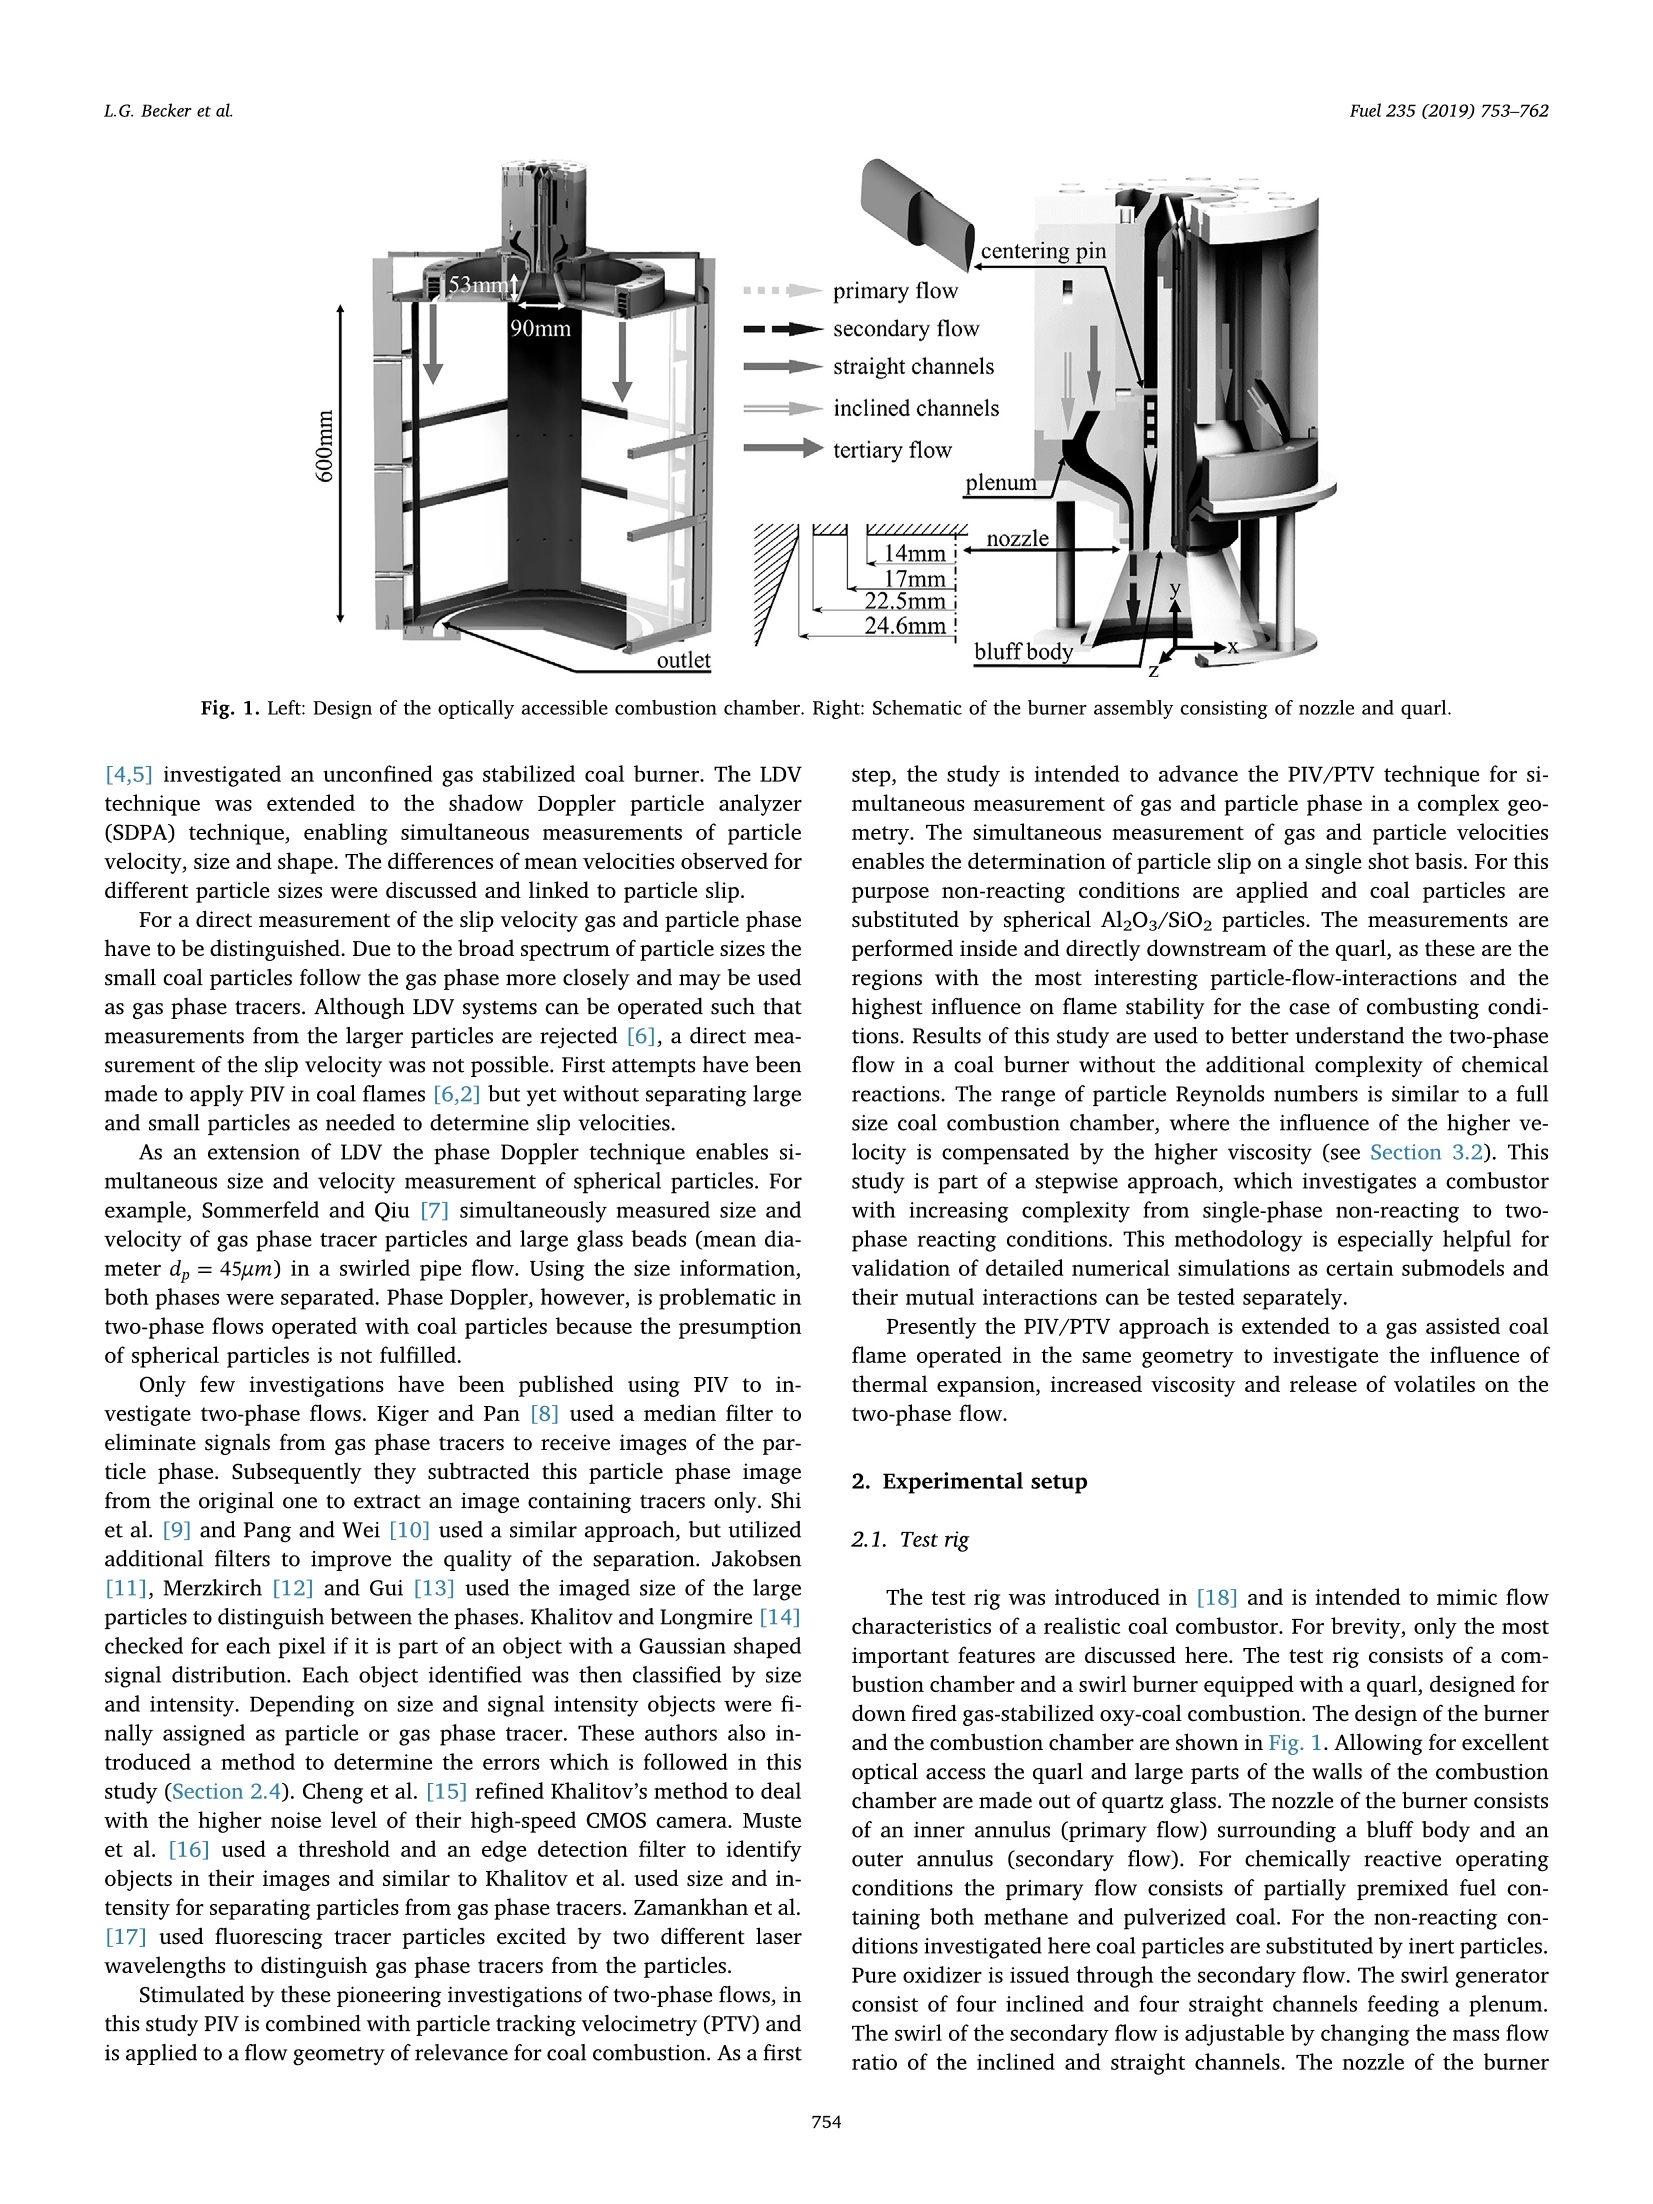
Fuel 235 (2019)753-762Contents lists available at ScienceDirect L.G. Becker et al.Fuel 235 (2019)753-762 Fuel journal homepage: www.elsevier.com/locate/fuel Full Length Article Experimental investigation of particle-laden flows in an oxy-coalcombustion chamber for non-reacting conditions Lukas G. Becker *, Thomas von Langenthal, Stefan Pielsticker, Benjamin Bohm ,Reinhold Kneer, Andreas Dreizler Institute Reactive Flows and Diagnostics, Technical University Darmstadt, Otto-Berndt-Str. 3, 64287 Darmstadt, Germany"Institute of Heat and Mass Transfer, RWTH Aachen University, Augustinerbach 6, 52062 Aachen, Germany ARTICLEINFO ABSTRACT Keywords:Swirl burnerPIVPTVTwo-phaseOxy-fuel Coal Investigating the two-phase flow in close-to-realistic geometries is essential to gain a more detailed under-standing of coal combustion.Particularly the slip velocity between solid fuel particles and the surrounding gasphase has a significant effect on local heat transfer and gas composition. Experimental investigations that focuson two-phase flows in combustion chambers are sparse. In this work the two-phase flow in a combustionchamber optimized for oxy-coal operation is investigated for non-reacting conditions. The aim is to advance themeasurement technique and to reveal the differences of particle and gas velocities needed to estimate the in-stantaneous slip velocity of the particles. The investigation covers the most important regions for flame stabi-lization where volatiles are released: inside the quarl and directly downstream of the quarl close to the dumpplane. The quarl and large parts of the combustion chamber are made of quartz glass, enabling particle imagevelocimetry (PIV) and particle tracking velocimetry (PTV). Two-phase PIV/PTV measurements were performedusing tracer particles (0.5 um) to track the gas flow and solid particles (40-80 um) representing grinded coal.Using double-exposure Mie imaging, gas phase tracers and particles were simultaneously recorded and separatedduring post-processing. As the gas and the particle velocity fields are measured simultaneously, the slip velocityis accessible. Measurement errors are estimated and discussed in detail. Differences of gas and particle velocityfields are shown and particle trajectories are analyzed. Operation conditions covered flows for three differentparticle loadings with relevance for oxy-coal and air-coal combustion. Coal power plants are of utmost importance for power generationand will remain a pillar of electrical energy production in the foresee-able future [1]. For lowering CO2 emissions from coal combustion,carbon capture and usage/storage offers a high potential where CO2 isextracted from the exhaust gas. Out of the variety of different tech-nologies and due to the absence of molecular nitrogen in the exhaustgas oxy-coal combustion is highly promising. Applying the oxy-coaltechnology, pulverized coal is burned in an atmosphere of oxygen andrecirculated exhaust gas consisting to a large fraction of water vaporand CO2. This atmosphere strongly differs from combustion with air asoxidant and influences radiation properties, flame stability and che-mical reaction kinetics. For approaching towards predictive en-gineering the complex physical and chemical processes determiningoxy-coal combustion are not yet sufficiently well understood and needto be investigated in more detail. *Corresponding author. Coal is usually grinded and then fed as dust into the combustionchamber. The dust contains a broad spectrum of particle sizes.Compared to small particles, the large particle fractions do not closelyfollow the gas flow, generating a slip velocity between gas and particlephase. The slip velocity influences the exchange of heat and mass be-tween gas and coal particles which influences the combustion process. Experimental investigations of slip velocities are rare in coal com-bustors and so far slip velocities were measured indirectly only.Balusamy et al. [2] used laser Doppler velocimetry (LDV) and particleimage velocimetry (PIV) in an unconfined gas-stabilized coal flame. Byusing either alumina or coal particles and comparing the LDV to the PIVresults, regions exhibiting different mean particle and gas velocitieswere identified, indicating significant slip velocities. El Gendy et al. [3]seeded coal particles of different size distributions into a laminar gasflame and measured different velocities for differently sieved coalparticle fractions. These different velocities were attributed to non-zeroslip velocities that depend on the different particle sizes. Hwang et al. E-mail address: becker@rsm.tu-darmstadt.de (L.G. Becker). ( ht t p s :// doi.o rg/ 1 0 . 1016/j. f uel.2 0 18.08.07 6 ) ( Received 1 June 2018; Received in revised form 9 August 2018; Accepted 15 August 2018Available online 24 August 2 018 ) ( 0016-2361/C 2 018 Elsevier Ltd. All rights r eserved. ) Fig. 1. Left: Design of the optically accessible combustion chamber.Right: Schematic of the burner assembly consisting of nozzle and quarl. [4,5] investigated an unconfined gas stabilized coal burner. The LDVtechnique was extended to the shadow Doppler particle analyzer(SDPA) technique, enabling simultaneous measurements of particlevelocity, size and shape. The differences of mean velocities observed fordifferent particle sizes were discussed and linked to particle slip. For a direct measurement of the slip velocity gas and particle phasehave to be distinguished. Due to the broad spectrum of particle sizes thesmall coal particles follow the gas phase more closely and may be usedas gas phase tracers. Although LDV systems can be operated such thatmeasurements from the larger particles are rejected [6], a direct mea-surement of the slip velocity was not possible. First attempts have beenmade to apply PIV in coal flames [6,2] but yet without separating largeand small particles as needed to determine slip velocities. As an extension of LDV the phase Doppler technique enables si-multaneous size and velocity measurement of spherical particles. Forexample, Sommerfeld and Qiu [7] simultaneously measured size andvelocity of gas phase tracer particles and large glass beads (mean dia-meter dp=45um) in a swirled pipe flow. Using the size information,both phases were separated. Phase Doppler,however, is problematic intwo-phase flows operated with coal particles because the presumptionof spherical particles is not fulfilled. Only few investigations have been published using PIV to in-vestigate two-phase flows. Kiger and Pan [8] used a median filter toeliminate signals from gas phase tracers to receive images of the par-ticle phase. Subsequently they subtracted this particle phase imagefrom the original one to extract an image containing tracers only. Shiet al. [9] and Pang and Wei [10] used a similar approach, but utilizedadditional filters to improve the quality of the separation. Jakobsen[11], Merzkirch [12] and Gui [13] used the imaged size of the largeparticles to distinguish between the phases. Khalitov and Longmire [14]checked for each pixel if it is part of an object with a Gaussian shapedsignal distribution. Each object identified was then classified by sizeand intensity. Depending on size and signal intensity objects were fi-nally assigned as particle or gas phase tracer. These authors also in-troduced a method to determine the errors which is followed in thisstudy (Section 2.4). Cheng et al. [15]refined Khalitov’s method to dealwith the higher noise level of their high-speed CMOS camera. Musteet al.[16] used a threshold and an edge detection filter to identifyobjects in their images and similar to Khalitov et al. used size and in-tensity for separating particles from gas phase tracers. Zamankhan et al.[17] used fluorescing tracer particles excited by two different laserwavelengths to distinguish gas phase tracers from the particles. Stimulated by these pioneering investigations of two-phase flows, inthis study PIV is combined with particle tracking velocimetry (PTV) andis applied to a flow geometry of relevance for coal combustion. As a first step, the study is intended to advance the PIV/PTV technique for si-multaneous measurement of gas and particle phase in a complex geo-0mmetry. The simultaneous measurement of gas and particle velocitiesenables the determination of particle slip on a single shot basis. For thispurpose non-reacting conditions are applied and coal particles aresubstituted by spherical Al2O3/SiO2 particles. The measurements areperformed inside and directly downstream of the quarl, as these are theregions with the most interesting particle-flow-interactions and thehighest influence on flame stability for the case of combusting condi-tions. Results of this study are used to better understand the two-phaseflow in a coal burner without the additional complexity of chemicalreactions. The range of particle Reynolds numbers is similar to a fullsize coal combustion chamber, where the influence of the higher ve-locity is compensated by the higher viscosity (see Section 3.2). Thisstudy is part of a stepwise approach, which investigates a combustorwith increasing complexity from single-phase non-reacting to two-phase reacting conditions. This methodology is especially helpful forvalidation of detailed numerical simulations as certain submodels andtheir mutual interactions can be tested separately. Presently the PIV/PTV approach is extended to a gas assisted coalflame operated in the same geometry to investigate the influence ofthermal expansion, increased viscosity and release of volatiles on thetwo-phase flow. 2. Experimental setup 2.1. Test rig The test rig was introduced in [18] and is intended to mimic flowcharacteristics of a realistic coal combustor. For brevity, only the mostimportant features are discussed here. The test rig consists of a com-bustion chamber and a swirl burner equipped with a quarl, designed fordown fired gas-stabilized oxy-coal combustion. The design of the burnerand the combustion chamber are shown in Fig. 1. Allowing for excellentoptical access the quarl and large parts of the walls of the combustionchamber are made out of quartz glass. The nozzle of the burner consistsof an inner annulus (primary flow) surrounding a bluff body and anouter annulus (secondary flow). For chemically reactive operatingconditions the primary flow consists of partially premixed fuel con-taining both methane and pulverized coal. For the non-reacting con-ditions investigated here coal particles are substituted by inert particles.Pure oxidizer is issued through the secondary flow. The swirl generatorconsist of four inclined and four straight channels feeding a plenum.The swirl of the secondary flow is adjustable by changing the mass flowratio of the inclined and straight channels. The nozzle of the burner Fig. 2. Design of the particle feeder. leads into the conical quarl, which merges with the top of the com-bustion chamber at the dump plane. Additional oxidizer is directly fedinto the combustion chamber through an annulus close to the com-bustor walls (tertiary flow). The particle feeder is mounted upstream of the burner and is shownin Fig. 2. The feeder consists of a cylinder (diameter 140 mm) con-taining in- and outlet pipes and a rotating disc. The rotating disc (4mmthick) is mounted at the bottom of the cylinder located between theinlet and outlet pipe.The rotating disc has small holes (4mm in dia-meter) circularly arranged at two radii of 108 and 117 mm that trans-port the particles to the gap between the inlet and outlet pipes. Ap-plying an airflow controlled by an electronic mass flow controller,particles are transported to the nozzle. The disc is mounted to a driveshaft and driven by an electric motor via magnetic coupling. The par-ticle mass flow is regulated by the turning speed of the disc and theaverage feeding rate is measured by mounting the feeder on a balance. 2.2. Operating conditions Two non-reacting cases were selected from [18] that comprise flowconditions relevant for oxy-coal combustion (NR30) and conventionalair-coal combustion.Volume flows for both cases are listed in Table 1.For both cases the swirl number at the nozzle exit for the combinedprimary and secondary flows was 0.47. The particles substituting grinded coal were spherical and consistedof a compound of 75%Al20s and 25% SiO2 with a density ofp,=3.6g/cm. The particle size distribution is listed in Table 2 andexhibited an arithmetic mean diameter of dp=55um. Compared to coalparticles the selected particles had a three times larger density such that Table 1 Volume flows of operation points NR30 (30 vol% 02 and 70 vol% CO2) andNRAir (Air) at normal conditions. Operation point NRAir NR30 Air/O2/CO2 [vol%] 100/0/0 0/30/70 I Oxidizer [m/h] 13.55 8.16 II Straight Oxid.[m/h] 5.97 3.76 II Inclined Oxid. [m/h] 12.02 7.27 III Oxidizer [m/h] 69.95 42.6 Table 2 Particle size distribution of the selected spherical Al2O3/SiO2 parti-cles substituting coal. Sizes measured via Laser diffraction (SympatecHELOS 12 Basis LA/Powder Laser diffraction analyser). Equivalent diam. [um] Cumulated vol. [%] 36 2.1 43 13.7 51 35.7 61 64.4 73 88.3 87 99.8 103 100 their aerodynamic behavior according to the response time [19] cor-responds to coal particles with a mean diameter of approximatelydp=95um. For each atmosphere three different particle loadings wereinvestigated: A high particle load of mp =2.0kg/h, a medium load ofmp=0.5kg/h, and a low load of below mp =0.1kg/h. The relative un-certainty was 3.6%, 14% and 72%, respectively, due to the resolution ofthe balance. For the low particle load the exact value could thereforenot be determined accurately such that it is labelled“low”in this work. 2.3. Measurement setup Measurements were performed in two regions located inside thequarl with a field of view (FOV) of 49x46 mm’and located downstreamof the dump plane using a FOV of 130x100 mm. The measurementshave been performed using a standard two-dimensional PIV setupmonitoring two in-plane velocity components which is depicted inFig. 3. The beam of a double-pulsed frequency-doubled Nd:YAG laser(New Wave Gemini) operating at 10 Hz was formed to a light sheet byfour cylindrical lenses. The second lens (-200 mm) in Fig. 3 was ad-justed to set the sheet thickness to 0.3 mm in the quarl and 0.5 mmdownstream of the dump plane. The time separation between the laserpulses (At) was 20 us in the quarl. For the measurements downstream ofthe dump plane At was increased to 30 us for NRAir and 50 us for NR30. A sCMOS camera (LaVision, imager sCMOS, 2560 x 2160 pixel, 16bit) was used for imaging Mie scattering. A Sigma 180 mm macro lensstopped at f# 3.5 combined with a 532 nm band-pass filter wasmounted in front of the camera. For measurements inside the quarl thecamera viewed the measurement plane at an angle of 20°to reducereflections from the wall. A Scheimpflug arrangement was used to tiltthe focal onto the measurement plane. For calibration downstream ofthe dump plane a rectangular target with 10 mm dot spacing (LaVision,Type 106-10) was used. Inside the quarl a high-resolution target(LaVision) with 1 mm dot spacing was milled to fit the cone of thequarl. Primary, secondary and tertiary flows were seeded with 0.5 um si-licon oil droplets to track the gas phase flow. Silicon oil droplets weregenerated by an AGF 10.0 seeder (Palas). Fig.3. PIV-Setup. Fig. 4. Different steps of the phase separation algorithm. Top left: Original image. Top right: Filtered image. Bottom left: image of tracers after separation. Bottomright: image of particles after separation. For both operation conditions and measurement locations 1000double images were recorded with seeding of gas phase tracers andparticles activated. Additionally 500 double images with either particleor tracer seeding activated were recorded for the error estimation(Section 2.4). 2.4. Phase separation Prior to processing by PIV and PTV algorithms (Section 2.5), the rawimages were separated into tracer and particle images. A part of asample raw image is shown in the top left of Fig. 4 (Original). Twodistinct types of signals can be identified. Particles consist of an ex-tended area of connected pixels at high intensity levels whereas the gasphase tracers are characterized by significantly lower intensity levelsimaged onto much fewer pixels. The differences in size and intensityenables a distinction of particles and gas phase tracers. The signal of thetracers exhibits a high spatial frequency which can be suppressed effi-ciently by a two-dimensional Wiener filter. In this work the Wienerfilter was used twice employing a mask size of three by three pixels. Afiltered image is exemplified in Fig. 4 at the top right (Filtered). Theintensity peaks of the tracers are smoothed, whereas the signals of theparticles remained more or less unchanged. In the next step of post-processing an intensity threshold of 1000 counts was applied on thefiltered images. The optimal threshold was determined from a para-metric variation applying different thresholds to the images down-stream of the dump plane obtained from the NR30 operation pointusing a particle load ofm,= 0.5kg/h. For each threshold the errors wereestimated using the procedure described in this section below. Forthresholds exceeding 1000 counts errors for particle and gas velocitiesincreased because less particles were detected and unidentified parti-cles biased the tracer images. For thresholds below 1000 counts errorsfor the gas velocity decreased due to less unidentified particles biasingthe tracer image. However, errors of particle velocities increaseddrastically because of an increasing number of gas phase tracers thatwere incorrectly identified as particles. After applying the threshold allremaining signals which consisted of more than 9 connected pixels were classified as a particles. For each particle at the edge the area waenlarged by 2 pixels to reduce the effect of halos imposed to the tracerimages (in this context halos identify regions of scattering with signalintensities below the threshold of 1000 counts originating from parti-cles. The halos surround the particle signal (Fig. 4 bottom left aroundthe big deleted particle)). The enlarged area was used as a mask andfinally applied to the raw images separating gas phase tracers fromparticle images. An example of a tracer and a particle image is shown inthe bottom of Fig. 4. : When applying the algorithm separating both phases different errorsources should be considered. Illumination: The cross section of the laser sheet approximately fol-lowed a Gaussian intensity distribution. Particles located centrally inthe laser sheet generated a brighter signal than those particles locatedin the wings. Particles outside the laser sheet but still within the depthof field of the imaging system might have been illuminated by multiplescattered light. For both scenarios particle size or scattering intensitymight have been sufficiently low to be erroneously identified as tracerparticles. Although these unidentified particles usually did not result inhigh correlation peak values in the PIV correlation map they might stillhave caused a bias in case other error sources were superimposed. Halos: Another error source arose from the particle halos whichspatially increased with the particle diameter. These halos might showthe highest correlation peak in case of low tracer signals. Thus the effectof the halo was reduced by enlarging the area identified as particle bytwo pixels in each direction. For most particle signals this was sufficientto eliminate their halos, but for the largest particle signals a halo re-mains in the tracer image. For operation conditions and regions withhigh particle loads, a large portion of the image eventually was occu-pied by particles. In these regions a significant fraction of the tracersignals were removed by the mask, whereas the fraction of particles(located out-of-plane) identified incorrectly as tracers and the areascontaining remaining halos particularly from large particles increased.In these regions the measured gas velocity is systematically biased to-wards the particle velocity. Particle position: Particle velocities were determined by a PTV Fig.5. Error estimation. Process chart for the estimation of errors arising fromphase separation. The error estimation is based on two independent measure-ments,one with tracers and one with particles only. These two measurements asthe starting point of the procedure are represented by the two boxes in the leftof the figure (tracers only; particles only). algorithm (Section 2.5). To estimate the particle position a Gaussianintensity distribution was fitted to the signal. Due to the application ofan intensity threshold only the high-intensity part of the particle imagewas considered for determining the particle position. If the signal wasaffected differently in the two subsequent exposures (i.e.due to out-of-plane motion) this might influence the measured particle velocities andresults in a statistical error. Error estimation: The error estimation was based on the methodpresented in [14] developed for two-phase PIV measurements. Usingthe measurements conducted with either the particle or the gas phasetracer seeding being activated, a process chart of this method is shownin Fig. 5. For each operation point data were processed individuallywith a PIV algorithm for determining gas phase velocities and a PTValgorithm for particle velocities. The resulting velocity fields served asreference. To mimic measurements with gas phase tracers and particlesbeing present, raw images of both independent measurements weresuperimposed. The resulting images do not represent any physicalrealization of the flow, but show similar optical properties to thoseimages obtained from the real two-phase measurements with tracersand particles. The separation algorithm was applied to the super-imposed images and separated tracer and particle images were pro-cessed with the PIV and PTV algorithms. Resulting vector fields of thegas and particle phase were subtracted from the reference fields to es-timate the overall error. Notice that for this error estimation the iden-tical optical setup and the same operation conditions as in the real two-phase flow measurements was used. 2.5. Processing Processing of the gas phase images (tracer images after phase se-paration) was performed using a standard PIV algorithm without anyfurther pre-processing (DaVis 8.3.0, LaVision). The PIV correlation wascalculated for decreasing window sizes from 128 × 128 pixels to 64x64pixels and an overlap of 75% resulting in a spatial resolution of 3.3 mmdownstream and 1.4 mm inside the quarl. The rather large final windowsize of 64× 64 pixels was used to reduce errors arising from themasked particles. During the post-processing vectors with a peak ratiosmaller than 1.1 were deleted and the results were median filtered withthe “universal outlier detection”option using a size of 5× 5 vectors.The overlap of 75% allowed for a two-time smoothing of 3 × 3 vectorswithout decreasing spatial resolution. Similar to the gas phase treatment, for processing of the particleimages no further pre-processing of the separated images was used. Ahybrid algorithm was used starting with PIV processing for an initialvelocity estimation followed by a PTV processing for determining thefinal velocity field. The PIV algorithm was operated with correlationwindows of 32 x 32 pixels without overlap. To reduce the probabilityof containing more than one particle in a single correlation window, the window size was chosen slightly larger than the largest particles de-tected. To ensure that correlation windows contained only one particle,vectors with a ratio between first and second correlation peaks smallerthan 5 were deleted. The correlation window size for each particle was16 ×16 pixels and a deviation of up to 2 pixels from the velocity es-timation by PIV was tolerated. The instantaneous slip velocity was estimated using the simulta-neously measured gas and particle velocities. For each particle velocityvector the difference to the gas velocity vector closest to its location wascalculated. In case of a missing gas velocity vector at the PIV grid pointlocated closest to the particle vector, no slip velocity was calculated.Each gas velocity vector represents a spatially averaged velocity de-termined by the correlation window size. Accordingly the slip velocitywas calculated as the difference of the local particle velocity to the gasvelocity7 spatially averaged over 1.4×1.4mm2insideaand3.3 ×3.3 mm²downstream of the quarl. The velocity magnitude of theinstantaneous slip velocity was averaged to finally estimate the meanslip velocity magnitude. Depending on the examined area the mean slipvelocity deduced from averaging instantaneous slip velocities canstrongly differ from the difference of mean gas and mean particle ve-locities. This justifies the procedure applied in this study. The results of the PTV processing are on a very fine but sparselypopulated grid. For supporting the assessment of the measurements,theparticle and slip velocity fields were interpolated on the coarser grid ofthe gas velocity. For the interpolation each data point was weightedwith the number of vectors that was used during the averaging process. 3. Results and discussion 3.1. Characteristics of the two-phase flow The operating point NR30 with a particle load of mp =0.5kg/h isused to discuss important characteristics of the two-phase flow. Resultsfor the other operating condition globally showed similar propertiesand are presented in Appendix A. The flow field of the gas phase is shown in the left part of Fig.6 andexhibits globally similar properties as observed for the single-phaseflow discussed in [18]. A large recirculation zone forms in the center ofthe quarl with low velocity magnitudes. Crossing the dump plane therecirculation zone first broadens but then narrows due to vortexbreakdown causing larger velocity magnitudes compared to regionsinside the quarl. The recirculation zone is enveloped by primary andsecondary flows which merge approximately 10-15 mm downstreamthe nozzle exit. The merged flow is termed“main flow”in the fol-lowing. By the interaction with the central recirculation zone the mainflow is pushed towards the walls of the quarl but without significantdissipation of its initial momentum. Decreasing velocity magnitudes ofthe main flow is only observed when the region of the vortex break-down is approached. Mean particle velocities are presented in the middle of Fig. 6.Downstream of the dump plane particle velocities are rather similar tothose of the gas phase, whereas inside the quarl and particularly withinthe central recirculation zone a significant difference is observed. Theinterpretation of these velocity fields needs the spatial particle dis-tribution shown in Fig. 7. Inside the quarl the majority of the particlesare observed directly below the annulus of the primary flow that issuesparticles into the combustor. In this region particle velocity magnitudesare distinctly larger than those measured for the gas phase and theirdirection (downwards) is opposed to the central recirculation zone(upwards) of the gas phase. A significantly smaller fraction of particlesis observed close to the wall of the lower part of the quarl where gen-erally directions of gas and particle flows are aligned to each other.However, the streamlines of the mean particle flow field shown in Fig.6do not represent the actual particle trajectories accurately at all loca-tions which becomes obvious when inspecting the probability densityfunction (PDF) of the axial particle velocity taken from the recirculation Fig. 6. Mean flow field. Two-phase flow of NR30 atmosphere with particle load of mp=0.5kg/h. Top row: inside quarl. Bottom row: downstream of dump plane;notice the different scales for top and bottom rows. Velocity magnitude in columns from left to right: Gas, Particles, Slip. Fig. 8. PDF of the axial particle velocity below the primary flow. The used areato create the PDF is indicated with red lines in the top right corner. Particlesmoving downwards have negative velocities. (For interpretation of the refer-ences to colour in this figure legend, the reader is referred to the web version ofthis article.) motion of the recirculation zone. The second peak on the right in Fig. 8is located at about +0.2 m/s. These particles move slowly upwards.They already lost their initial momentum and are carried upwards bythe recirculating gas flow. To lose their momentum it is likely that theseparticles spend significantly more time inside the recirculation zonethan the particles contributing to the first mode. Fig. 7. Particle distribution. Average of 500 camera images of Mie-scatter-measurements with particles, but without tracers; notice the different scales inboth images. zone below the exit of the primary flow (Fig. 8). The bimodal dis-tribution is indicating that the particles in that area have resided fordifferent times in the quarl following two main paths. The peak on theleft side located at approximately -4 m/s comprises fast particlesmoving downwards. These particles just issued from the nozzle and dueto their large momentum and slow particle response time they keepmoving straight downwards and cannot follow the primary gas flowtowards the wall or decelerate fast enough to follow the upwards To further support this hypothesis Fig. 9 shows the mean flow fieldconditionally averaged for particles moving in downwards (middle) andupwards directions (right). Particles moving downwards are movingrather straight down with only little movement towards the envelopingmain gas flow. In contrast, the streamlines of the upwards movingparticles (Fig.9, right) are pointing more towards the side indicating atransport of particles from the center towards the main flow and thewall of the quarl. Instantaneously measured velocities of gas and particle phase arefinally used to estimate instantaneous slip velocities as the base tocalculate local mean values. The magnitude of the mean slip velocity is Fig. 9. Conditioned mean velocities of particles. Two-phase flow of NR30 atmosphere with particle load of mp=0.5kg/h. Top row: inside quarl. Bottom row:downstream of the dump plane. Velocity magnitude in columns from left to right: all particles, particles moving downstream, particles moving upstream. Notice thedifferent scales in top and bottom rows. axial slip velocity [m/s] Fig.10. PDFs of axial slip velocity in two different areas. Left: In the recirculation zone below the primary flow. Right: In the main flow below the quarl exit. The usedareas to create the PDFs are indicated with red lines. Ve denotes the gas phase velocity and v denotes the particle velocity. (For interpretation of the references tocolour in this figure legend, the reader is referred to the web version of this article.) shown in Fig. 6 (right). Inside the quarl three regions with significantslip velocity magnitudes are observed. Directly at the nozzle exit of theprimary flow (that carries the particles) a high slip is observed becauseof the design of the burner. As shown in Fig. 1 upstream the nozzle exita contraction accelerates the gas flow by a factor of 2.3. The particleinertia retards their rapid acceleration causing the slip close to thenozzle. The second region of high slip is associated to particles withhigh momentum issuing directly from the nozzle moving downwards inopposite direction of the recirculation zone and penetrate into it. Forthis particular region the PDF in Fig. 10 (left) shows the slip velocity inaxial direction. The peak at the left with high negative slip velocities isa result of particles penetrating with large momentum into the re-circulation zone. Once equilibrated to the local gas phase velocity, theslip decreases towards zero which is represented by the peak at aroundzero. How long it takes to equilibrate the particle velocities to that ofthe gas phase is heavily affected by turbulence and particle size. De-pending on the instantaneous gas velocity field and the particles inertia,particles either are stopped inside the recirculation zone or cross therecirculation zone. Particles that cross the recirculation zone are sloweddown, then move outwards and join the main flow between y= 0 andy =40. Particles that are stopped in the recirculation zone are carried upwards and outwards and join the main flow inside the quarl. By in-specting the particle and gas velocity fields of Fig. 6, most particlesequilibrated to the local gas phase velocity at approximatelyy= 25 mm. The third region inside the quarl showing significant slip islocated in the primary flow and after merging with the secondary flowwithin the main flow. Reasons for significant slip in this region are bothcurved streamlines in a region between y= 53 and 40 mm and strongshear in the main flow associated with slowly moving particles enteringfrom the recirculation zone. Downstream of the dump plane (Fig. 6, bottom right) magnitudes ofthe mean slip are much lower. This is confirmed by the PDF presentedin Fig. 10 (right). As the distribution is approximately symmetricaround zero it becomes obvious that the mean value containing thedirection is not a suitable measure for a representative slip velocity.Instead, the mean of the magnitude of the slip velocity differs sig-nificantly from zero and appears as better suited to characterizetransport processes between gas and particle phase. With respect to combustion the rather low particle velocities at thenozzle exit as well as the particles penetrating into the recirculationzone are a beneficial feature for coal combustion. Specifically largerparticles reside for a longer time inside a high temperature environment Fig. 11. Mean errors associated to phase separation estimated by the procedure presented in Section 2.4. Two-phase flow of NR30 atmosphere with particle load ofmp =0.5kg/h. Top row: inside quarl. Bottom row: downstream of the dump plane. Velocity magnitude of mean error in columns from left to right: Gas, Particles, Slip.Encircled in red in left column: regions with systematic error. Notice the different scales in top and bottom rows. (For interpretation of the references to colour in thisfigure legend, the reader is referred to the web version of this article.) than gaseous fluid elements that originally carried the particles. Thissupports the release of gaseous volatiles inside the quarl which arecrucial for flame stabilization. This hypothesis is supported by in-specting particle trajectories shown in high-speed videos of a gas-as-sisted coal flame provided in the supplemental material. The first videois a recording of Mie-scattering, showing trajectories of all particlescrossing the central plane. The other two videos are recordings of lu-minescence imaging of reacting coal particles and soot radiation fromthe entire volume. It was also investigated if the presence of particles changes the meanflow field of the gas phase (flow modulation). For this purpose and forotherwise identical inflow conditions mean gas velocities were mea-sured both with i) tracer and particle seeding activated and ii) withtracers only. Comparing the results and in the limits of uncertainties(compare Section 3.4) no significant effect was observed. 3.2. Particle Reynolds numbers In a two-phase flow the particles can either generate turbulence bythe separation of wakes from the trailing end of the particle or dampenturbulence due to their drag. While the dampening of turbulence isalways present to some degree, the generation of turbulence occurs onlyif wakes separate and are carried into the gas flow. Depending on theparticle Reynolds number Re, there are different flow regimes around asphere. For low Re, numbers the particle does not form a wake. For24 < Rep <130 a stable axisymmetric attached wake forms behind theparticle [20]. For 210
-
1/10
-
2/10
还剩8页未读,是否继续阅读?
继续免费阅读全文产品配置单


北京欧兰科技发展有限公司为您提供《氧煤燃烧室中速度场检测方案(粒子图像测速)》,该方案主要用于煤炭中速度场检测,参考标准《暂无》,《氧煤燃烧室中速度场检测方案(粒子图像测速)》用到的仪器有德国LaVision PIV/PLIF粒子成像测速场仪、LaVision DaVis 智能成像软件平台。
我要纠错
推荐专场


相关方案
-
方案 非预混火焰中5 kHz OH∗ 自发荧光和 OH 平面激光诱导荧光(OH PLIF)检测方案(CCD相机)
煤炭 | 5 kHz OH∗ 自发荧光和 OH 平面激光诱导荧光(OH PLIF)

- 查看全部方案
 咨询
咨询