

方案详情文
智能文字提取功能测试中
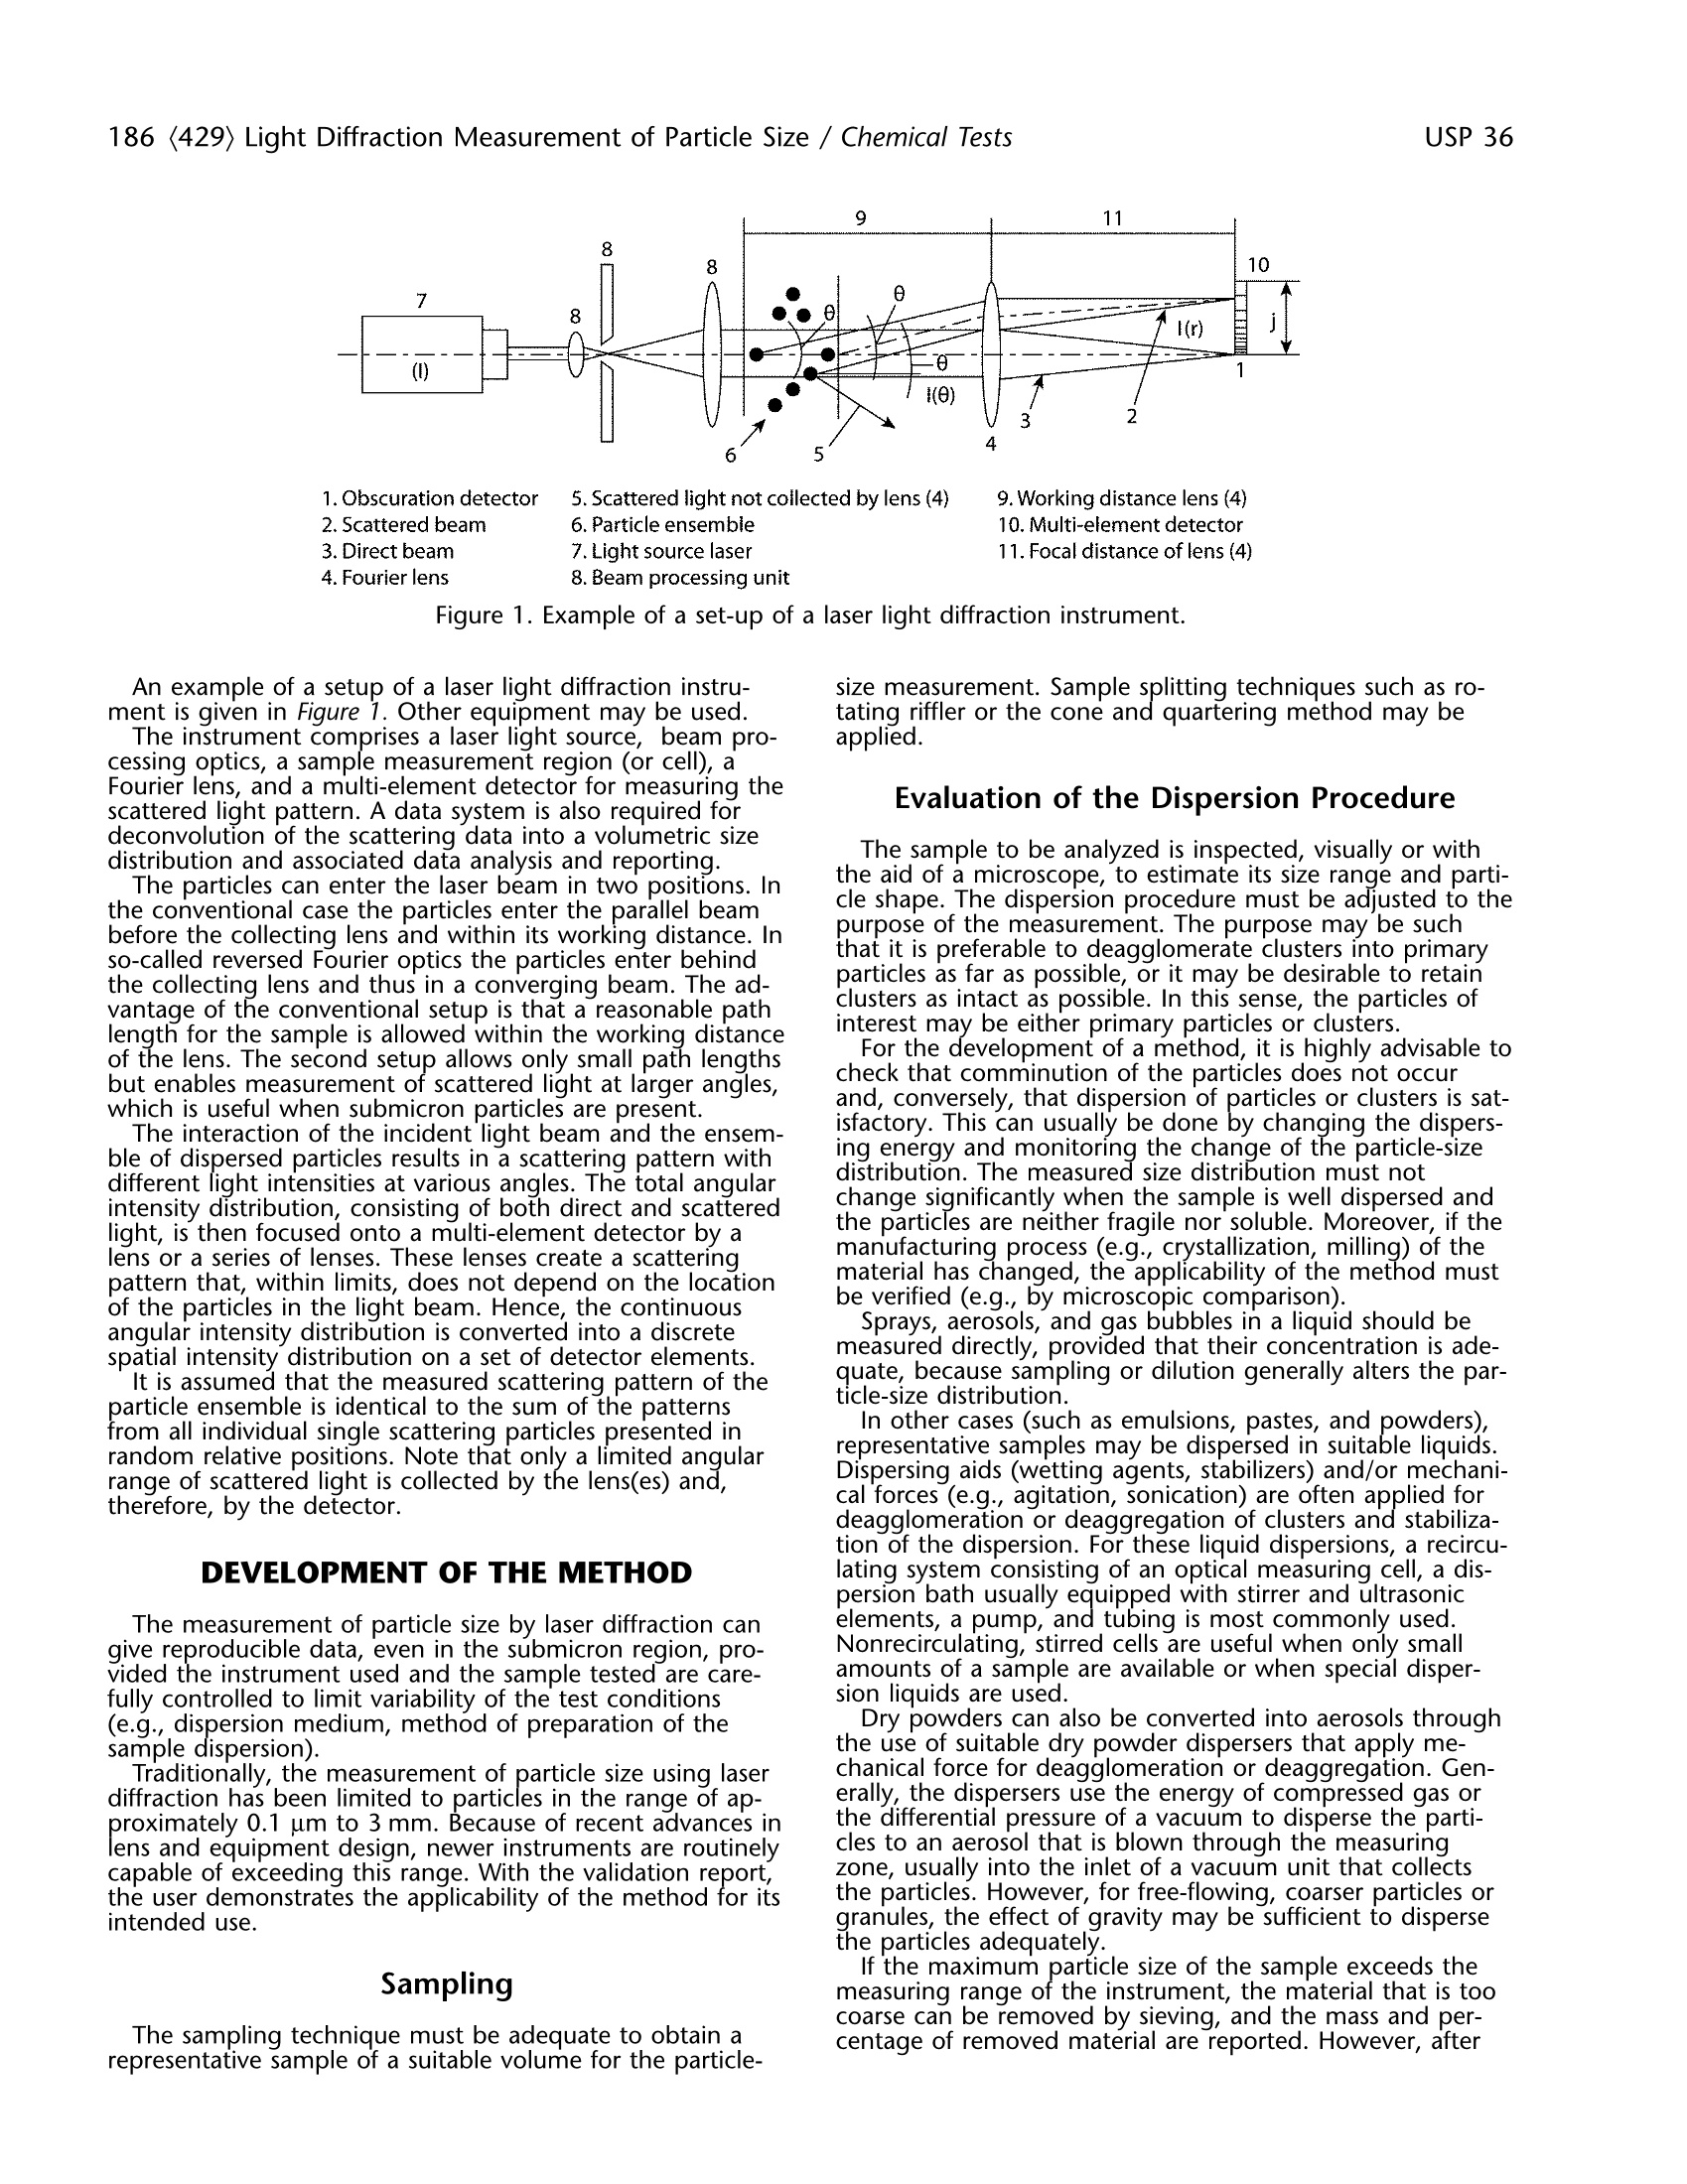
USP 36Chemical Tests / (429) Light Diffraction Measurement of Particle Size 185 186 (429) Light Diffraction Measurement of Particle Size / Chemical TestsUSP 36 tration of about that specified in the table. Pipet 2.0 mL ofthis solution into each of two 125-mL glass-stoppered coni-cal flasks. Solvents and Final Concentrations Antibiotic Solvent* Final Concentration Amoxicillin Water 1.0 mg per mL Ampicillin Water 1.25 mg_per mL Ampicillin Sodium Buffer No. 1 1.25 mg per mL Cloxacillin Sodium Water 1.25 mg per mL Cyclacillin Water 1.0 mg per mL Dicloxacillin Sodium Buffer No. 1 1.25 mg per mL Methicillin Sodium Buffer No. 1 1.25 mg per mL Nafcillin Sodium Buffer No. 1 1.25 mg per mL Oxacillin Sodium Buffer No. 1 1.25 mg per mL Penicillin G Potassium Buffer No. 1 2,000 units per mL Penicillin G Sodium Buffer No. 1 2,000 units per mL Penicillin V Potassium Buffer No. 1 2,000 units per mL Phenethicillin Potassium Buffer No. 1 2,000 units per mL *Unless otherwise noted, the Buffers are the potassium phosphatebuffers defined in the section Media and Diluents under Antibiotics-Microbial Assays (81), except that sterilization is not required beforeuse. Assay Preparation-Unless otherwise specified in the in-dividual monograph, dissolve in the solvent specified in thetable of Solvents and Final Concentrations a suitable quantity,accurately weighed, of the specimen under test, and dilutequantitatively with the same solvent to obtain a solutionhaving a known final concentration of about that specifiedin the table. Pipet 2 mL of this solution into each of two125-mL glass-stoppered conical flasks. Procedure- Inactivation and Titration-To 2.0 mL of the StandardPreparation and of the Assay Preparation, in respective flasks,add 2.0 mL of 1.0 N sodium hydroxide, mix by swirling,and allow to stand for 15 minutes. To each flask add 2.0 mLof 1.2 N hydrochloric acid, add 10.0 mL of 0.01 N iodineVS, immediately insert the stopper, and allow to stand for15 minutes. Titrate with 0.01 N sodium thiosulfate VS. Asthe endpoint is approached, add 1 drop of starch iodidepaste TS, and continue the titration to the discharge of theblue color. Blank Determination-To a flask containing 2.0 mL of theStandard Preparation add 10.0 mL of 0.01 N iodine VS. Ifthe Standard Preparation contains amoxicillin or ampicillin,immediately add 0.1 mL of 1.2 N hydrochloric acid. Imme-diately titrate with 0.01 N sodium thiosulfate VS. As theendpoint is approached, add 1 drop of starch iodide pasteTS, and continue the titration to the discharge of the bluecolor. Similarly treat a flask containing 2.0 mL of the AssayPreparation. Calculations-Calculate the microgram (or unit) equiva-lent (F) of each mL of 0.01 N sodium thiosulfate consumedby the Standard Preparation by the formula: in which C is the concentration, in mg per mL, of ReferenceStandard in the Standard Preparation, P is the potency, in ug(or units) per mg, of the Reference Standard, B is the vol-ume, in mL, of 0.01 N sodium thiosulfate consumed in theBlank determination, and I is the volume, in mL, of 0.01 Nsodium thiosulfate consumed in the lnactivation and titra- tion. Calculate the potency of the specimen under test bythe formula given in the individual monograph. (429) LIGHT DIFFRACTIONMEASUREMENT OF PARTICLESIZE INTRODUCTION The method is based on the ISO standards 13320-1(1999)and 9276-1(1998). This general chapter has been harmonized with the corre-sponding texts of the European Pharmacopoeia and/or theJapanese Pharmacopoeia. The laser light diffraction technique used for the determi-nation of particle-size distribution is based on the analysis ofthe diffraction pattern produced when particles are exposedto a beam of monochromatic light. Historically, the earlylaser diffraction instruments only used scattering at small an-gles. However, the technique has since been broadened toinclude laser light scattering in a wider angular range andapplication of the Mie theory, in addition to the Fraunhoferapproximation and anomalous diffraction. The technique cannot distinguish between scattering bysingle particles and scattering by clusters of primary parti-cles, i.e., by agglomerates or aggregates. As most particu-late samples contain agglomerates or aggregates and as thefocus of interest is generally on the size distribution of pri-mary particles, the clusters are usually dispersed into pri-mary particles before measurement. For nonspherical particles, an equivalent sphere-size distri-bution is obtained because the technique assumes sphericalparticles in its optical model. The resulting particle-size dis-tribution may differ from those obtained by methods basedon other physical principles (e.g., sedimentation, sieving). This chapter provides guidance for the measurement ofsize distributions of particles in different dispersed systems(e.g., powders, sprays, aerosols, suspensions, emulsions, andgas bubbles in liquids),through analysis of their angularlight-scattering patterns. It does not address specific require-ments of particle-size measurement of specific products. PRINCIPLE A representative sample, dispersed at an adequate con-centration in a suitable liquid or gas, is passed through abeam of monochromatic light, usually a laser. The lightscattered by the particles at various angles is measured by amulti-element detector. Numerical values representing thescattering pattern are then recorded for subsequent analysis.These scattering pattern values are then transformed, usingan appropriate optical model and mathematical procedure,to yield the proportion of total volume to a discrete numberof size classes, forming a volumetric particle-size distribution. INSTRUMENT The instrument is located in an environment where it isnot affected by electrical noise, mechanical vibrations, tem-perature fluctuations, humidity, or direct bright light. 4. Fourier lens 8.Beam processing unit Figure 1. Example of a set-up of a laser light diffraction instrument. An example of a setup of a laser light diffraction instru-ment is given in Figure 1. Other equipment may be used. The instrument comprises a laser light source, beam pro-cessing optics, a sample measurement region (or cell), aFourier lens, and a multi-element detector for measuring thescattered light pattern. A data system is also required fordeconvolution of the scattering data into a volumetric sizedistribution and associated data analysis and reporting. The particles can enter the laser beam in two positions. Inthe conventional case the particles enter the parallel beambefore the collecting lens and within its working distance. Inso-called reversed Fourier optics the particles enter behindthe collecting lens and thus in a converging beam. The ad-vantage of the conventional setup is that a reasonable pathlength for the sample is allowed within the working distanceof the lens. The second setup allows only small path lengthsbut enables measurement of scattered light at larger angles,which is useful when submicron particles are present. The interaction of the incident light beam and the ensem-ble of dispersed particles results in a scattering pattern withdifferent light intensities at various angles. The total angularintensity distribution, consisting of both direct and scatteredlight, is then focused onto a multi-element detector by alens or a series of lenses. These lenses create a scatteringpattern that, within limits, does not depend on the locationof the particles in the light beam. Hence, the continuousangular intensity distribution is converted into a discretespatial intensity distribution on a set of detector elements. lIit is assumed that the measured scattering pattern of theparticle ensemble is identical to the sum of the patternsfrom all individual single scattering particles presented inrandom relative positions. Note that only a limited angularrange of scattered light is collected by the lens(es) and,therefore, by the detector. DEVELOPMENT OF THE METHOD The measurement of particle size by laser diffraction cangive reproducible data, even in the submicron region, pro-vided the instrument used and the sample tested are care-fully controlled to limit variability of the test conditions(e.g., dispersion medium, method of preparation of thesample dispersion). Traditionally, the measurement of particle size using laserdiffraction has been limited to particles in the range of ap-proximately 0.1 um to 3 mm. Because of recent advances inlens and equipment design, newer instruments are routinelycapable of exceeding this range. With the validation report,the user demonstrates the applicability of the method for itsintended use. Sampling The sampling technique must be adequate to obtain arepresentative sample of a suitable volume for the particle- size measurement. Sample splitting techniques such as ro-tating riffler or the cone and quartering method may beapplied. Evaluation of the Dispersion Procedure The sample to be analyzed is inspected, visually or withthe aid of a microscope, to estimate its size range and parti-cle shape. The dispersion procedure must be adjusted to thepurpose of the measurement. The purpose may be suchthat it is preferable to deagglomerate clusters into primaryparticles as far as possible, or it may be desirable to retainclusters as intact as possible. In this sense, the particles ofinterest may be either primary particles or clusters. For the development of a method, it is highly advisable tocheck that comminution of the particles does not occurand, conversely, that dispersion of particles or clusters is sat-isfactory. This can usually be done by changing the dispers-ing energy and monitoring the change of the particle-sizedistribution. The measured size distribution must notchange significantly when the sample is well dispersed andthe particles are neither fragile nor soluble. Moreover, if themanufacturing process (e.g., crystallization, milling) of thematerial has changed, the applicability of the method mustbe verified (e.g., by microscopic comparison). Sprays, aerosols, and gas bubbles in a liquid should bemeasured directly, provided that their concentration is ade-quate, because sampling or dilution generally alters the par-ticle-size distribution. In other cases (such as emulsions, pastes, and powders),representative samples may be dispersed in suitable liquids.Dispersing aids (wetting agents, stabilizers) and/or mechani-cal forces (e.g., agitation, sonication) are often applied fordeagglomeration or deaggregation of clusters and stabiliza-tion of the dispersion. For these liquid dispersions, a recircu-lating system consisting of an optical measuring cell, a dis-persion bath usually equipped with stirrer and ultrasonicelements, a pump, and tubing is most commonly used.Nonrecirculating, stirred cells are useful when only smallsamo oulnotus uosf aa rsea muplsee dar.e available or when special disper- Dry powders can also be converted into aerosols throughthe use of suitable dry powder dispersers that apply me-chanical force for deagglomeration or deaggregation. Gen-erally, the dispersers use the energy of compressed gas orthe differential pressure of a vacuum to disperse the parti-cles to an aerosol that is blown through the measuringzone, usually into the inlet of a vacuum unit that collectsthe particles. However, for free-flowing, coarser particles orgranules, the effect of gravity may be sufficient to disperse the ene isaxndeau ganticle size of the sample e eexxceeds themeasuring range of the instrument, the material that is toocoarse can be removed by sieving, and the mass and per-centage of removed material are reported. However, after presieving, note that the sample is no longer representative,unless proven otherwise. Optimization of the Liquid Dispersion Liquids, surfactants, and dispersing aids used to dispersepowders must - be transparent at the laser wavelength and practicallyfree from air bubbles or particles; 一hhave a refractive index that differs from that of the testmaterial; - be a nonsolvent of the test material (pure liquid or prefiltered, saturated solution); - not alter the size of the test materials (e.g., by solubil-ity, solubility enhancement, or recrystallizationeffects); -ffavor easy formation and stability of the dispersion;be compatible with the materials used in the instru- ment (such as O-rings, gaskets, tubing,etc.); and - possess a suitable viscosity to facilitate recirculation,stirring, and filtration. Surfactants and/or dispersing aids are often used to wetthe particles and to stabilize the dispersion. For weak acidsand weak bases, buffering of the dispersing medium at lowor high pH, respectively, can assist in identifying a suitabledispersant. A preliminary check of the dispersion quality can be per-formed by visual or microscopic inspection. It is also possi-ble to take fractional samples out of a well-mixed stock dis-persion. Such stock dispersions are formed by adding aliquid to the sample while mixing it with, for example,aglass rod, a spatula or a vortex mixer. Care must be takento ensure the transfer of a representative sample and thatsettling of larger particles does not occur. Therefore, a sam-ple paste is prepared or sampling is carried out quickly froma suspension maintained under agitation. Optimization of the Gas Dispersion For sprays and dry powder dispersions, a compressed gasfree from oil, water, and particles may be used. To removesuch materials from the compressed gas, a dryer with a filtercan be used. Any vacuum unit should be located away fromthe measurement zone, so that its output does not disturbthe measurement. Determination of the Concentration Range In order to produce an acceptable signal-to-noise ratio inthe detector, the particle concentration in the dispersionmust exceed a minimum level. Likewise, it must be below amaximum level in order to avoid multiple scattering. Theconcentration range is influenced by the width of the laserbeam, the path length of the measurement zone, the opti-cal properties of the particles, and the sensitivity of the de-tector elements. ln view of the above, measurements must be performedat different particle concentrations to determine the appro-priate concentration range for any typical sample of mate-rial. [NOTE—In different instruments, particle concentrationsare usually represented by differently scaled and differentlynamed numbers, e.g., obscuration, optical concentration,proportional number of total mass.] Determination of the Measuring Time The time of measurement, the reading time of the detec-tor, and the acquisition frequency is determined experimen-tally in accordance with the required precision. Generally,the time for measurement permits a large number of detec-tor scans or sweeps at short time intervals. Selection of an Appropriate Optical Model Most instruments use either the Fraunhofer or the Mietheory, though other approximation theories are sometimesapplied for calculation of the scattering matrix. The choiceof the theoretical model depends on the intended applica-tion and the different assumptions (size, absorbance, refrac-tive index, roughness, crystal orientation, mixture, etc.)made for the test material. If the refractive index values (realand imaginary parts for the used wavelength) are not ex-actly known, then the Fraunhofer approximation or the Mietheory with a realistic estimate of the refractive index can beused. The former has the advantages that it is simple and itdoes not need refractive index values; the latter usually pro-vides less-biased particle-size distributions for small particles.For instance, if the Fraunhofer model is used for samplescontaining an appreciable amount of small, transparent par-ticles, a significantly larger amount of small particles may becalculated. In order to obtain traceable results, it is essentialto document the refractive index values used, because smalldifferences in the values assumed for the real and imaginarypart of the complex refractive index may cause significantdifferences in the resulting particle-size distributions. Smallvalues of the imaginary part of the refractive index (about0.01-0.1 i) are often applied to allow the correction of theabsorbance for the surface roughness of the particles.Itshould be noted, in general, that the optical properties ofthe substance to be tested, as well as the structure (e.g.,shape, surface roughness, and porosity) bear upon the finalresult. Validation Typically, the validity of a procedure may be assessed bythe evaluation of its specificity, linearity, range, accuracy,precision, and robustness. In particle-size analysis by laserlight diffraction, specificity as defined by ICH is not applica-ble as it is not possible to discriminate different componentsinto a sample, nor is it possible to discriminate betweenagglomerates from dispersed particles unless properly com-plemented by microscopic techniques. Exploring a linear re-lationship between concentration and response, or a mathe-matical model for interpolation, is not applicable to thisprocedure. Rather than evaluating linearity, this method re-quires the definition of a concentration range within whichthe result of the measurements does not vary significantly.Concentrations below that range produce an error due to apoor signal-to-noise ratio, while concentrations above thatrange produce an error due to multiple scattering. Therange depends mostly on the instrument hardware. Accu-racy should be confirmed through an appropriate instru-ment qualification and comparison with microscopy, whileprecision may be assessed by means of a repeatabilitydetermination. The attainable repeatability of the method mainly de-pends on the characteristics of the material (milled/notmilled, robust/fragile, width of its size distribution, etc.),whereas the required repeatability depends on the purposeof the measurement. Mandatory limits cannot be specifiedin this chapter, as repeatabilities (different sample prepara-tions) may vary appreciably from one substance to another.However, it is good practice to aim at acceptance criteriafor repeatability such as % RSD≤10% [n = 6] for any cen-tral value of the distribution (e.g., for x5o). Values at thesides of the distribution (e.g., x10 and x90) are oriented to-wards less stringent acceptance criteria such as % RSD≤15%[n = 6]. Below 10 um, these values must bedoubled. Robustness may be tested during the selection andoptimization of the dispersion media and forces. The changein the particle-size distribution. MEASUREMENT Precautions The instructions given in the instrument manual arefollowed: - never look into the direct path of the laser beam or itsreflections; - earth all instrument components to prevent ignition ofsolvents or dust explosions; —Ccheck the instrument set-up (e.g., warm-up, requiredmeasuring range and lens, appropriate working dis-tance, position of the detector, no direct brightdaylight); and -in the case of wet dispersions, avoid air bubbles, evap-oration of liquid, schlieren or other inhomogeneitiesin the dispersion; similarly, avoid improper mass-flowfrom the disperser or turbulent airflow in the case ofdry dispersions; such effects can cause erroneous par-ticle-size distributions. Measurement of the Light Scattering ofDispersed Sample(s) After proper alignment of the optical part of the instru-ment, a blank measurement of the particle-free dispersionmedium must be performed using the same method as thatused for the measurement of the sample. The backgroundsignal must be below an appropriate threshold. The detec-tor data are saved in order to subtract them later from thedata obtained with the sample. The sample dispersion ismeasured according to the developed method. For each detector element, an average signal is calculated,sometimes together with its standard deviation. The magni-tude of the signal from each detector element dependsupon the detection area, the light intensity, and the quan-tum efficiency. The coordinates (size and position) of thedetector elements together with the focal distance of thelens determine the range of scattering angles for each ele-ment. Most instruments also measure the intensity of thecentral (unscattered) laser beam. The ratio of the intensityof a dispersed sample to that in its absence (the blankmeasurement) indicates the proportion of scattered lightand hence the particle concentration. Conversion of Scattering Pattern Into Particle-Size Distribution This deconvolution step is the inverse of the calculation ofa scattering pattern for a given particle-size distribution. Theassumption of spherical particle shape is particularly impor-tant as most algorithms use the mathematical solution forscattering from spherical particles. Furthermore, the meas-ured data always contain some random and systematic er-rors, which may vitiate the size distributions. Several mathe-matical procedures have been developed for use in theavailable instruments. They contain some weighting of devi-ations between measured and calculated scattering patterns(e.g., least squares), some constraints (e.g., non-negativityfor amounts of particles), and/or some smoothing of thesize distribution curve. The algorithms used are specific to each make and modelof equipment, and are proprietary. The differences in thealgorithms between different instruments may give rise todifferences in the calculated particle-size distributions. Replicates The number of replicate measurements (with individualsample preparations) to be performed, depends on the re- quired measurement precision. It is recommended to setthis number in a substance-specific method. REPORTING RESULTS The particle-size distribution data are usually reported ascumulative undersize distribution and/or as density distribu-tion by volume. The symbol xis used to denote the particlesize, which in turn is defined as the diameter of a volume-equivalent sphere. Q3(x) denotes the volume fraction un-dersize at the particle size x. In a graphical representation, xis plotted on the abscissa and the dependent variable Q3 onthe ordinate. Most common characteristic values are calcu-lated from the particle-size distribution by interpolation. Theparticle sizes at the undersize values of 10%, 50%, and 90%(denoted as x10, Xso, and x9o, respectively) are frequentlyused. x5o is also known as the median particle size. It isrecognized that the symbol d is also widely used to desig-hynate the particle size, thus the symbol x may be replaced byd. Moreover, sufficient information must be documentedabout the sample, the sample preparation, the dispersionconditions, and the cell type. Because the results depend onthe particular instrument, data analysis program, and opticalmodel used, these details must also be documented. CONTROL OF THE INSTRUMENTPERFORMANCE Use the instrument according to the manufacturer’s in-structions and carry out the prescribed qualifications at anappropriate frequency, according to the use of the instru-ment and substances to be tested. Calibration Laser diffraction systems, although assuming idealizedproperties of the particles, are based on first principles oflaser light scattering. Thus, calibration in the strict sense isnot required. However, it is still necessary to confirm thatthe instrument is operating correctly. This can be under-taken using any certified reference material that is accept-able in industrial practice. The entire measurement proce-dure is examined, including sample collection, sampledispersion, sample transport through the measuring zone,measurement, and the deconvolution procedure. It is essen-tial that the total operational procedure is fully described. The preferred certified reference materials consist ofspherical particles of a known distribution.They must becertified as to the mass-percentage size distribution by anabsolute technique, if available, and used in conjunctionwith an agreed, detailed operation procedure. It is essentialthat the real and imaginary parts of the complex refractiveindex of the material are indicated if the Mie theory is ap-plied in data analysis. The representation of the particle-sizedistribution by volume will equal that of the distribution bymass, provided that the density of the particles is the samefor all size fractions. The response of a laser diffraction instrument meets therequirements if the mean value of x5o from at least threeindependent measurements does not deviate by more than3% from the certified range of values of the certified refer-ence material. The mean values for x10 and x90 must notdeviate by more than 5% from the certified range of values.Below 10 um, these values must be doubled. Although the use of materials consisting of spherical parti-cles is preferable, nonspherical particles may also be em-ployed. Preferably, these particles have certified or typicalvalues from laser diffraction analysis performed according toan agreed, detailed operating procedure. The use of refer-ence values from methods other than laser diffraction maycause a significant bias. The reason for this bias is that the different principles inherent in the various methods maylead to different sphere-equivalent diameters for the samenonspherical particle. Although the use of certified reference materials is pre-ferred, other well-defined reference materials may also beemployed. They consist of substances of typical compositionand particle-size distribution for a specified class of sub-stances. Their particle-size distribution has proven to be sta-ble over time.The results must comply with previously de-termined data, with the same precision and bias as for thecertified reference material. Qualification of the System In addition to the calibration, the performance of theinstrument must be qualified at regular time intervals or asfrequently as appropriate. This can be undertaken using anysuitable reference material as mentioned in the previousparagraph. The qualification of the system is based on the conceptthat the equipment, electronics, software, and analytical op-erations constitute an integral system, which can be evalu-ated as an entity. Thus the entire measurement procedure isexamined, including sample collection, sample dispersion,sample transport through the measuring zone, and themeasurement and deconvolution procedure. It is essentialthat the total operational procedure is fully described. In general, unless otherwise specified in the individualmonograph, the response of a laser diffraction instrument isconsidered to meet the requirements if the x5o value doesnot deviate by more than 10% from the range of values ofthe reference material. If optionally the values at the sides ofthe distribution are evaluated (e.g.,X10 and x90),// then thesevalues must not deviate by more than 15% from the certi-fied range of values. Below 10 um, these values must bedoubled. NoTE—For calibration of the instrument, stricter require-ments are laid down in the paragraph on Calibration. Apparatus-The apparatus for methoxy determination isshown diagrammatically in the accompanying figure. Theboiling flask, A, is fitted with a capillary side-arm for theintroduction of carbon dioxide or nitrogen and is connectedto a column, B, which serves to separate aqueous hydriodicacid from the more volatile methyl iodide. The methyl io-dide passes through water in a scrubber trap, C, and is fi-nally absorbed in the bromine-acetic acid solution in ab-sorption tube D. The carbon dioxide or nitrogen is intro-duced through a pressure-requlating device and connected to the apparatus by a small capillary containing a small cot-ton pledget.[NOTE—Avoid the use of organic solvents incleaning this apparatus, since traces remaining may interferewith the determination. This test is used also for ethoxy de-termination with an 80-minute reaction time and a titrantequivalent of 0.751 mg of (OC2Hs).] For greater convenience in use and cleaning,a ground-glass ball joint connects the two upright columns of theapparatus. The top of the scrubber C consists of a 35/20ball joint, the upper half of which is connected to the side-arm leading into tube D. This permits taking the apparatusapart and facilitates adding the water to the trap. Also, itallows access to the loose inverted (10-mm) test tube thatserves as the trap over the inner tube of the scrubber C. Reagents- BROMINE-ACETIC ACID SOLUTION-Dissolve 100 g of potassiumacetate in 1000 mL of a solution consisting of 900 mL ofglacial acetic acid and 100 mL of acetic anhydride. On theday of use, to 145 mL of this solution add 5 mL of bromine. HYDRIODIC ACID-A colorless, or nearly colorless, constant-boiling reagent solution, prepared for this purpose, is availa-ble commercially. If not obtained commercially, it may beprepared by distilling hydriodic acid over red phosphorus,passing carbon dioxide or nitrogen through the apparatusduring the distillation. Use the constant-boiling mixture (be-tween 55% and 58% of HI) distilling between 126°and127°which is colorless or nearly colorless. [Caution-Exer-cise safety precautions when distilling Hydriodic Acid.] Placethe acid in small, amber, glass-stoppered bottles previouslyflushed with carbon dioxide, or nitrogen, seal with paraffin,and store in a cool, dark place. Procedure-Prepare the apparatus by disconnecting theball joint and pouring water into trap C until it is half-full.Connect the two parts, using a minimal amount of a suita-ble silicone grease to seal the ball joint. Add 7 mL of Bro-mine-Acetic Acid Solution to absorption tube D. Weigh thesample in a tared gelatin capsule, and add it to the boilingflask along with a few boiling chips or pieces of porousplate. Finally add 6 mL of Hydriodic Acid and attach the flaskto the column, using a minimal amount ofa suitable sili-cone grease to seal the junction. Bubble the carbon dioxideor nitrogen through the apparatus at the rate of 2 bubblesper second, place the boiling flask in an oil bath or heatingmantle heated to 150°, and continue the reaction for40 minutes for methoxy determination, or 80 minutes forethoxy determination. Drain the contents of the absorptiontube into a 500-mL conical flask containing 10 mL of so-dium acetate solution (1 in 4). Rinse the tube with water,adding the rinsings to the flask, and finally dilute with waterto about 125 mL. Add formic acid, dropwise, with swirling,until the reddish brown color of the bromine is discharged,then add 3 additional drops. A total of 12 to 15 drops usu-ally is required. Allow to stand for 3 minutes, and add15 mL of diluted sulfuric acid and 3 g of potassium iodide,and titrate immediately with 0.1 N sodium thiosulfate VS,using 3 mL of starch TS as the indicator. Perform a blankdetermination, including also a gelatin capsule, and makeany necessary correction. Each mL of 0.1 N sodium thiosul-fate is equivalent to 0.517 mg of (OCH3). 检测结果总是变化?批间对比总是很差?明明一样的操作到底是为啥?本篇将给大家简单罗列在检测过程中影响结果的因素,全文548字,预计阅读时间2分钟。粒度检测结果的误差来源:在不同的样品测试过程中,这三方面带来的影响是不同的:1对于小于10微米的颗粒:分散对测试结果的影响是最大的!粒度越小,颗粒需要的分散能量就越大越重要,如何进行有效的分散对粒度检测结果来讲是最重要的!解决思路:选择适合的分散方式及能量。在方法开发过程中,需要将重点放在分散方法的开发上。2对于大于10微米的颗粒:代表性取样更加重要!粒度越大,代表性的取样量越大。同样,对于具有宽粒度分布的样品,代表性取样更加具有挑战。解决思路:选择合适的采样方式及样本量。在方法开发过程中,需要将重点放在取样环节的开发上。3对于所有颗粒:检测显然是很重要的一步环节!基于分析仪器的物理原理,数据获取和处理模式对检测结果的误差来说相对比较缓和。对于仪器商而言,提高仪器的稳定性和检测精度,是对用户的基本保障。德国新帕泰克,也从仪器的基本部件到光路设计等各方面提升仪器的精度与稳定性,以保证可靠的检测结果。总结,一份有意义的结果是需要仪器厂商和用户共同参与的。全文发表于“德国新帕泰克有限公司苏州代表处”公众号,未经许可,禁止转载!
关闭-
1/5
-
2/5
还剩3页未读,是否继续阅读?
继续免费阅读全文产品配置单
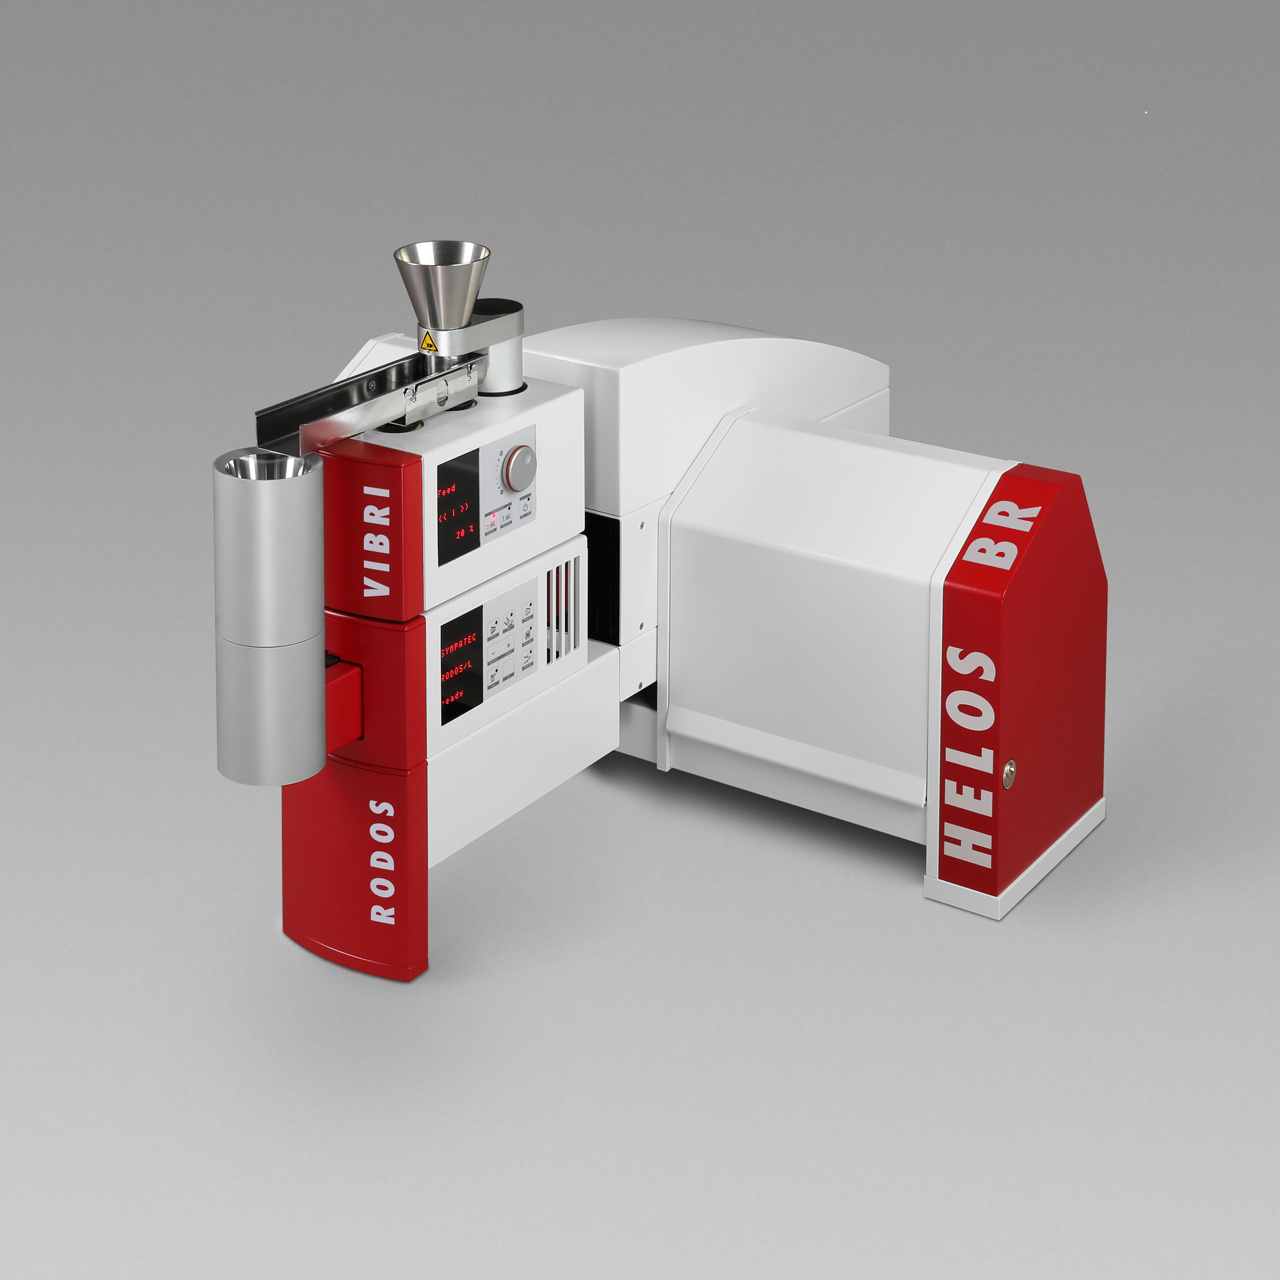
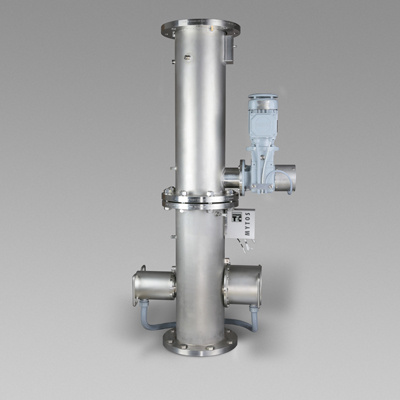
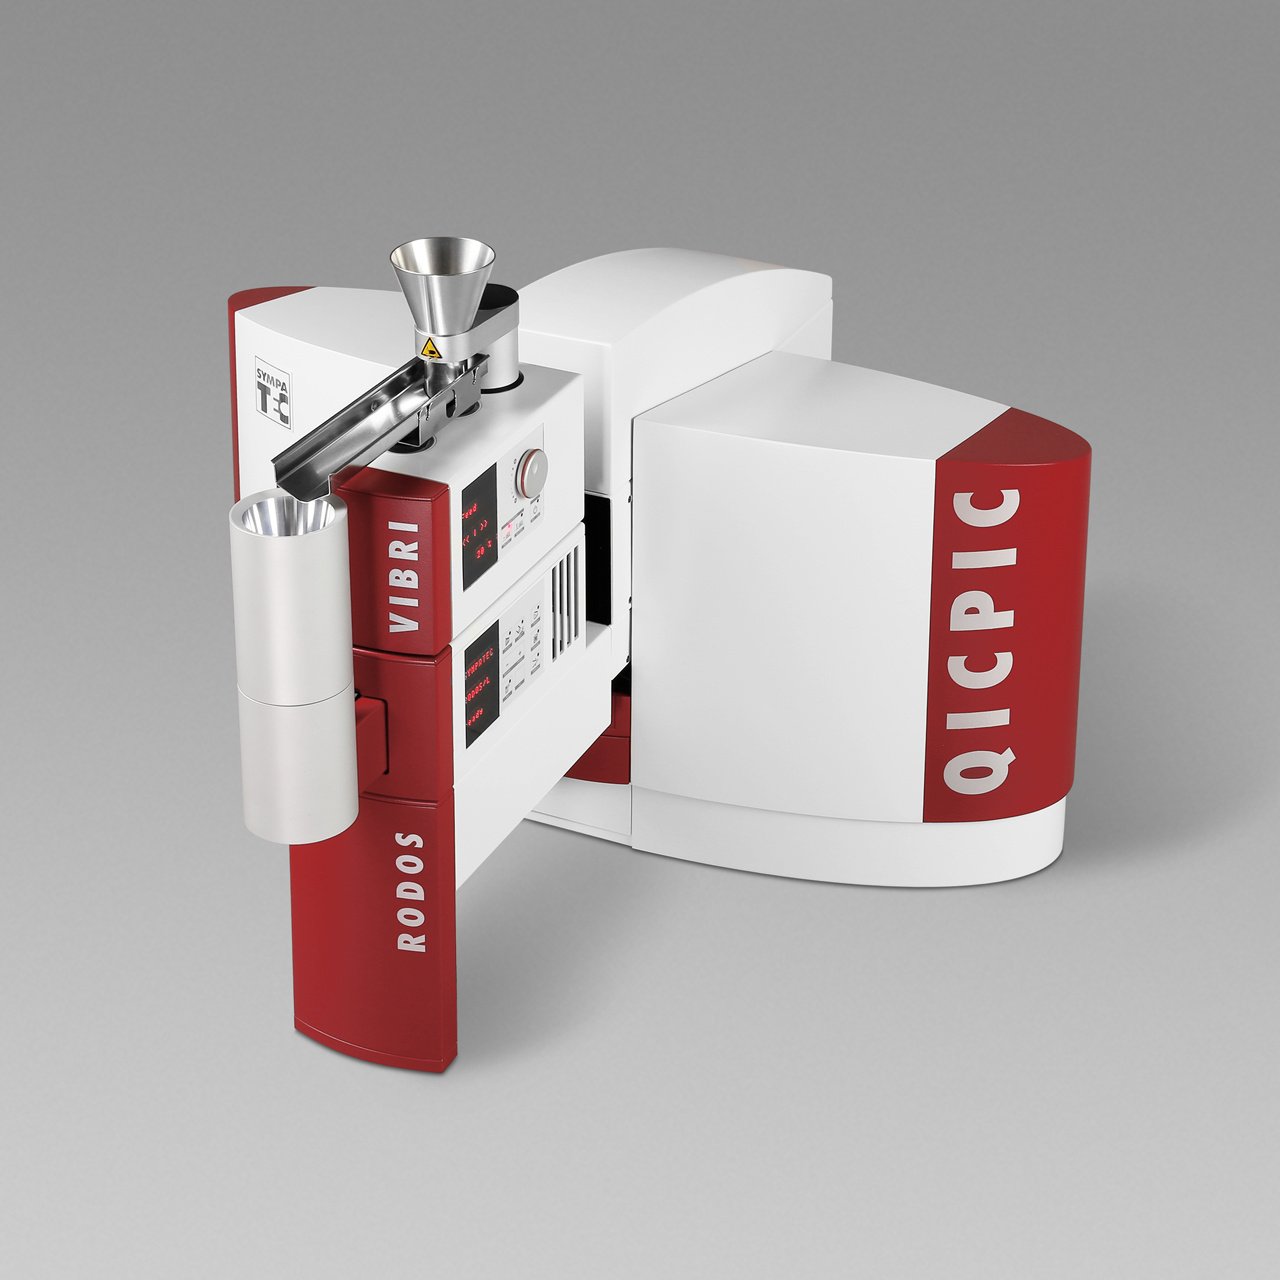
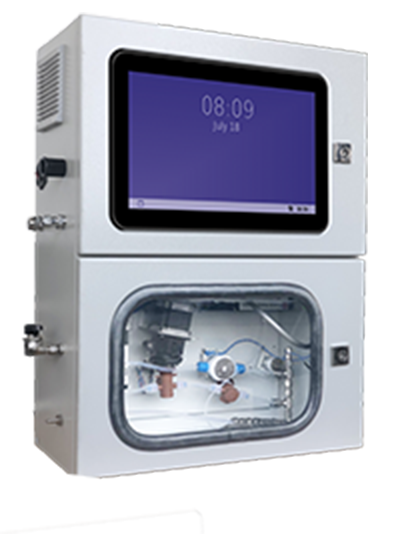
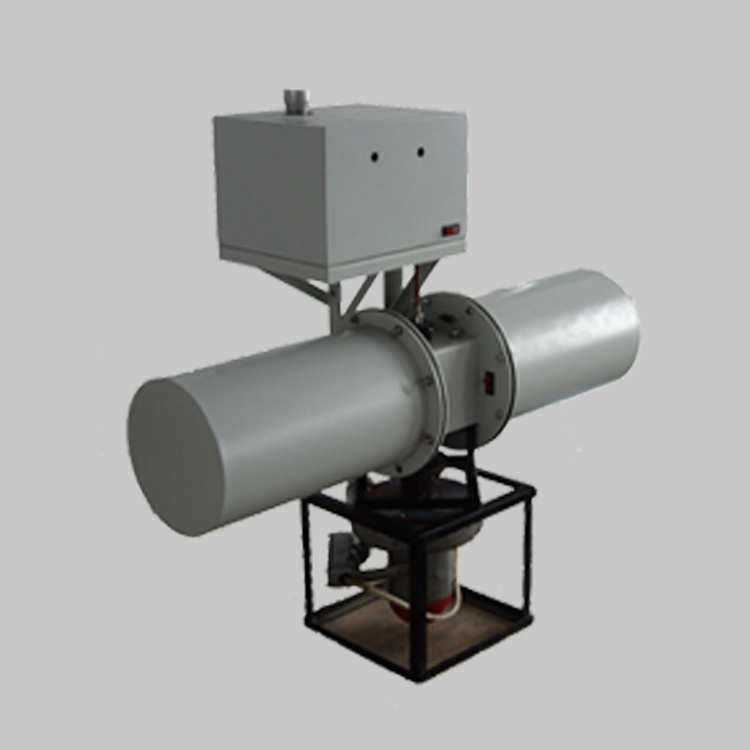
德国新帕泰克有限公司苏州代表处为您提供《材料中粒度检测方案(激光粒度仪)》,该方案主要用于原料药中限度检查检测,参考标准《暂无》,《材料中粒度检测方案(激光粒度仪)》用到的仪器有气流干法激光粒度仪HELOS&RODOS/L、德国工业在线干法激光粒度分析和过程控制系统、新帕泰克干法动态图像分析仪QICPIC&RODOS。
我要纠错
推荐专场


相关方案
 咨询
咨询