方案详情文
智能文字提取功能测试中
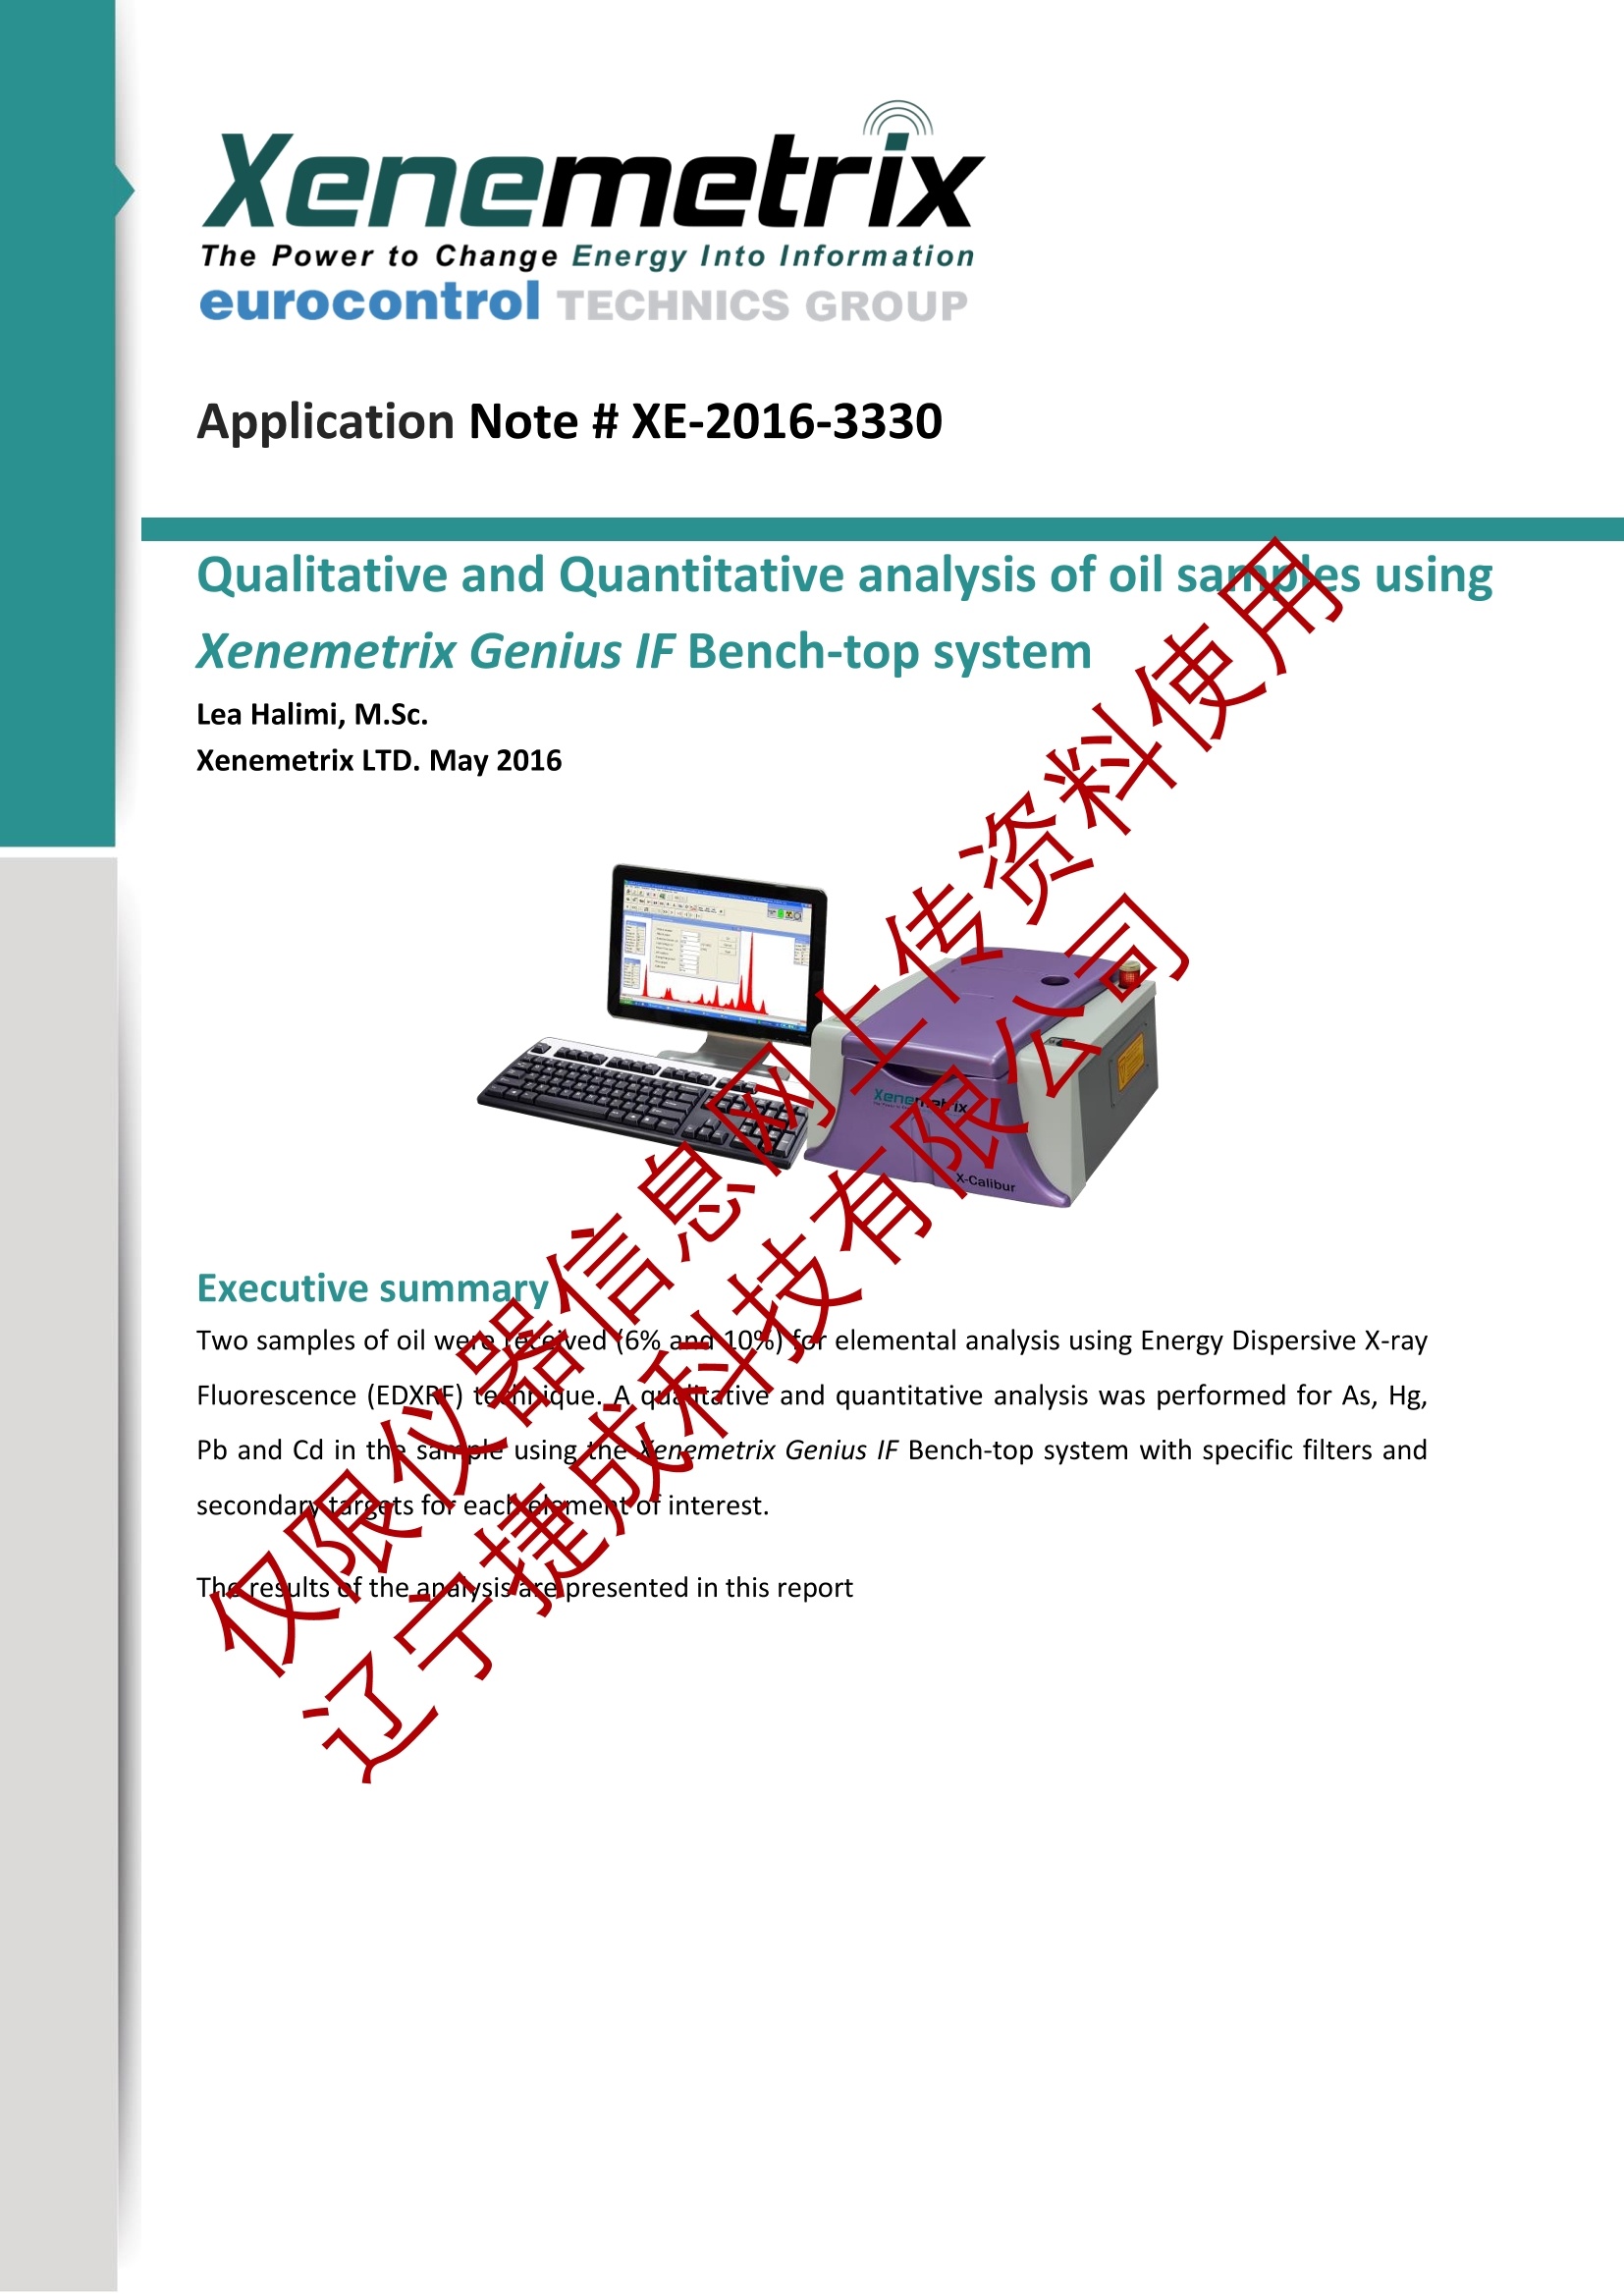
The Power to Change Energy Into Information eurocontrol TECHNICS GROUP Xenemetrix eurocontrolTECHNICS GROUP Application Note #XE-2016-3330 Qualitative and Quantitative analysis of oil sares usingXenemetrix Genius IF Bench-top system Lea Halimi, M.Sc. Xenemetrix LTD. May 2016 Executive summary Xene公限ur有技 Two samples of oil wererereived 6% ang10%) for elemental analysis using Energy Dispersive X-rayFluorescence (EDXF)teoh native: and quantitative analysis was performed for As, Hg,Pb and Cd in thlsar using thenemetrix Genius IF Bench-top system with specific filters andsecondar targets fove omert df interest. There.ults of the anaysis are presented in this report The Power to Change Energy Into Information eurocontrol TECHNICS GROUP 1. Introduction Xenemetrix's Genius IF EDXRF spectrometer provides a non-destructive qualitative andquantitative determination from carbon (6) to fermium (100), providing detectiom.mitsfrom sub-ppm to high weight percent concentrations. The Genius IF has powertucomponents including: A fully integrated computer system, a high resoluta silicon DriftDetector and a powerful X-Ray tube with variable spot sizes, desioned baccommodatesamples of various sizes. 欣i The Genius IF has a unique patented geometry combining eiolsecondary targets, witheight customizable tube filters used in direct excitathnuode, to allowootimal excitation ofall elements that can be detected in EDXRF. ThWAG(Vide Angle Geometry) patentedsecondary target technique provides the best resul. for major, mor and trace elementanalysis. The X-ray tube excites the charejisuc K linsodsecondary target (a puremetal) which are used to excite thcaple mnonochromatically". By using secondarytargets, the detection limits fyr-certal elementstan be lowered even further. These lowerdetection limits make the Ginit slf suitayafarger range of applications that hadpreviously not beena.ole to convenriopalEEDXRF instruments, and turn this instrumentinto the most ve.s. tile/elementorana izer available. 2. Objecv Qualitawveand Imalysis of As, Hg, Pb and Cd in oil 6% and 10% on Genius IF ED-XRFanlys r usingsecondary target excitations or direct excitation with x-ray tube filters. The Power to Change Energy Into Information eurocontrol TECHNICS GROUP 3. Experimental 3.1. Equipment and Measurement Parameters All measurements were conducted on a Genius IF system equipped with Silico. t weetector(SDD), in air atmosphere for all of the elements. Additional parameters are s e 1. Instrument Configuration Genius IF, Rh Anode x-ray tube,50NV50M Detector Silicon Drift Detector Atmosphere Air Excitation mode Mo secondary target, Sn secondary targe filter, W filter and ne filter Zrsecondary target, Rh Acquisition time 300,1200 sec Analysis method Regressioncunte meters 器仪限仅 有技科成 The Power to Change Energy Into Information eurocontrol TECHNICS GROUP 4. Results 4.1 Calibration Data Calibration DATA are presented above for the calculation of As and Pb concentratio.ni.iilsmples.No cd or Hg peaks were detected using optimal acquisition parameters. The detection of As and Pb separately is difficult since ka of As (10.543Kev) and a of Pb (10.549Kev) are very close to each other. Therefore, the observed peak couldldicate the presenceof: 1.As 2. Pb 3. A mixture of As and Pb. From figure 1 it can be seen that the spectrum of oil 5% co tains both Loand L Peaks of Pb andonly Ka peak of As. Therefore, it is probable that the peak at-4054hvrefers e息信有器技科仪成限仅捷宁 both calibration curves (As and Pb)we ccalclated and tre concentration of either Pb or As wascalculated according to each one. Figure 1 spectrum of pure Oil 6% with Zr target (a) and Mo target (b) Xenemetrix The Power to Change Energy Into Information eurocontrol TECHNICS GROUP Calibration method: The Genius if was calibrated using four standards of 10 ppm As/Pb in oil and pure oil 6% as blank (0PPM)sample. The standards were all diluted with pure oil 6% of unknown concentration=6 The As/Pb concentration in oil samples (8) was calculated from the x-intercept of ealbrationCurve. gen yations of As/Pb standards [ppm] opThe results o (6)fer is and DBesbwn in page 13 and page 14. 捷宁 Xenemetrix The Power to Change Energy Into Information eurocontrol TECHNICS GROUP Arsenic (As) calibration curve 30.0 Figure 2 calibration curve of As The interception with the X curve represent the intensity of the pure oil that was defined as zeroAs/Pb concentration. Subtracting this value from the intensities of the 4 other standard will give acorrected calibration curve. The intensity value of the pure oil was placed in the calibration curveand 8 was found. XenemetrixThe Power to Change Energy Into Informationeurocontrol TECHNICS GROUP lv Figure 3 calibration curve of As before and after correction The Power to Change Energy Into Informationeurocontrol TECHNICS GROUP Figure 4 spec飞e ure oil 5% (blue), 0.5ppm (green),1ppm brown), ck), 5ppm (red). Givecon (P2 Cal Vated Conc. Abs. Deviation Rel. Deviation (%) 0.00 0.00 0.00 0.50 0.52 -0.02 -0.03 1.00 0.97 0.03 0.03 2.00 2.02 -0.02 -0.01 5.00 5.00 0.00 0.00 Table 3: Given concentration vs calculated concentration of As standards The Power to Change Energy Into Information eurocontrol TECHNICS GROUP Lead (Pb) calibration curve 器仪限仅 iona技科成 XenemetrixThe Power to Change Energy Into Informationeurocontrol TECHNICS GROUP Figure 6 calibration curve of Pb before and after correction The Power to Change Energy Into Information eurocontrol TECHNICS GROUP Intensity Figure 7 spectrum o0ffK ards:pury %(biue), 0.5ppm (green), 1ppm brow..2pnn ( 55ppm (red). Given Conc.ppm1 Abs. Deviation Rel. Deviation(%) -0.16 0.00 -0.14 -0.28 0.92 0.08 0.08 1.68 0.32 0.16 5 5.10 -0.10 -0.02 able 4: Given concentration vs calculated concentration of Pb standards Xenemetrix The Power to Change Energy Into Information eurocontrol TECHNICS GROUP 4.2 calculation results Quantitative analysis according to As calibration curve To test the repeatability of the methods each sample was analysed 10 times consecutively withoutmoving the sample in between. The resulted intensities were placed in the corrected calibrationcurve. The calculated average concentration, the standard deviation and relative stanordleviation[RSD] in % are all shown in Table 2 and 3 用 使 Table 5: As Concentration results [ppm] of the pre Measurement# Unknown oil 6% nknown 1 0.26 2 3 4 0.18 5 0.25 0.22 0.18 0.31 0.17 0.26 0.15 0.25 0.21 0.23 0.19 0.05 0.03 PSD[%] 21.53 15.87 Xenemetrix The Power to Change Energy Into Information Quantitative analysis according to Pb calibration curve Table 6: As Concentration results [ppm] of the precision test Measurement# Unknown Oil 6% Unknown Dil 10% 1 0.57 0.47 2 0.69 0.47 3 0.55 4 0.62 5 0.59 6 7 8 9 10 0.46 AVG 0.50 STDV 0.06 12.30 Concentrations [ppm] of the unknown samples oil 6% oil 10% <0.1* <0.1* Hg <0.07* <0.07* As ≤0.23±0.05 ≤0.19±0.03 Pb ≤0.6±0.05 ≤0.5±0.06 *less than minimum detection limit As explained, it is difficult to assign the peak at≈10.54 to AS or Pb exclusively. Therefore, bothcalibration curves were calculated and the resulted concentration indicates the maximum value ofAs/Pb [ppm] present in the samples. Nonetheless, since Lβ peak of Pb was observed in thespectrum (fig 7) it is fair to assume that the peak refers to Pb. The Power to Change Energy Into Information 5. Conclusions 5.1. Two of the elements of interest were not detected in the sample (Hg, Cd) 5.2. A peak of either As or Pb was detected (see fig 1). A calibration curve for each element wascalculated. 5.3. The calibration curve was built using four standards of 10 ppm As/Pb in oiooitee in pureoil 6% of unknown concentration (8). Pure oil 6% of 8 concentration was esea as blanksample and 6 was calculated from the x-intercept of the calibrationc 5.4.。The XRF measurement results were obtained using a simpi and fa t measurementprocedure. 5.5. Good precision results were obtained when repeating the nalys10 times 6.Summary ED-XRF is a fast and non-destructive technique thatran quantify lyre of sample: solid,powder or liquid, within a few minutes. ED-XRF spectrometers can play an important role inassuring that consistent quality of samplessetaiped thro ghout e manufacturing process. ED-XRF is an ideal method for elemental ralysis offendgenrollowing advantage √Minimal sample preparation √Fast and automated analy.is process有 √Limited or no exposur to orfosiveageoused by other analytical techniques √ Ease of use ferere on by non tetnic.Ior non-specialized personnel. Raiet GabrielIndystnlZone, 6 Hatikshoret St., Migdal Haemek 2310901,Israel Email: info@xnemetrix.com Web: wwweneetrix.com Tel: +972-4-9891313 Fax: +972-4-9891323 www.linkedin.com/company/xenemetrix-ltd. www.facebook.com/Xenemetrix www.youtube.com/user/Xenemetrix Application Note # XE- 通过使用Xenemetrix公司的Genius IF能量色散X射线荧光光谱仪对优品种的重金属元素进行定性及定量分析,针对其结果以证明Genius IF能量色散X射线荧光光谱仪能够满足油品相关的检测要求,为用户在石油等油品检测领域提供足够的帮助及技术支撑。
关闭-
1/14

-
2/14

还剩12页未读,是否继续阅读?
继续免费阅读全文产品配置单
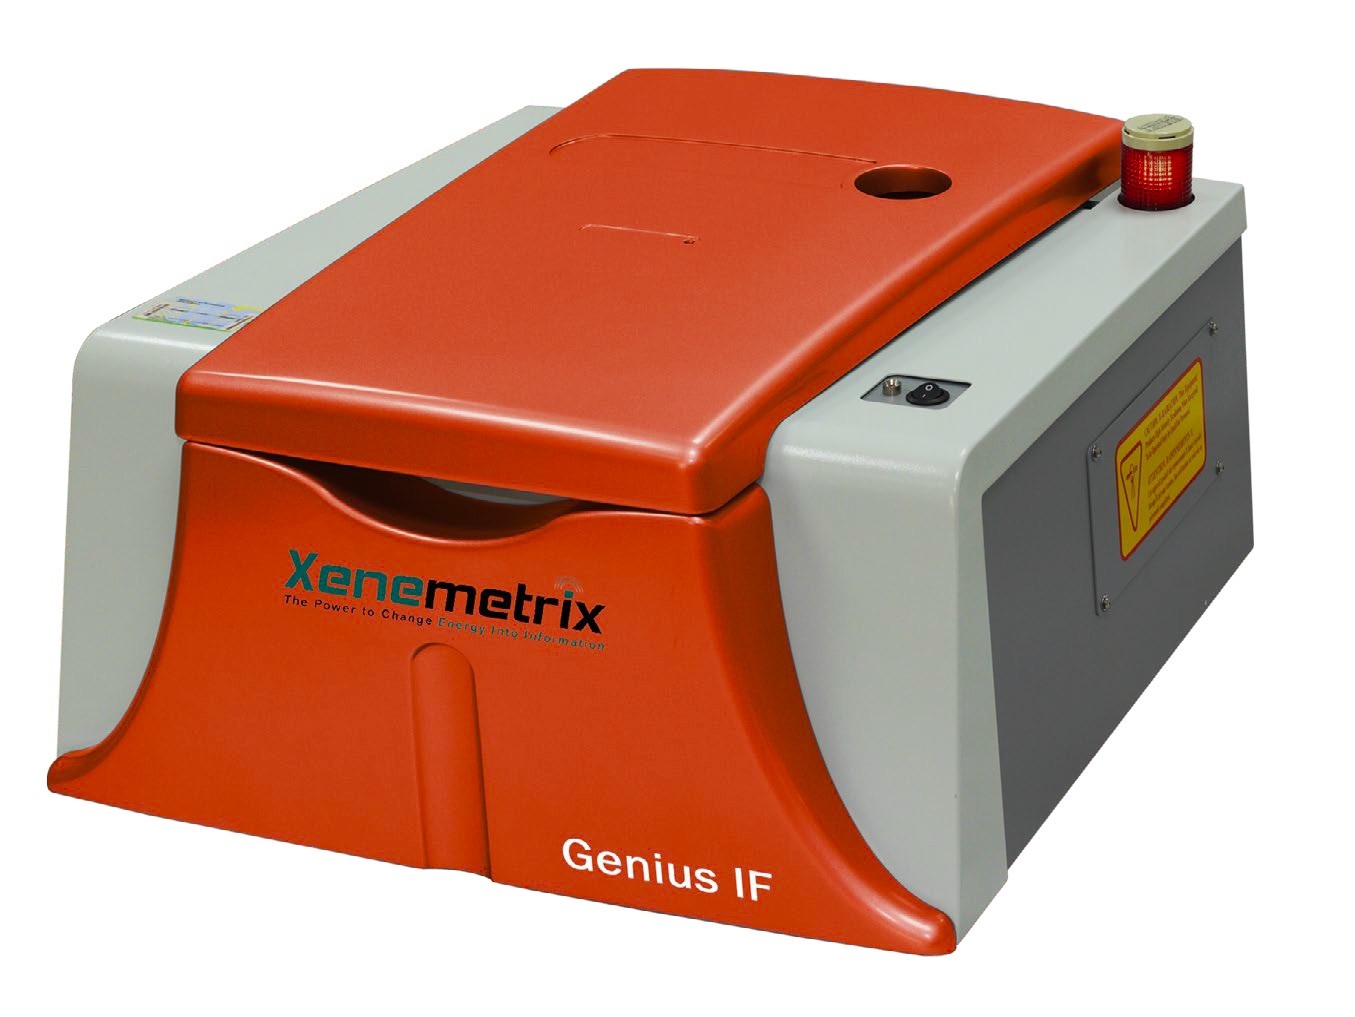
辽宁捷成科技有限公司为您提供《油品中重金属元素检测方案(能散型XRF)》,该方案主要用于原油中重金属检测,参考标准《暂无》,《油品中重金属元素检测方案(能散型XRF)》用到的仪器有Xenemetrix 能量色散X射线荧光光谱仪 Genius IF。
我要纠错
推荐专场
X荧光光谱、XRF(能量色散型X荧光光谱仪)
更多相关方案


 咨询
咨询
