方案详情文
智能文字提取功能测试中
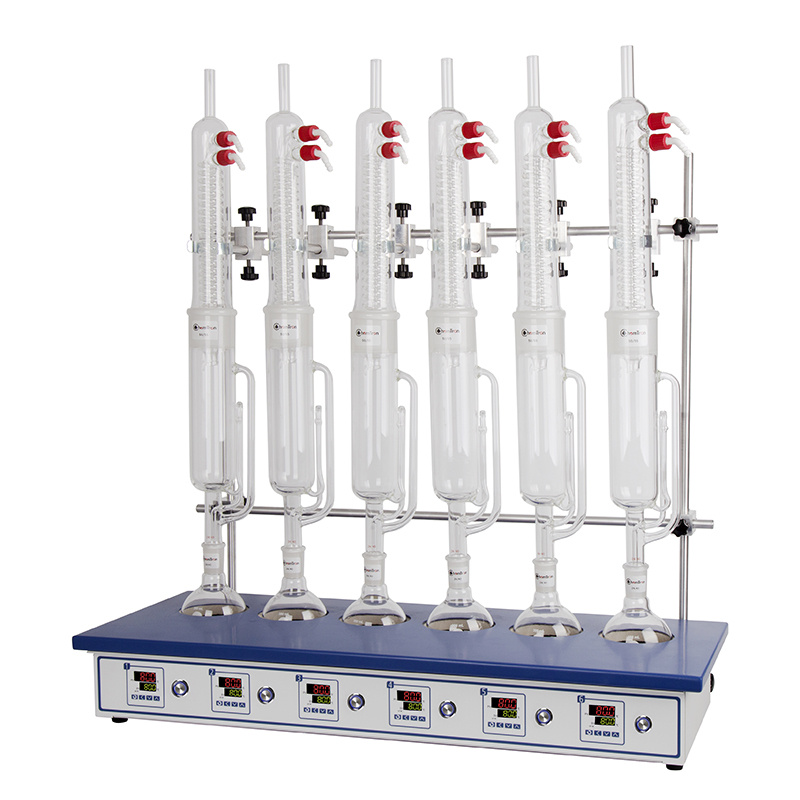
Accepted: 7 December 2019Revised: 15 November 2019Received: 30 August 2019DOI: 10.1111/are.14467WILEYAquaculture ResearchORIGINALARTICLE STAESSEN ET AL.1171WILEY-Aquaculture Research C 2019 The Authors. Aquaculture Research published by John Wiley & Sons Ltd1170Aquaculture Research. 2020;51:1170-1181.wileyonlinelibrary.com/journal/are The effect of dietary protein source (fishmeal vs. plant protein)and non-starch polysaccharide level on fat digestibility andfaecal bile acid loss in rainbow trout (Oncorhynchus mykiss) Thomas W.O. StaesseniD Marc C. J.Verdegem|IParaskevi KoletsiJohan W. SchramaD Aquaculture and Fisheries Group,Wageningen Institute of Animal Science(WIAS), Wageningen University,Wageningen, The Netherlands Correspondence Johan W. Schrama, Aquaculture and Fisheries Group, Wageningen Instituteof Animal Science (WIAS), Wageningen University, PO Box 338, 6700 AH Wageningen, The Netherlands. Email: johan.schrama@wur.nl Funding information Nederlandse Organisatie voor Wetenschappelijk Onderzoek,Grant/Award Abstract This study investigated in rainbow trout (Oncorhynchus mykiss) if diet compositionand feeding level affect faecal bile acid loss, and whether this reflects on the ap-parent digestibility coefficient (ADC) of fat. Six diets were formulated with eitherfishmeal or plant protein as main protein source. This created a contrast in the supplyof bile acids, the bile acid precursor cholesterol, taurine and the taurine precursors(methionine + cysteine) involved in bile acid conjugation. For both protein sources,three diets were formulated with increasing inclusion of a non-starch polysaccharide(NSP)-rich ingredient mixture (0.0,82.0 and 164.2 g/kg diet). This aimed at enhancingfaecal bile acid loss. Fish were fed both restrictively (1.2% BW/day) and to satiation.A similar fat ADC was found when substituting fishmeal with a plant protein mixture,suggesting that the lower content of bile acids, cholesterol, taurine,methionine andcysteine in the plant-based diets did not limit fat digestion. Faecal bile acid loss in-creased alongside dietary NSP level,however, only during satiation feeding and moststrongly for fish fed the fishmeal-based diets. Enhanced faecal bile acid loss was notcaused by NSP-bile acid binding/entrapment, but by an increase in faeces produc-tion. During satiation feeding, fat ADC negatively correlated with faecal bile acid loss.From this it is concluded that bile acid availability/synthesis can become limiting forfat digestion in rainbow trout under conditions that enhance faecal bile acid loss (i.e.dietary NSP level and feeding level). KEYWORDS bile acids, cholesterol, fat digestibility, non-starch polysaccharides, Oncorhynchus mykiss,taurine With the shift from fishmeal-based (FM) to plant-based (PB) diets inthe last decades, protein sources used in aquafeeds have diversified.However, possibilities for inclusion of these ingredients are not with-out limits. Several studies report a decrease in the apparent digest-ibility coefficient (ADC) of fat in fish fed PB diets (Gu, Kortner, Penn,Hansen, & Krogdahl, 2014; Kumar, Makkar, & Becker, 2011; Sinha,Kumar, Makkar, De Boeck, & Becker, 2011). One possible explanationfor the reduction in fat ADC of fish fed PB diets is an altered bile acidmetabolism. Bile acids are synthesized in the liver from cholesterol, and con-jugated with taurine/glycine (Russell, 2009). In fish, most bile acidsare conjugated with taurine (Hagey, Moller, Hofmann, & Krasowski,2010). Bile acids are secreted in the proximal part of the intestine,where they emulsify fat and facilitate fat hydrolysis and absorp-tion (Maldonado-Valderrama, Wilde, Macierzanka,& Mackie, 2011;Tocher, 2003). In the distal intestine, the majority of bile acids is re-absorbed (e.g.±95% in humans) and transported via the portal veinto the liver for reuse (Cai, Xiong, Wray, Ballatori, & Boyer,2007). Thisprocess is known as enterohepatic circulation of bile acids. Underhomeostatic conditions, the total bile acid pool is maintained rela-tively constant by compensating faecal bile acid loss with de novosynthesis (Lanzini & Lanzarotto,2000). Information for fish is limited, but in humans (Walters et al., 1975),rats (Ide, Horii, Kawashima, & Yamamoto, 1989; Ikegami et al., 1990;Overton et al., 1994) and poultry (Choct, 1999; Matin, Shariatmadari,Torshizi, & Chiba, 2016), non-starch polysaccharides (NSP) present inplant ingredients can sequester bile acids, thus enhancing faecal bileacid loss. Bile acid losses are to our knowledge not yet quantified infish, but have been suggested to be the cause of hampered fat ADC(e.g. Leenhouwers, ter Veld, Verreth, & Schrama,2007;Pasquier et al.,1996; Romarheim et al., 2008; Sinha et al., 2011). Next to enhancedfaecal bile acid loss, de novo bile acid synthesis might be limiting in fishfed PB diets. PB diets do not contain bile acids, neither the bile acidprecursor cholesterol nor the taurine needed for bile acid conjugationin fish. Bile acid synthesis in fish fed PB diets might thus be too low tocompensate for NSP-induced faecal bile acid loss. This study investigated in rainbow trout (Oncorhynchus mykiss)whether fat ADC and faecal bile acid loss are related and are negativelyaffected by dietary NSP level. The effect of NSP level was tested intwo diets that differed in main protein source: fishmeal-based (FM) vs.plant-based (PB) diets. This resulted in a contrast in supply of bile acids,the bile acid precursor (cholesterol), taurine and taurine precursors(methionine +cysteine). Both restricted feeding and satiation feedingwere applied to test if diet effects were dependent on feeding level. 2 MATERIALS ANDMETHODS The Animal Welfare Body of Wageningen University approved thisexperiment and evaluated it as not being an animal experiment ac-cording to Dutch legislation (Act on Animal Experiments). All experimental diets were formulated to meet known nutrient re-quirements of rainbow trout (Oncorhynchus mykiss) according to theNational Research Council (NRC, 2011). Ingredient composition andanalysed nutrient content are provided in Table 1. Six diets were for-mulated according to atwo-by-three factorial design. Two groups of diets were formulated differing in main protein source, plant-based (PB) diets vs. fishmeal-based (FM) diets.Replacement of fishmeal by a plant protein mixture aimed to createa contrast in the dietary supply of bile acids, the bile acid precursorcholesterol, taurine and the taurine precursors (methionine + cys-teine). Bile acids and taurine were provided by fishmeal, while ab-sent in the plant protein mixture. The plant protein mixture wassupplemented with methionine, lysine and threonine to avoid de-ficiencies of essential amino acids. A small amount of salmon oilwas added to the plant protein mixture to compensate for the fishoil present in fishmeal, and to meet n-3 LC-PUFA's requirementsin the PB diets. This inevitably introduced some cholesterol in theplant protein mixture. For each protein source, three diets wereformulated in which an increasing part of wheat feed flour was re-placed with an NSP-rich ingredient mixture (0% NSP, 8% NSP and16% NSP). This NSP-rich ingredient mixture was added to enhancefaecal bile acid loss. The main fat source was equal for all diets, anda vegetable oil mixture was chosen to avoid additional introduc-tion of cholesterol into the diets. A vitamin/mineral premix, chalkand monocalcium phosphate were added to meet nutrient require-ments for vitamins and minerals. Yttrium oxide was included asinert digestibility marker and for determination of faecal bile acidloss. Extruded pellets were vacuum coated with the vegetable oilmixture (3 mm; produced by Research and Diet Services B.V., TheNetherlands). Feed was stored at 4°C throughout the experiment. 2.22|1Design and management The experiment was carried out in the aquatic metabolic unit ofWageningen University in the Netherlands. The metabolic unit com-prised 12 glass tanks (90×60×45 cm; 200 L) connected to a commonwater recirculation system. Water flow into each tank was controlledby a water flow meter (MAGFLOQ MAG 5000, Danfoss A/S) and waskept constant at 7.0±0.05 L/min. A trickling filter, sump and drumfilter (Hydrotech 500Q, Hydrotech Engineering) helped in maintainingwater quality parameters within a set range. Maximum allowed valuesfor NH +,NO,-concentrations, and conductivity of the outlet waterwere <4 mg/L,< 1.5 mg/L and <4,000 uS/cm respectively. A par-tial water change was done when these parameters surpassed theirallowed maximum. The pH of the inlet water was kept within the rangeof 7.0-7.8. Water temperature was maintained at 14.0±0.5°C. Theconcentration of dissolved oxygen in the outlet was maintained at alevel > 4.5 mg/L. Each tank was drained separately, and each outlet,located at the lower point of the sloping tank bottom, was connectedto a swirl separator (44 cm in height, 24.5 cm in diameter; Aqua Optima TABLE 11Ingredient composition and analysed nutrient content of the experimental diets (Continues) 2.3| EExperimental procedures and sampling Each diet was tested in duplicate and assigned randomly to thetanks. Rainbow trout (Oncorhynchus mykiss) were obtained from a commercial fish farm (Mohnen Aquaculture GmbH). Upon ar-rival, fish were randomly stocked at a density of 30 fish/tank.The fish underwent four weeks of restricted feeding, followed bythree weeks of satiation feeding. During restricted feeding, fishwere fed 1.2% BW/day, except the first week when the feed ra-tion was stepwise increased from 20% to 100% of the intendedfeeding level to allow habituation to the diets. The daily amountof feed was increased throughout the restricted feeding period by TABLE 1 (Continued) FM PB 0%NSP 8%NSP 16%NSP 0%NSP 8%NSP 16%NSP Taurine 2.6 2.6 2.6 0.0 0.0 0.0 Methionine 11.4 11.6 11.1 6.6 6.0 6.6 Cysteine 3.7 3.8 3.7 5.8 5.4 5.9 Note: Abbreviations: BDL, below the detection limit(<30 umol/kg DM);PBx%NSP,plant-based diet with x% inclusion of the NSP-rich ingredientmixture; FMx% NSP, fishmeal-based diet with x% inclusion of the NSP-rich ingredient mixture. LT fishmeal - crude protein 72%, Triple Nine Fish protein, Esbjerg,Denmark. fThe plant protein mixture consisted of pea protein, soy protein concentrate, wheat gluten, salmon oil, L-lysine HCL,DL-methionine and L-threonine.The inclusion levels for these ingredients in the final diets are highlighted in bold and sum up to the inclusion level given for the plant protein mixturein the respective diets. INVE Salmon oil, Belgium. The vegetable oil mixture consisted of palm oil and rapeseed oil. The inclusion levels for these ingredients in the final diets are highlited in bold andsum up to the inclusion level given for the vegetable oil mixture in the respective diets. tThe NSP-rich ingredient mixture consisted of soy hulls and wheat bran. The inclusion level for these ingredients in the final diets are highlited inbold and sum up to the inclusion level given for the NSP-rich ingredient mixture in the respective diets. #Vitamin/mineral premix. Vitamins (IU or mg/kg diet): thiamin, 10 mg; riboflavin, 10 mg; pyridoxine, 10 mg; pantothenic acid, 40 mg; niacin, 20 mg; biotin, 0.2 mg; cyanocobalamin,0.015 mg; folic acid, 2 mg;ascorbic acid, 100 mg; DL-alpha tocopherol acetate, 100 IU; retinyl palmitate, 3,000 IU; DL- cholecalciferol, 2,400 IU;sodium menadione bisulphate (51%), 10 mg; inositol, 400 mg; choline, 2,000 mg; butylhydroxytolueen, 100 mg; calciumpropionate, 1,000 mg; anti-oxidant BHT(E300-321), 100 mg. Minerals (mg/kg diet): iron (as FeSO7H,O), 50 mg; zinc (as ZnSO·7H,O),30 mg; cobalt (as CoSO 7H,O), 0.1 mg; copper (as CuSO·5H,O),10 mg;selenium (as Na,SeO,),0.5 mg; manganese (as MnSO4H,O), 20 mg; magnesium (as MgSO7H,O), 500 mg; chromium (as CrCl·6H,O),1mg;calcium (as CalO,6H,O),2mg. 55NSP=1,000-ash -crude protein - crude fat - (starch + sugars). predicting fish growth and weight, using the initial body weight(117±1.6 g/fish) and an expected FCR of 1.1. The daily feed ra-tion was divided into two equal portions and was hand-fed fed at9:00 and 15:30 hr. During satiation feeding, fish were fed twicedaily at 9:00 and 15:30 hr until they stopped feeding, with a maxi-mum duration of 1 hr per feeding moment. Uneaten pellets werecollected for accurate determination of feed intake. Tanks werechecked for mortality twice daily, and dead fish were removed. Incase of mortality during restrictive feeding, the feeding list for therespective tank(s) was adjusted to maintain equal feed intake for alltreatments.Faeces were collected using swirl separators the lastweek of both the restricted and satiation feeding periods. Faecalcollection bottles were submerged into ice water to minimize bac-terial decomposition. Faeces were pooled per week and per tankand stored at -20°C for analysis. At the beginning and end of bothfeeding periods, fish were starved 24 hr and batch weighed fordetermination of total biomass. 2.4Analytical methods Faecal samples were dried at 70°C until constant weight. Driedfaeces were pulverized using a mixer mill with a 1 mm fixed screenopening set at 12,000 RPM (MM 2000 RetschQ, Brinkmann).After one week of acclimatization to ambient air in the laboratory,diets and faeces were analysed for dry matter content (DM), ash, minerals (calcium, phosphorous and yttrium), crude protein, crudefat, starch +sugars, energy, bile acid content and cholesterol con-tent. Total carbohydrates (g/kg DM) were calculated as 1,000-ash- crude protein- crude fat, and NSP (g/kg DM) as 1,000 - ash -crude protein- crude fat-(starch+sugars), with ash, crude protein,crude fat and starch + sugars expressed in g/kg DM. Additionally,diets were analysed for taurine,methionine and cysteine. Dry matter was determined gravimetrically by drying samplesin an oven at 103°℃ (ISO 6496,1999). Ash content was deter-mined gravimetrically by incineration of dried samples in a mufflefurnace at 550°C (ISO 5984, 2002). Minerals were dissolved inconcentrated sulphuric acid by autoclaving at 121°C for 20 min,and calcium, phosphorous and yttrium content were measuredby ICP-AES (NEN 15510,2007). Crude protein content was mea-sured according to Kjeldahl's method (ISO 5983-2,2009), usinga protein conversion factor of 6.25. Crude fat was determinedgravimetrically using acid hydrolysis (HydrothermQ, C. GerhardtGmbH & Co. KG) paired with Soxhlet extraction (SoxthermQ,C. Gerhardt GmbH & Co.KG) (ISO 6492, 1999). Starch and freesugars were determined using an enzymatic digestion method(Nutrilab, the Netherlands). Starch was determined after wash-ing away free sugars with 40% ethanol. The dried residue was di-gested with TermamylQ, after which starch was hydrolysed usingamyloglucosidase. The formed glucose units were determinedusing the Luff-Schoorl reagent. Starch+ sugars was measured asdescribed above, leaving out the washing step with 40% ethanol. Gross energy was measured using a bomb calorimeter (C7000IKAQ, IKA analysentechnik) (ISO 9831, 1998). The total bile acidconcentration was determined enzymatically after extractionwith diethyl ether. Extraction was performed according to Porteret al. (2003), and total bile acid concentration in the extracts wasmeasured using a commercial kit (TBA assay, Dialab@) with theuse of methanol as a reagent blank. Cholesterol was determinedenzymatically on the crude fat extract, using a commercially avail-able kit (Cholesterol liquid colour, Human GmbH). Taurine, methi-onine and cysteine in the diets were analysed by Evonik Nutritionand Care GmbH (AMINOLabQ, Germany), using ion exchangechromatography and post-column derivatization with ninhydrin.Taurine, methionine and cysteine were oxidized with performicacid, which was neutralized with sodium metabisulfite. Aminoacids were liberated from the protein by hydrolysis with 6 N HClfor 24 hr at 110°C and quantified with the internal standard bymeasuring the absorption of reaction products with ninhydrin at570 nm. Tryptophan was determined by HPLC with fluorescencedetection (extinction 280 nm, emission 356 nm), after alkaline hy-drolysis with barium hydroxide octahydrate for 20 hr at 110°C. 2.5 Calculations Calculations of performance indicators, apparent digestibil-ity coefficients, faecal bile acid loss and faecal cholesterol losswere made for both the restricted and satiation feeding periodsseparately. Mortality (9) was calculated as (No-N)/N×100%, where N八and N. are the number of fish at the beginning and end of eachfeeding period respectively. Feed conversion ratio on dry matterbasis (FCR; g/g) was calculated as (Fl× dmF)/(W-W), where Flis feed intake (g), dmF is the dry matter content of the feed (%),and Wand W. are the initial and final BW (g) for each feedingperiod respectively. Feed intake (FI; % BW/day) was calculatedas FI/t/Wx100%, where Fl is feed intake (g), t is the number ofdays, and W, is the geometric mean BW (g) of each feeding pe-riod respectively. The W was calculated as e((InW+InW)/2), whereW, and W. are the initial and final BW (g) for each feeding pe-riod respectively.Relative faeces production on dry matter basis(RFP; % BW/day) was calculated as Flx(dmF)x(D./F)/t/Wx100%, where Fl is feed intake (g), dmF is the dry matter content ofthe feed (%), D. is the percentage inert marker of the diet, F. is thepercentage inert marker of the faeces, t is the number of days,and W. is the geometric mean BW (g) of each feeding period re-spectively. Specific growth rate (SGR; % BW/day) was calculatedas (In W-In W)/tx 100%, where W and W. are the initial andfinal BW (g), and t is the number of day of each feeding periodrespectively. The apparent digestibility coefficient (%) of each nutrient wascalculated using the formula described by (Halver & Hardy, 2002):1-((F/D)x(D./F:))×100, where D is the percentage nutrient (or kJ/ggross energy) of the diet, F is the percentage nutrient (or kJ/g gross energy) of the faeces, D. is the percentage inert marker of the diet,and F. is the percentage inert marker of the faeces. Faecal bile acid loss (umol kg-1BW day-1) was calculated as((FIx(D/F))/t)/W)x F, where Fl is feed intake (g), D. is the per-centage of inert marker in the diet, F. is the percentage of inertmarker in the faeces, t is the number of days, W.is the geometricmean BW (kg), and F, is the faecal bile acid content on wet weight(umol/g) for each feeding period respectively.Faecal cholesterolloss (mg kg-1BW day-1) was calculated as ((FIx (D/F))/t)/W)×F,where Fl is feed intake (g), D. is the percentage of inert marker inthe diet, F. is the percentage of inert marker in the faeces,t is thenumber of day, W is the geometric mean BW (kg), and F. is thefaecal cholesterol content on wet weight (mg/g) of each feedingperiod respectively. 2.6|Statistical analysis Tanks (n=12) were considered as experimental units. Combined dataof restricted feeding and satiation feeding were first analysed using amixed model ANOVA to look at the effect of feeding level (i.e. feedingperiod), protein source (PS), NSP level, their interaction effects and therandom effect of tank nested within PS and NSP level. The effect ofPS, NSP level and their interaction were tested against the random ef-fect of tank nested within PS and NSP level. The effect of feeding leveland its interactions with PS and NSP level were tested against the ran-dom error of the whole model (i.e. random variation within tanks be-tween feeding levels). Data were tested for sphericity using Mauchly'stest. Since for many parameters interaction effects between feedinglevel and both PS and NSP level were present, data of restricted feed-ing and satiation feeding were also analysed separately using a two-way ANOVA for the effect of PS, NSP level and their interaction. Alldata were tested for homogeneity of variance by Levene's test priorto ANOVA. Normal distribution of residuals was checked using theKolmogorov-Smirnov test. ANOVA was followed by a Tukey's testfor pairwise comparison of means. The correlations were tested usingPearson's correlation test. Statistical significance was tested at the0.05 probability level. All tests were performed using the statisticalprogram SPSS statistics 23, IBM Statistics Inc. 3 RESULTS 3.11Performance Performance indicators were calculated to judge the quality of theexperiment. Full results on fish performance are given in the TableS1. Mortality was low, and no effect of treatment occurred. Fishmeal-based (FM) diets had significantly better feed conversion ratios (FCR)compared to the plant-based (PB) diets (p<.05), and NSP level nega-tively affected the FCR during both feeding periods (p<.01). Growth(SGR) followed a similar trend, except that, during satiation feeding,higher NSP levels significantly increased SGR (p <.01). The latter FIGURE 1 Feed intake (FI, % BW/day) during (a) restricted feeding and (b) satiation feeding of diets differing in protein source (PS) andnon-starch polysaccharide (NSP) level; Relative faeces production (RFP, % BW/day) during (c) restricted feeding and (d) satiation feeding ofdiets differing in PS and NSP level; BW, body weight; Error bars indicate standard error of means; NS, not significant; #: p<.1;*: p<.05; **:p <.01; ***: p<.001; Treatments in the same panel lacking common letters are statistically different(p<.05) according to Tukey's multiplecomparison test FIGURE 22Fat apparent digestibility coefficient (ADC, %) during (a) restricted feeding and (b) satiation feeding of diets differing in protein source(PS) and non-starch polysaccharide (NSP) level; Error bars indicate standard error of means; NS, not significant; #: p<.1; *:p<.05;**:p<.01; ***:p<.001; Treatments in the same panel lacking common letters are statistically different (p <.05) according to Tukey's multiple comparison test occurred in parallel with higher feed intake (FI) of the high-NSP dietsduring satiation feeding (p <.01). Since the results of fat apparentdigestibility coefficients (ADC) and faecal bile acid loss are later in thediscussion related to feed intake and relative faeces production (RFP),the latter parameters are further focused on in this section. Resultson feed intake during both feeding periods are shown in Figure 1 aand b. Feed intake was equal for all diets during restricted feedingand averaged 1.20 ± 0.017% BW/day. During the satiation feedingperiod, feed intake of the FM diets (averaged 1.67±0.231% BW/day)was higher compared with the PB diets (averaged 1.25±0.225%BW/day) (p<.01). Moreover, feed intake increased with dietary NSP level(p<.01). An interaction effect between NSP level and protein source (PS) on feed intake was not present (p>.05). Faeces production (RFP;% BW/day) is shown in Figure 1 c and d. Relative faeces productionincreased alongside dietary NSP level during both feeding periods (p<.001) but the increase was more pronounced during satiation feed-ing, in particular for the FM diets (p<.05). 3.22Nutrient Apparent digestibility Full results on nutrient ADC are given in the Table S2. Because ofthe focus in this study, effects on fat ADC are described in moredetail below and are also shown in Figure 2 a and b. The significant FIGURE3FFaecal bile acid loss (umol kgBW day) during (a) restricted feeding and (b) satiation feeding of diets differing in proteinsource (PS) and non-starch polysaccharide (NSP) level; BW, body weight; Error bars indicate standard error of means; NS, not significant; #:p<.1; *:p<.05;**: p<.01; ***:p<.001; Treatments in the same panel lacking common letters are statistically different (p <.05) accordingto Tukey's multiple comparison test interaction effect between feeding level and NSP level showed adecrease in fat ADC with increasing feeding level (p<.01), the latterbeing strongest for the high-NSP diets.Furthermore, the decreasein fat ADC with feeding level was more pronounced for the FMdiets compared with the PB diets (p<.01). Neither PS nor NSP levelhad a significant effect on fat ADC during restrictive feeding (p>.05).In contrast, satiation feeding showed both main effects of PSand NSP level on fat ADC (p<.01), as well as an interaction effectbetween PS and NSP level (p<.05). The fat ADC of the FM dietsdecreased from 90.2% to 82.8% with increasing dietary NSP level,while being unaffected for the PB diets. 3.3}|Faecal NSP content, faecal bile acid content,faecal bile acid loss and faecal cholesterol loss Results on faecal NSP content, faecal bile acid content, faecal bileacid loss, faecal cholesterol content and faecal cholesterol loss aregiven in Table S3. Feeding level did not affect the faecal NSP content(p>.05). During both feeding periods, faecal NSP content was signifi-cantly higher for fish fed the PB diets (p<.001). Moreover, faecal NSPcontent increased alongside dietary NSP level (p<.001), and during satiation feeding this increase was more pronounced for fish fed theFM diets (p<.05). Faecal bile acid content (p >.05) was unaffectedby feeding level and NSP level (p >.05). Faecal bile acid content wasunaffected by PS during restricted feeding (p >.05), while satiationfeeding resulted in a slightly higher faecal bile acid content of fish fedthe FM diets (p<.05). Results on faecal bile acid loss are also shown inFigure 3. Feeding level did significantly increase the faecal bile acid loss(p<.05). Furthermore, the interaction effect between feeding leveland NSP level indicates that the observed increase in faecal bile acidloss alongside dietary NSP level was stronger during satiation feed-ing compared to restricted feeding (p<.05). However, looking at theindividual feeding periods,NSP level tended to increase faecal bile acidloss only during satiation feeding (p <.1). Combined data of restrictedfeeding and satiation feeding also showed this increase in faecal bileacid loss with increasing NSP level (p<.05). PS had an effect on faecalbile acid loss during satiation feeding, showing higher faecal bile acidlosses for fish fed the FM diets compared with the PB diets (p<.01).Faecal cholesterol loss was higher during satiation feeding comparedwith restricted feeding (p<.05), and the difference in faecal choles-terol loss between feeding periods was biggest for the FM diets (p<.05). No effects of dietary treatment on faecal cholesterol loss werefound during restricted feeding (p >.05). Satiation feeding showed an FIGURE 4Relationship between relative faeces production (RFP; % BW/day) and faecal bile acid loss (umol kg1 BW day-1) during (a)restricted feeding and (b) satiation feeding of diets differing in protein source (PS) and non-starch polysaccharide (NSP) level; BW, bodyweight; NS, not significant; #: p<.1;*:p<.05;**: p<.01; ***:p<.001 Aquaculture Research--WWILEY- FIGURE 5 Relationship between faecal bile acid loss (umol kg-1BW day-1) and fat apparent digestibility coefficient (ADC, %) during (a)restricted feeding and (b) satiation feeding of diets differing in protein source (PS) and non-starch polysaccharide (NSP) level; BW, bodyweight; NS, not significant; #: p<.1;*: p<.05;**: p<.01; ***:p<.001 increase in faecal cholesterol loss alongside dietary NSP level (p<.01).Furthermore, satiation feeding of the FM diets compared with the PBdiets resulted in more faecal cholesterol loss (p<.001). 3.4|Relationship between relative faecesproduction and faecal bile acid loss,and betweenfaecal bile acid loss and fat ADC Figure 4 a and b show the relationship between relative faecesproduction (RFP) and faecal bile acid loss. Positive relationshipsbetween faeces production and faecal bile acid loss were foundfor both restricted feeding and satiation feeding, however, thecorrelation was only significant during satiation feeding (p<.001).Increasing faeces production with 0.1% BW/day resulted in an in-crease in faecal bile acid loss of 2.04 and 6.36 umol kg 1BW day-1during restricted feeding and satiation feeding respectively. Theincrease in faecal bile acid loss in response to higher faeces produc-tion was thus stronger during satiation feeding (Pearson's correla-tion coefficient: .852) compared with satiation feeding (Pearson'scorrelation coefficient: .417). Figure 5a and b show the relation-ship between faecal bile acid loss and fat ADC. Fat ADC was nega-tively correlated with faecal bile acid loss during both restrictedfeeding and satiation feeding; however, the correlation was onlysignificant for the satiation feeding period (p<.01). Increasing fae-cal bile acid loss with 10 pmol/kg BW/day corresponded with adecrease in fat ADC of 1.1% during restricted feeding and 2.3%during satiation feeding. The response of fat ADC to an increasein faecal bile acid loss was thus much stronger during satiationfeeding (Pearson's correlation coefficient: -.801) compared withrestricted feeding (Pearson's correlation coefficient: -.155). 4 DISCUSSION The current study with rainbow trout showed that the fat apparentdigestibility coefficient (ADC) averaged over all dietary treatments was negatively affected by increased feeding level (Figure 2). Thisis in contrast with the finding of Windell, Foltz, and Sarokon (1978),who did not detect an effect of increased feeding level on fat ADC inrainbow trout. On the other hand, Haidar, Petie, Heinsbroek, Verreth,and Schrama (2016) and Schrama et al. (2012) did find a decline in fatADC with increased feeding level for Nile tilapia. Comparing thesestudies shows that the impact of feeding level on absolute declinein fat ADC can strongly differ. This confirms the statement in thereview of Olsen and Ringo (1997), that adequate information aboutthe effect of feeding level on fat ADC in fish is limiting and ofteninconclusive. This variability in impact of feeding level on fat ADCmight be related to differences in diet formulation. In this study, thedecline in fat ADC with feeding level was dependent on both NSPlevel and protein source. During restricted feeding, minor differ-ences in fat ADC were present,whereas during satiation feeding,fat ADC ranged between 90.2% and 82.8% for the fishmeal-based(FM) diets and between 90.1% and 88.4% for the plant-based (PB)diets. This study thus shows that the effect of feeding level on fatADC is dependent on dietary composition (i.e. NSP level and PS). Asa consequence of the chosen experimental design, the observed ef-fect of feeding level on ADC during satiation feeding might partiallybe due to an age or weight effect of the fish. However, no studies inliterature report a decrease in ADC with increasing age of weight infish. The observation in the current study of a decrease in ADC formost nutrients suggests that age or weight is unlikely to have beenthe cause of the decline in ADC. However, if an age or weight effectwas present, it will most likely have led to an underestimation of thefeeding level effect. Diets in the current study were formulated with either fishmealor a plant protein mixture as main PS, which aimed at creating acontrast in supply of bile acids, the bile acid precursor cholesterol,taurine and methionine + cysteine (Table 1). Lower supply thesecompounds in the PB diets compared with the FM diets were hy-pothesized to result in lower fat ADC, the latter because rate-limit-ing steps exist in bile acid synthesis from cholesterol (Chiang,2013),endogenous cholesterol synthesis (Deng et al., 2013) and taurinesynthesis from methionine and cysteine (Gaylord et al., 2007). Endogenous synthesis alone might be too low to compensate fae-cal bile acid loss and maintain a sufficiently large bile acid pool tosupport proper fat digestion.However, the current study showedthat lower bile acid, cholesterol, taurine and cysteine + methioninelevels in the PB diets did not result in lower fat ADC (Figure 2). Onthe contrary, averaged over NSP level, fat ADC was lowest for fishfed the FM diets. Although taurine was completely absent from thePB diets (Table 1), fat ADC was not significantly lower comparedwith the control FM diet. This result is not in line with the obser-vation of Richard, Colen, and Aragao (2017) in Senegalese sole thatfat ADC of a taurine-free PB diet significantly improved after tau-rine supplementation.However, taurine synthesis capacity is highlydependent on fish species. Many marine fish species have a lowtaurine synthesis capacity, creating a need for exogenous taurine,while exogenous taurine seems not required for many freshwaterfish species (Divakaran, Ramanathan, & Ostrowski, 1992; El-Sayed,2014). Nevertheless, Gaylord et al. (2007) showed for rainbowtrout cultured in freshwater that taurine supplementation to PBdiets was beneficial for growth (fat ADC was not reported), how-ever, only when no crystalline methionine + cysteine was provided.In the current study, a minimal amount of methionine was supple-mented to the PB diets in order the meet both individual and com-bined cysteine + methionine requirements (NRC, 2011). If dietarymethionine+cysteine levels of the PB diets would have been lower,taurine synthesis might have become limiting to support proper fatADC. Besides taurine requirement, little attention has been giventowards the dietary requirement of cholesterol of most farmed fish.Kortner, Bjorkhem, Krasnov, Timmerhaus, and Krogdahl (2014) didnot find an improvement of fat ADC in Atlantic salmon fed PB dietsafter cholesterol supplementation. The dietary cholesterol level inthe PB diets in this study was lower than those in the aforemen-tioned study, but still seems sufficient to support proper fat ADCin rainbow trout. Availability of cholesterol for bile acid synthesismight have becoming limiting for fat ADC of fish fed the FM dietsto satiation because of a significant increase of faecal cholesterolloss for those fish (Table S3).Increased cholesterol loss due to NSP-rich diets has been demonstrated by Moundras, Behr, Remesy, andDemigne (1997) in rats. The outcome of this study suggests thatintake of bile acids, cholesterol, taurine and cysteine + methioninein rainbow trout fed PB diets was sufficient to support proper fatdigestion. In contrast, fat ADC of the FM diets fed to satiationwas lowered compared with restrictive feeding, especially for thehigh-NSP diets. This suggests that intake of bile acids, cholesterol,taurine and cysteine + methionine and/or other dietary factors canlimit fat ADC in fish fed FM diets to satiation. For both protein sources, three diets were formulated with in-creasing inclusion level of an NSP-rich ingredient mixture (Table 1).Some NSP can sequester bile acids (Li, Mense, Brewer, Lau, & Shi,2017), and increasing the dietary NSP level aimed at enhancing fae-cal bile acid loss. Enhanced faecal bile acid loss was hypothesized toreduce the amount of bile acids available for micelle formation,re-sulting in a reduction of fat ADC. The results of this study showed noeffect of dietary NSP level on faecal bile acid loss during restricted feeding, whereas satiation feeding showed a trend for increased fae-cal bile acid loss alongside NSP level (Figure 3). Furthermore, theobserved increase in faecal bile acid loss during satiation feedingwas more pronounced for fish fed the FM diets compared with thePB diets, the former having the highest feed intake. In literature, areduced fat ADC of diets with high-NSP content is often related todirect binding or entrapment of bile acids by NSP, which is mainlyassociated with soluble NPS (Adam et al., 2001; Dongowski, 2007;Ide et al., 1989; Ikegami et al., 1990; Matin et al.,2016). However, innone of these studies, faecal bile acid content was reported. In thecurrent study, the increase in faecal bile acid loss with NSP level wasnot caused by bile acid-NSP binding or entrapment. This was sub-stantiated by the absence of an NSP level effect on both the faecalbile acid content and the faecal bile acid loss in the PB diets (despiteequal amounts of NSP were included in both FM and PB diets) (TableS3). Rather than direct binding or entrapment of bile acids by NSP,the data of the current experiment indicate that in the interpretationof the effect of dietary NSP level on faecal bile acid loss, also feedinglevel/faeces production needs to be considered. Dietary NSP levelaffected both feed intake and faeces production (Figure 1). Feedintake increased with NSP level during satiation feeding. Literatureshows that nutrient dilution due to presence of NSP can be com-pensated by higher feed intake (Dias, Huelvan, Dinis, & Metailler,1998; Lekva, Hansen, Rosenlund, Karlsen, & Hemre, 2010; Sinha etal., 2011). The higher feed intake of the FM diets compared withthe PB diets in this study might be explained by higher palatabil-ity of diets containing fishmeal for rainbow trout (Gomes, Rema, &Kaushik, 1995). Evidently, higher feed intake results in higher faecesproduction. This is especially the case for NSP-rich diets, since NSPare mostly indigestible to monogastrics (Choct, Dersjant-Li,McLeish,& Peisker, 2010; Sinha et al., 2011) and can cause faecal bulking(Davidson & McDonald,1998). As faeces production increased, sodid the amount of faecal bile acid loss. This is also indicated by thepositive correlation between faeces production and faecal bile acidloss during satiation feeding,while absent for the restricted feedingperiod (Figure 4). An increase in faecal bile acid loss because higherfaeces production has to our knowledge not been reported for fishso far. Besides dietary NSP level, also presence of saponins in soy hullsin the NSP-rich ingredient mixture could have contributed to the in-crease in faecal bile acid loss and decrease in fat ADC observed in thisstudy. The majority of saponins forms non-absorbable complexeswith bile acids (Kregiel et al.,2017), inhibit pancreatic lipase activity(Han, Xu, Kimura,Zheng, & Okuda, 2000) and can cause enteritis insalmonids (lwashita, Suzuki, Matsunari, Sugita, & Yamamoto,2009;Knudsen et al., 2008;Kortner, Penn,Bjorkhem, Masoval,& Krogdahl,2016; Krogdahl et al., 2015). In this study, the increase in faecal bileacid loss and reduction in fat ADC only occurred for the FM diets.Since soy hulls were included in the same levels in both FM and PBdiets, soy saponins are unlikely to have had a major contribution tothe adverse effects on faecal bile acid loss and fat ADC. Also, enteri-tis is unlikely to have occurred since Krogdahl et al. (2015) found thata minimum level of 2 g soy saponins/kg diet was needed to induce enteritis in Atlantic Salmon, and the maximum level in the FM dietsin this study was estimated to be around 1.6 g soy saponins/kg diet,based on 20 g saponins/kg soy hulls (Shi et al., 2004). The effects of dietary treatment on fat ADC followed a trendsimilar to faecal bile acid loss (Figure 2). No effect of NSP level andPS on fat ADC occurred during restricted feeding. Satiation feedingresulted in a decrease in fat ADC alongside NSP level, but the lat-ter was only significant for the FM diets. Negative effects of NSPon fat ADC in fish have been described in literature. Storebakken(1985) and Amirkolaie, Leenhouwers,Verreth, and Schrama (2005)showed that the increase in digesta viscosity caused by guar gumreduced mixing of fat and digestive enzymes, resulting in loweredfat ADC in respectively rainbow trout and Nile tilapia. In the currentstudy, the NSP-rich ingredient mixture (Table 1) consisted mainlyof the non-viscous NSP cellulose and hemicellulose (Englyst, 1989;Knudsen, 1997). Increased digesta viscosity was thus unlikely thecause for the decrease in fat ADC in this study, since this would oth-erwise also have resulted in a decreased fat ADC for fish fed thePB diets during both restricted feeding and satiation feeding. NSPcomposition of the diets in this study was more similar to those usedin the study by Hansen and Storebakken (2007). They did not findadverse effects on fat ADC of rainbow trout fed diets rich in the NSPcellulose, which is not in line with the outcome of the current study.Keeping in mind that the effect of NSP on fat ADC was dependenton feeding level in this study, differences in feeding level betweenthe study of Hansen and Storebakken (2007) (±0.9% BW/day) andthe current study (±1.9% BW/day) might be an explanation for thedifference in effect of NSP level on fat ADC. The similar trend of faecal bile acid loss and fat ADC in re-sponse to the dietary treatments might imply a connection be-tween both. Indeed,a significant negative correlation betweenfaecal bile acid loss and fat ADC was found for the satiation feed-ing period, while this correlation was absent during restrictedfeeding (Figure 5). This connection between fat ADC and faecalbile acid loss was reported by Overton et al. (1994) for rats, butis to our knowledge not reported for fish so far. The correlationbetween faecal bile acid loss and fat ADC might mean that thatthe total bile acid pool available for fat is limiting when faecal bileacid loss becomes too high in trout, the latter under a combinationof dietary characteristics (i.e. high palatability and high-NSP level)and high feeding levels. 5 1cCONCLUSION The similar/higher fat ADC when substituting fishmeal with a plantprotein mixture suggests that the lower intake of bile acids, the bileacid precursor cholesterol, taurine and the taurine precursors (me-thionine + cysteine) of fish fed the plant-based diets did not ham-per fat digestion. The enhanced faecal bile acid losses at higherdietary NSP levels during satiation feeding were not related to bileacid binding/entrapment by NSP, but were linked to an increasedamount of faeces produced. During satiation feeding, fat ADC was negatively correlated with faecal bile acid losses. This indicatesthat bile acid synthesis/uptake in rainbow trout is insufficient forproper fat digestion under conditions (i.e. dietary NSP level andfeeding level) that strongly enhance faecal bile acid losses. ACKNOWLEDGMENTS The authors would like to thank Menno ter Veld and the staff of theaquaculture research facilities of Wageningen University for theirtechnical support in running the experiment. Furthermore, we wouldlike to acknowledge Ronald Booms and Tino Leffering for their sup-port during the chemical analysis and Evonik Nutrition and CareGmbH for analysis of taurine, methionine and cysteine. This studywas funded by the Netherlands Organization for Scientific Research(NWO) (grant number 022.004.005), Cargill, Evonik Nutrition andCare GmbH and Saria. The aquatic metabolic unit used in this studywas cofounded by the NWO (code 805-34.025). CONFLICT OF INTEREST The authors have no conflict of interest to declare. DATA AVAILABILITY STATEMENT Data available on request from the authors. ORCID Thomas W. O. Staesseniphttps://orcid.org/0000-0001-5551-1586Johan W. Schrama https://orcid.org/0000-0001-7156-8806 REFERENCES ( Adam, A . , Levrat-Verny, M. A.,L o pez, H. W.,Leuillet, M., Demigne, C., & R emesy, C . (2001). Whole wheat and triticale flours with differing viscosities stimulate cecal fermentations and lower p lasma and h e - patic l ipids in rats. Journal of Nutrition, 131(6), 1770-1776. https:// doi.org/10.1093/jn/131.6.1770 ) ( A mirkolaie, A. K., L eenhouwers, J. I. , Verreth, J. A . J., & Schrama, J. W. (2005). Type of dietary fibre (soluble versus i nsoluble) influences di-gestion, faeces c haracteristics and f aecal w aste p r oduction in Nile tilapia (Oreochromis niloticu s L.). Aquacultu r e Research,36(12),1157- 1166. h ttps://doi.org/10.1111/j.1365-2109.2005.01330.x ) ( Cai, S .-Y., Xiong, L., Wray, C. G., Ballatori, N., & Boyer, J . L.(2007).The f arnesoid X receptor FXRo/NR1H4 ac q uired ligand s p ecific-ity for bile salts late in vertebrate evolution. American Journal of P hysiology-Regulatory, I n tegrative and Comparative Physiology, 293(3),R1400-R1409. https://doi.org/10.1152/ajpregu.00781.2 0 06 ) Chiang, J. Y. (2013). Bile acid metabolism and signaling. ComprehensivePhysiology,3(3), 1191-1212. https://doi.org/10.1002/cphy.c120023 ( Choct, M . (1999). S oluble n on-starch polysaccharides a f fect n e t u t ili- s ation o f energy by chickens. Recent A d vances in Animal Nu t rition in Australia, 12(1),31-36. ) ( Choct, M ., D ersjant-Li, Y. , McLeish, J. , & Peisker, M. (2010) . SoyOligosaccharides and Soluble N on-starch Polysaccharides: A Review of D igestion, Nutritive and Anti-nutritive Ef f ects in Pigs and Poultry. Asian-Australasian Journal of Animal Sciences , 23(10) , 1386-1398. https://doi.org/10.571 3 /ajas.2010.90222 ) ( Davidson, M. H., & McDonald, A. (1998). Fiber: Forms and func- t ions. Nutrition Research, 18(4), 617-624. https://doi.org/10.1016/S0271-5317(98)00048-7 ) ( D eng, J. M., Bi, B. L., Kang,B., Kong, L . F . , W ang, Q. J.,& Zhang,X. (2013).Improving the growth performance and cholesterol metabolism of ) ( rainbow trout ( Oncorhynchus mykiss) fed soyabean meal-based dietsusing dietary c h olesterol supplementation. British Journal of Nutrition, 110(1), 29-39. https://doi.org/10.1017/SO007114512004680 ) ( Dias, J . , Huelvan, C ., D inis, M. T., & Metailler, R. ( 1998). I nfluence of d i -etary bulk a g ents (s i lica, cellulose and a n a t ural zeolite) on proteindigestibility , growth, feed intake and feed transit time in Europeanseabass (Dicentrarchus l a brax) j u veniles. A q uatic Living Resources,11(4),219-226. https://doi.org/10.1016/S0990-7440(98)89004-9 ) ( Divakaran, S., Ramanathan, S., & Ostrowski, A. (1992). Endogenousproduction of taurine i n t wo t e leost f i sh: C oryphaena h i ppurus and red h y brid tilapia. Comparative B iochemistry and Physiology Part B : C o mparative Biochemistry, 101(3), 321-322. http s ://doi.org/10.1016/0305-0491(92)90006-D ) ( Dongowski, G. (2007).Interactions between dietary fibre-rich prepara-tions and glycoconjugated bil e acids in vitro. Fo o d Chemistry, 104(1),390- 3 97.https://doi.org/10.1016/j.foodchem.2006.11.053 ) ( El-Sayed, A. F. M. ( 2014). I s dietary t aurine s upplementation be n efi- cial for farmed f ish and shrimp? A Comprehensive Rev i ew. Rev i ews in Aquaculture, 6(4),241-255.https://doi.org/10.1111/raq.12042 ) ( Englyst, H. ( 1989). Cl a ssification n and Measurement of Plant Polysaccharides. Animal Feed Science and Technology,23(1-3), 27-42.https://doi.org/10.1016/0377-8401(89)90087-4 ) ( Gaylord, T.G., Barrows, F . T., Teague, A . M ., J ohansen, K . A., O verturf, K. E., & Shepherd, B. (2007) . Supplementation of taurine and me- thionine t o all-plant protein diets for rainbow trout ( Oncorhynchus mykiss). Aquaculture, 2 69(1-4), 5 1 4-524. https://doi.org/10.1016/j. aquaculture.2007.04.011 ) ( Gomes, E. F . , R ema, P . , & K aushik,S. J. (1995). R eplacement of fish meal by p lant proteins in the diet of rainbow trout (Oncorhynchus M ykiss):Digestibility and growth performance. A quaculture,130(2-3), 177-186.https://doi.org/10.1016/0044-8486(94)00211-6 ) ( Gu, M ., K ortner, T. M ., P enn, M., Hansen, A. K., & Krogdahl, A. (2014).Effects of dietary plan t meal and soya-saponin supplementation on intestinal and hepatic lipid droplet accumulation, lipoprotein andsterol m etabolism in Atlantic sa l mon. (Salmo Sala r L.). B ritish Journalof Nutrition , 111(3), 432-444. https://doi.org/10.1017/SO00711451 3002717 ) ( Hagey, L. R ., Moller, P. R., Hofmann, A. F., & K rasowski,M. D. (2010).Diversity of bile salts in fish and amphibians: E v olution of a complex biochemical pathway. P h y siological a n d Biochemical Zo o logy, 83 ( 2), 308-321. https://doi.org/10.1086/649966 ) ( Haidar,M. N . , Petie,M . , Heinsbroek, L. T.N., Verreth, J. A. J ., & Schrama,J. W.(2016). The effect o f type of carbohydrate (starch vs. nonstarchpolysaccharides) o n n u trients digestibility, energy r e tention an d maintenance requirements in Nil e tilapia. Aquaculture, 463,241-247.https://doi.org/10.1016/j.aquaculture.2016.05.036 ) ( Halver, J. E., & Hardy, R. W.( 2 002). F i sh N u trition. C ambridge, M A :Academic press. ) ( Han, L.-K. , Xu, B .-J., Kimura, Y ., Zheng, Y.-N., & O k uda, H. (20 0 0). Platycodi radix affects lipid metabolism in m ice with high fat diet-in-duced obesity. The Journal of Nutrition, 130(11),2760-2764. h t tps://doi.org/10.1093/jn/130.11.2760 ) ( Hansen, J . O., & S t orebakken, T. (2 0 07). Effects of d ie t ary celluloselevel on pellet quality a n d nu t rient digestibilities in ra i nbow trout ( Oncorhynchus mykiss). Aquaculture, 2 72(1- 4 ), 458-465. h t tps://doi. org/10.1016/j.aquaculture.2007.09.005 ) ( Ide, T., Horii, M., Kawashima, K., & Yamamoto, T . ( 1 989). Bile a cid con- j ugation a nd h epatic taurine concentration in rats fed on pectin. Britissh Journal of Nutritio n , 62(3),539-550. h ttps://doi.org/10.1079/ BJN19890056 ) ( Ikegami, S ., Tsuchihashi, F ., Harada, H ., T suchihashi, N . , Nishide, E . , & Innami, S. ( 1990). E ffect o f v iscous indigestible p olysaccharides onpancreatic-biliary secretion and d igestive o rgans in rats. Journal of Nutrition, 120(4), 353-360.https://doi.org/10.1093/jn/120.4.353 ) ( I washita, Y., Suzuki, N.,Matsunari, H., Sugita, T., & Yamamoto,T. (2009). Influence of soya saponin, soya l ectin, and cholyltaurine supple-mented t o a c a sein-based s e mipurified diet on i n testinal m orphol-ogy and b i liary bile status in fingerlin g rainbow trout Oncorhynchusmykiss. Fisheries Science , 75(5 ) , 1307-1315. https://doi.org/10.1007/ s12562-009-0158-1 ) ( K nudsen, D . , Jutfelt, F . , Sundh, H . , Sundell, K . , K o ppe, W., & Frokiaer, H. (2008). Dietary soya saponins increase gut permeability and play a key role in the onset of s oyabean-induced enteritis in Atlantic salmon(Salmo salar L .). British Journal of Nutrition, 100(1), 120-129. https://doi.org/10.1017/SO007114507886338 ) ( K nudsen, K . E . B. (1997). Carbohydrate and lignin c o ntents of plant m a -terials used in animal feeding. Animal Feed S c ience a n d Technology, 67(4),319-338.https://doi.org/10.1016/S0377-8401(97)00009-6 ) ( Kortner, T . M., Bjorkhem, I . , Krasnov, A. , Timmerhaus, G., & Krogdahl,A. (2014). Dietary c holesterol supplementation to a plant-based diet suppresses the complete pathway of cholesterol sy n thesis and in - duces bile acid production in At l antic salmon (Salmo salar L.). Bri t ish Journal of Nutrition, 111(12 ) ,2089-2103. h ttps://doi.org/10.1017/ S0007114514000373 ) ( Kortner, T. M., Penn, M . H., B jorkhem, I . , M asoval, K., & Krogdahl, A. ( 2016). Bile components a n d le c ithin s u pplemented to pl a nt based diets do n o t diminish di e t related in t estinal i n flammation in Atlantic salmon. BMC Ve t erinary Re s earch, 12 ( 1), 19 0 . ht t ps://doi. org/10.1186/s12917-016-0819-0 ) ( K regiel, D ., Berlowska, J., Witonska, I., Antolak, H., Proestos, C., Babic, M., &Zhang, B . (2017). Saponin-based,biological-active surfactants from plants. In E. Najjar (Ed.), Application a nd characterization o f sur- factants ( 1st e d., p p. 1 83-205). Ri j eka, Cr o atia: In T ech. htt p s://doi. org/10.5772/68062 ) ( Krogdahl, A . , Gajardo, K . , Kortner, T . M., Penn, M., Gu, M. , Ber g e, G. M.,& Bakke, A . M . ( 2 015). Soya saponins in d uce enteritis in Atlantic salmon ( S almo sa l ar L.). Journal o f A g ricultural and F o od Chemistry, 63(15),3887-3902. https://doi.org/10.1021/jf506242t ) ( K umar, V . , Makkar, H. P. S. , & B e c ker, K. ( 20 1 1). Nut r itional, phy s - iological and haematological responses in rainbow t rout (Oncorhynchus m ykiss) juveniles fed detoxified Jatropha curcas kernel meal. Aquaculture Nu t rition, 17(4), 4 5 1-467. ht t p s://doi. org/10.1111/j.1365-2095.2010.00825.x ) ( L anzini, A., & Lanzarotto, F. (2000). The ‘mechanical p umps' a n d the enterohepatic circulation o f b ile a cids-defects in coeliac disease.Alimentary Pharmacology & T herapeutics, 14, 5 8-61. h t tps://doi.org/10.1046/j.1365-2036.2000.014s2058.x ) ( L eenhouwers, J. I. , t e r V e ld, M . , V e rreth, J. A . J., & Sc h rama, J. W . (2007). D igesta c haracteristiscs and performance of African ca t - fish ( Clarias gariepinus) f ed cereal grains tha t dif f er in visc o sity. Aquaculture, 264(1-4), 330-341. https://doi.org/10.1016/j.aquac ulture.2007.01.003 ) ( Lekva, A ., H ansen, A . -C., Rosenlund, G., K a rlsen, O . , & He m re, G.- l. (2010). Energy d ilution with o -cellulose i n diets for Atlantic cod ( Gadus morhua L. ) juveniles-Effects on growth, feed intake, liver sizeand digestibility of nutrients. Aquaculture, 300(1-4), 1 69-175. h t tps://doi.org/10.1016/j.aquaculture.2010.01.001 ) ( Li, C. Y., Mense, A. L . , Brewer, L. R., L a u, C., & Sh i , Y. C. (2017). In vi t robile acid binding capacity of wheat bran w i th different p a rticlesizes. Cereal Chemistry, 94(4), 654-658. https://doi.org/10.1094/ CCHEM-08-16-0211-R ) ( Maldonado-Valderrama, J . , Wilde, P., M acierzanka, A ., & M a ckie,A. ( 2011). The role of b i le salts i n d igestion. Advances i n Colloid and In terface S cience, 16 5(1), 36 -46. htt p s://doi.org/10.1016/j. cis.2010.12.002 ) ( Matin, H . R. H., S h ariatmadari,F., T orshizi, M. A. K., & Chiba, L. I. (2016).In vitro bile acid-binding capacity o f dietary fibre sources a n d theireffects w ith b ile a cid o n b r oiler chicken p e rformance and lipi d ) ( digestibility . British Poultry Science, 5 7(3), 348-357. ht t ps://doi.org/10.1080/00071668.2016.1163522 ) ( M oundras, C., Behr, S. R., Remesy, C., & Demigne,C. (1997). Fecal losses of sterols and bile acid s induced by feeding rats guar gum are dueto greater pool size and liver bile acid secretion. Journal of N utrition, 1 27(6), 1 068-1076.ht t ps://doi.org/10.1093/jn/127.6.1068 ) ( National R esearch Council (2011). N u trient requirements o f fish a ndshrimp. Washington, DC:National Academies Press. ) ( Olsen,R. E., & R i ngo,E.(1997). Lipid digestibility in fish: A r eview. RecentResearch Developments in Lipid R esearch, 1 , 1 99-265. ) ( Overton, P . D . , Furlonger, N., B e ety, J. M . ,Ch a kraborty,J., Tred g er, J.A., & M organ, L . M. ( 1 994). The effects of dietary sugar-beet fibreand guar gum on lip i d metabolism in W i st a r rats. British Journal ofNutrition,72(3),385-395.https://doi.org/10.1079/BJN19940041 ) ( Pasquier, B., Armand,M. , Castelain,C., Guillon, F., B o rel, P., Lafont, H .,& Lairon, D. ( 1996). Emulsification a nd lipolysis of triacylglycerols are altered by viscous soluble dietary f i bres in acidic gastric medium invitro. Biochemical Journal, 314(1), 269-275. h ttps://doi.org/10.1042/bj3140269 ) ( P orter, J. L., Fordtran, J . S., Santa Ana, C . A. , Emmett, M., H agey, L. R ., Macdonald,E.A., & Hofmann,A. F. ( 2003). Accurate enzymatic mea-surement of fecal b i le acids in p atients with m a labsorption. Jo u rnal of L aboratory and C l inical Medicine, 1 4 1(6), 4 1 1-418. ht t ps://doi. org/10.1016/S0022-2143(03)00040-4 ) ( Richard, N ., Colen, R., & Aragao, C. (2017). S upplementing ta u rine to plant-based diets improves l i pid d igestive capacity and amino acid re- tention of Senegalese sole (Solea senegalensis) juveniles. Aquaculture, 468,94-101. https://doi.org/10.1016/j.aquaculture.2016.09.050 ) ( Romarheim, O . H., S k rede, A . , P e nn, M., Mydland, L. T., K r ogdahl, A . , & Storebakken,T.( 2 008). Lipid digestibility, bile drainage and d e velopment of morphological i n testinal c hanges in rainbow tr o ut (Oncorhynchus my-kiss) fed diets containing defatted soybean m e al. A q uaculture,274(2-4), 329-338.https://doi.org/10.1016/j.aquaculture.2007.11.035 ) ( Russell, D. W.( 2 009). F i fty years o f advances in bile acid s y nthesis and metabolism. J ournal of Lipid Research , 50(Supplement), S120-125. https://doi.org/10.1194/jlr.R800026-JLR200 ) ( S chrama,J. W.,Saravanan,S., Geurden, I., Heinsbroek, L. T., Kaus h ik, S. J., & Verreth, J.A. (2012). Dietary n u trient composition affects digest-ible energy utilisation for growth: A s tudy on Nile tilapia (Oreochromis niloticus) and a l iterature comparison ac r oss fish species. BritischJournal of Nutrition, 108(2), 277-289. https://doi.org/10.1017/S0007 114511005654 ) ( Shi, J., Arunasalam, K ., Yeung, D ., K akuda, Y . , M i ttal, G ., & J i ang, Y.(2004). Saponins from e dible legumes: Chemistry, processing, andhealth benefits. J ournal o f M edicinal Food, 7(1), 6 7-78. https://doi. org/10.1089/109662004322984734 ) ( Sinha, A. K ., Kumar, V., Makkar, H. P . , De Boeck, G.,& B ecker, K.(2011).Non-starch polysaccharides and their role in f ish nutrition-A review. Food Chemistry, 1 27(4), 1409-1426. https://doi.org/10.1016/j.foodc hem.2011.02.042 ) ( Storebakken,T. (1985). Binders in fish feeds: 1. Effect of alginate and guar gum on growth, d i gestibility, feed intak e and passage through the gastrointestinal t ract o f r ainbow tr o ut. Aq u aculture, 47( 1 ), 11-26. https://doi.org/10.1016/0044-8486(85)90004-3 ) ( T ocher, D. R.( 2 003). Metabolism and func t ions of lipids and fatty acid s in t eleost f ish. Reviews in Fisheries S cience, 1 1(2), 1 07-184. https://doi.org/10.1080/713610925 ) Walters,R. L., Baird,I. M., Davies, P. S., Hill,M. J.,Drasar,B. S.,Southgate,D. A., ... Morgan, B. (1975). Effects of two types of dietary fibre onfaecal steroid and lipid excretion. British Medical Journal, 2(5970),536-538. https://doi.org/10.1136/bmj.2.5970.536 Windell, J. T., Foltz, J. W., & Sarokon, J. A. (1978). Effect of fish size,temperature, and amount fed on nutrient digestibility of a pelleteddiet by rainbow trout, Salmo Gairdneri. Transactions of the AmericanFisheries Society, 107(4),613-616. https://doi.org/10.1577/1548-8659(1978)107<613:EOFSTA>2.0.CO;2 SUPPORTING INFORMATION Additional supporting information may be found online in theSupporting Information section. 本研究以虹鳟为研究对象,探讨其饲料组成饲喂水平影响粪便胆汁酸的流失,是否反映在脂肪的表观消化率(ADC)上。六种材料被配制成鱼粉或植物蛋白做为饲料中主要蛋白质来源。这在源头上形成了对比,胆汁酸,胆汁酸前体胆固醇,牛磺酸和牛磺酸前体(蛋氨酸+半胱氨酸)参与胆汁酸结合。对于两种蛋白质来源,其中三种饲料中添加了更多的非淀粉多糖(NSP)-富含成分的混合物(0.0、82.0和164.2 g/kg饮食)。这是为了增强粪便胆汁酸流失。限制性地(1.2%BW/天)喂鱼并达到饱腹状态。当用植物蛋白混合物代替鱼粉时发现了类似的脂肪ADC,表明胆汁酸、胆固醇、牛磺酸、蛋氨酸和植物性饮食中的半胱氨酸并没有限制脂肪的消化。然而,只有在饱食期间,粪便胆汁酸的损失随日粮NSP水平的升高而增加,而且大多数情况下特别适合以鱼粉为基础的鱼类。增强的粪便胆汁酸流失没有由NSP胆汁酸结合/包埋引起,但由粪便产生量增加引起。在饱食期,脂肪ADC与粪便胆汁酸的损失呈负相关。由此得出结论,胆汁酸的有效性/合成可能成为虹鳟鱼在促进粪便胆汁酸流失(即膳食NSP水平和喂养水平)。
关闭-
1/12
-
2/12
还剩10页未读,是否继续阅读?
继续免费阅读全文产品配置单
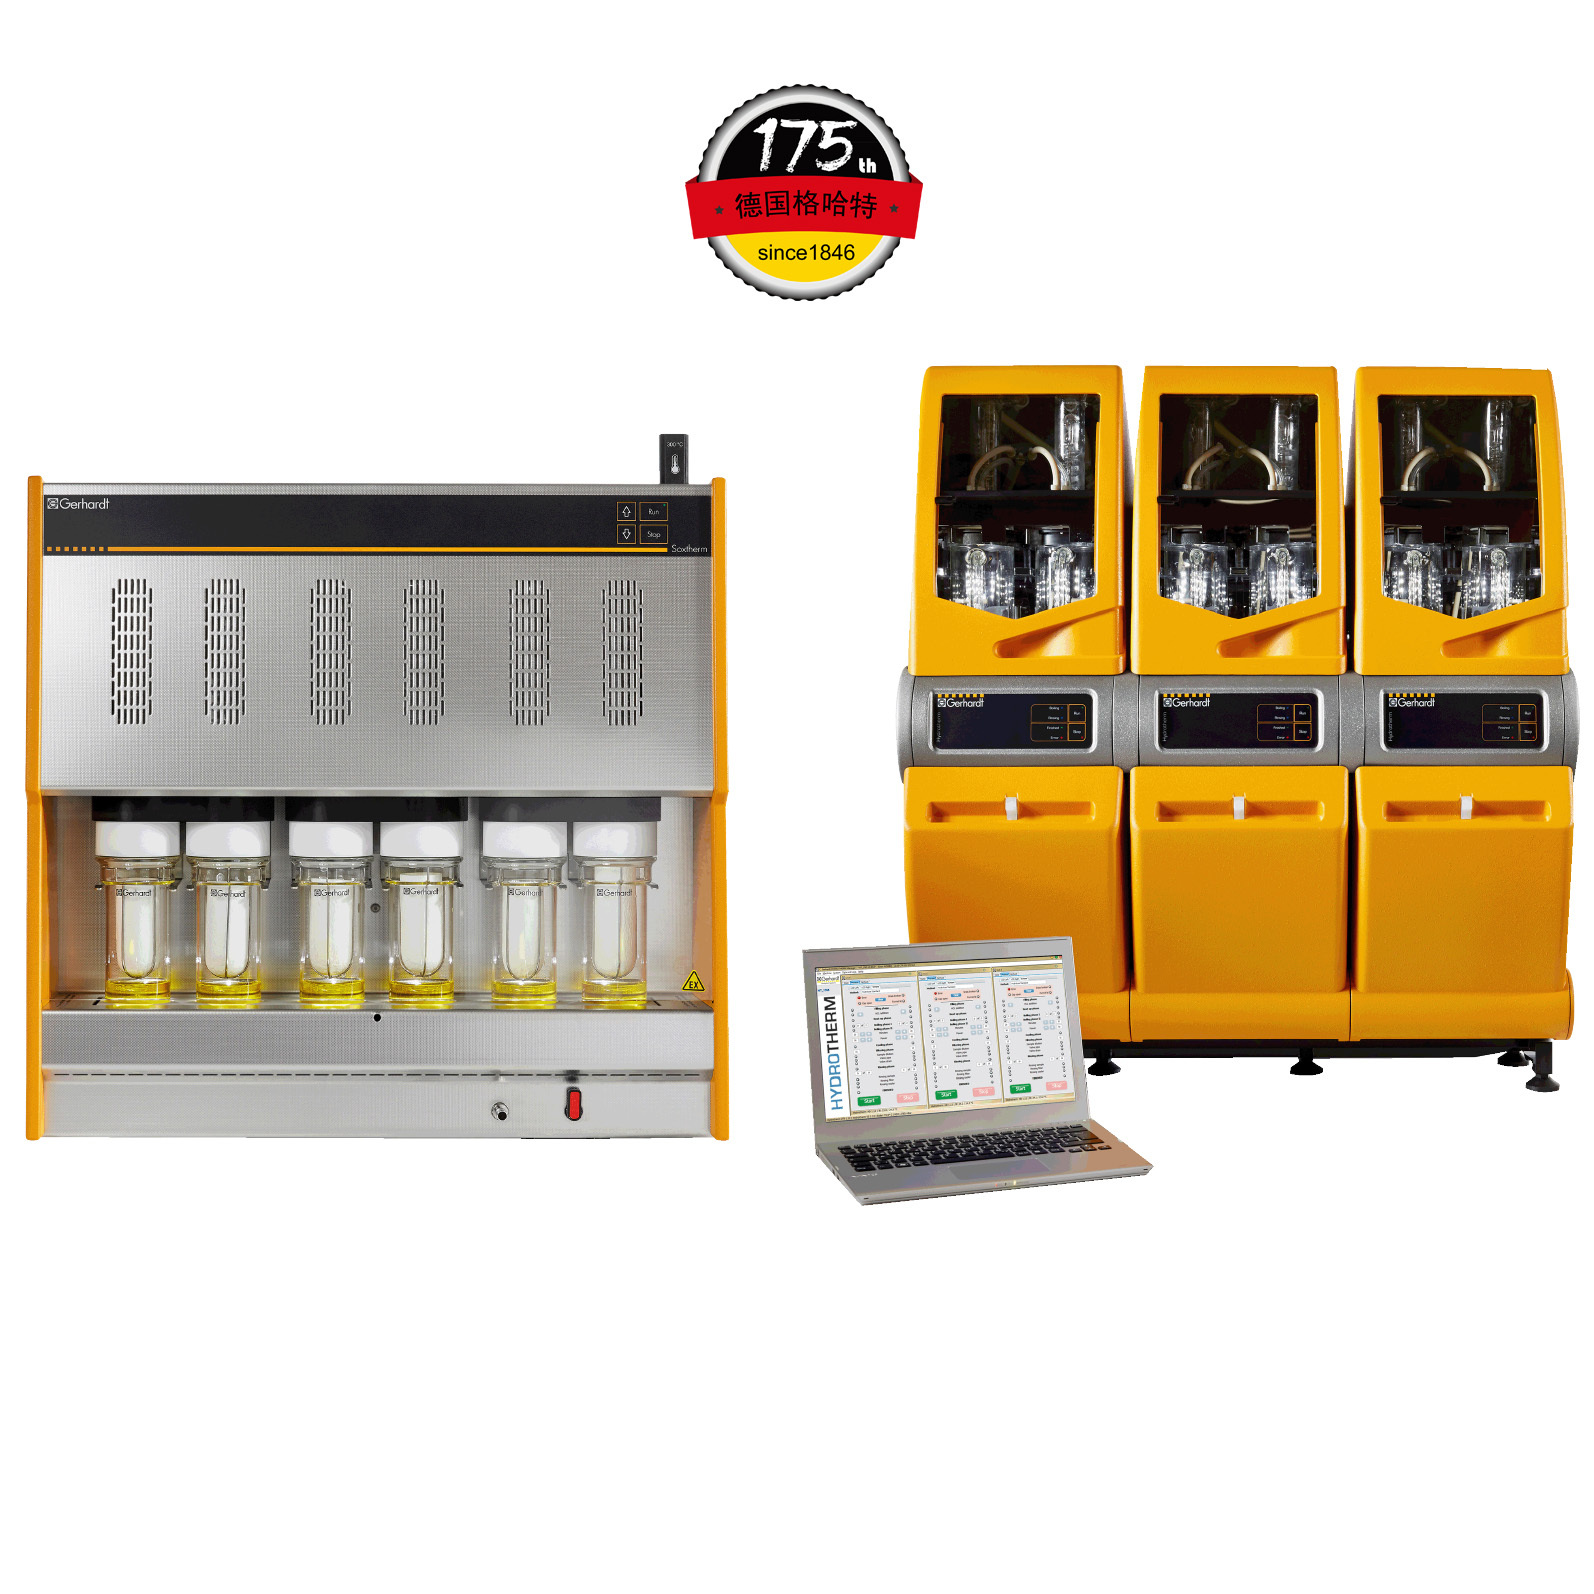

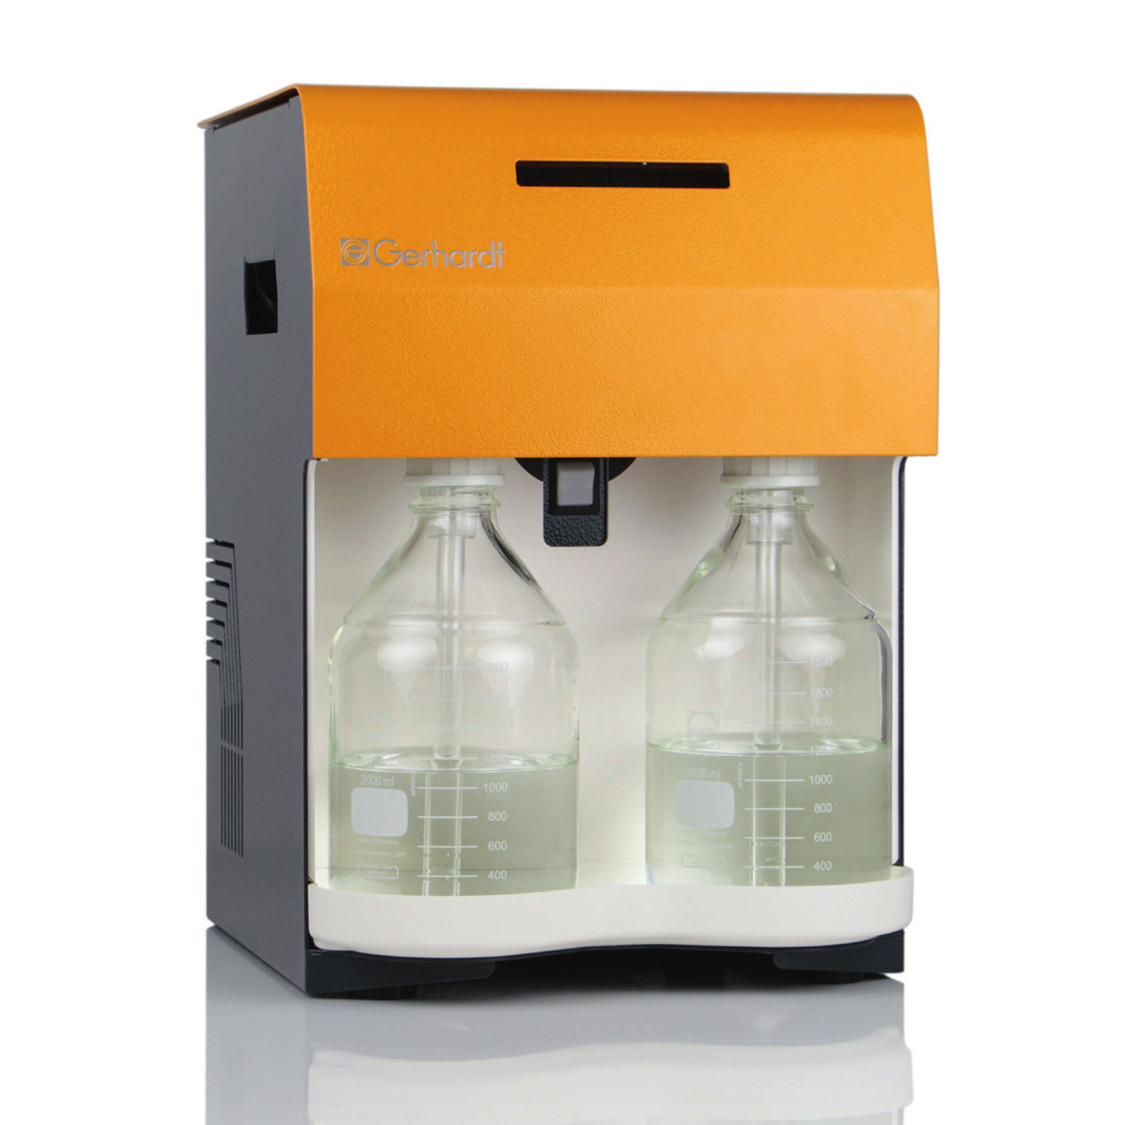
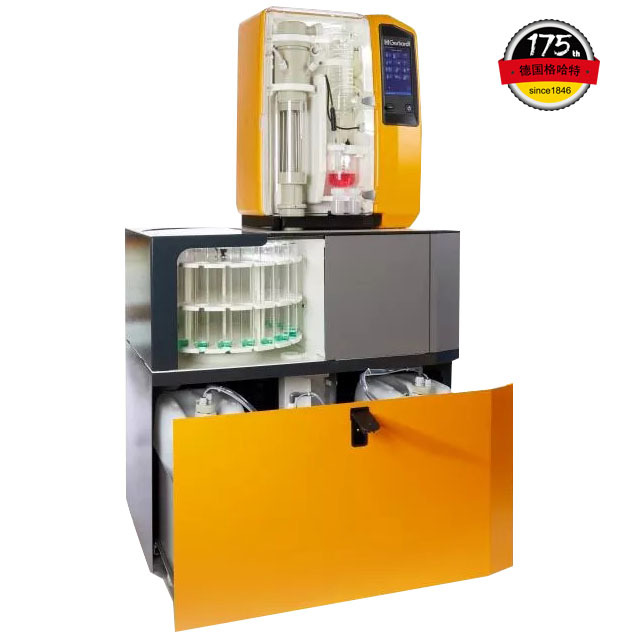
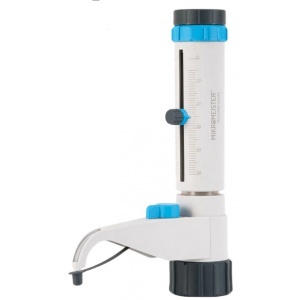
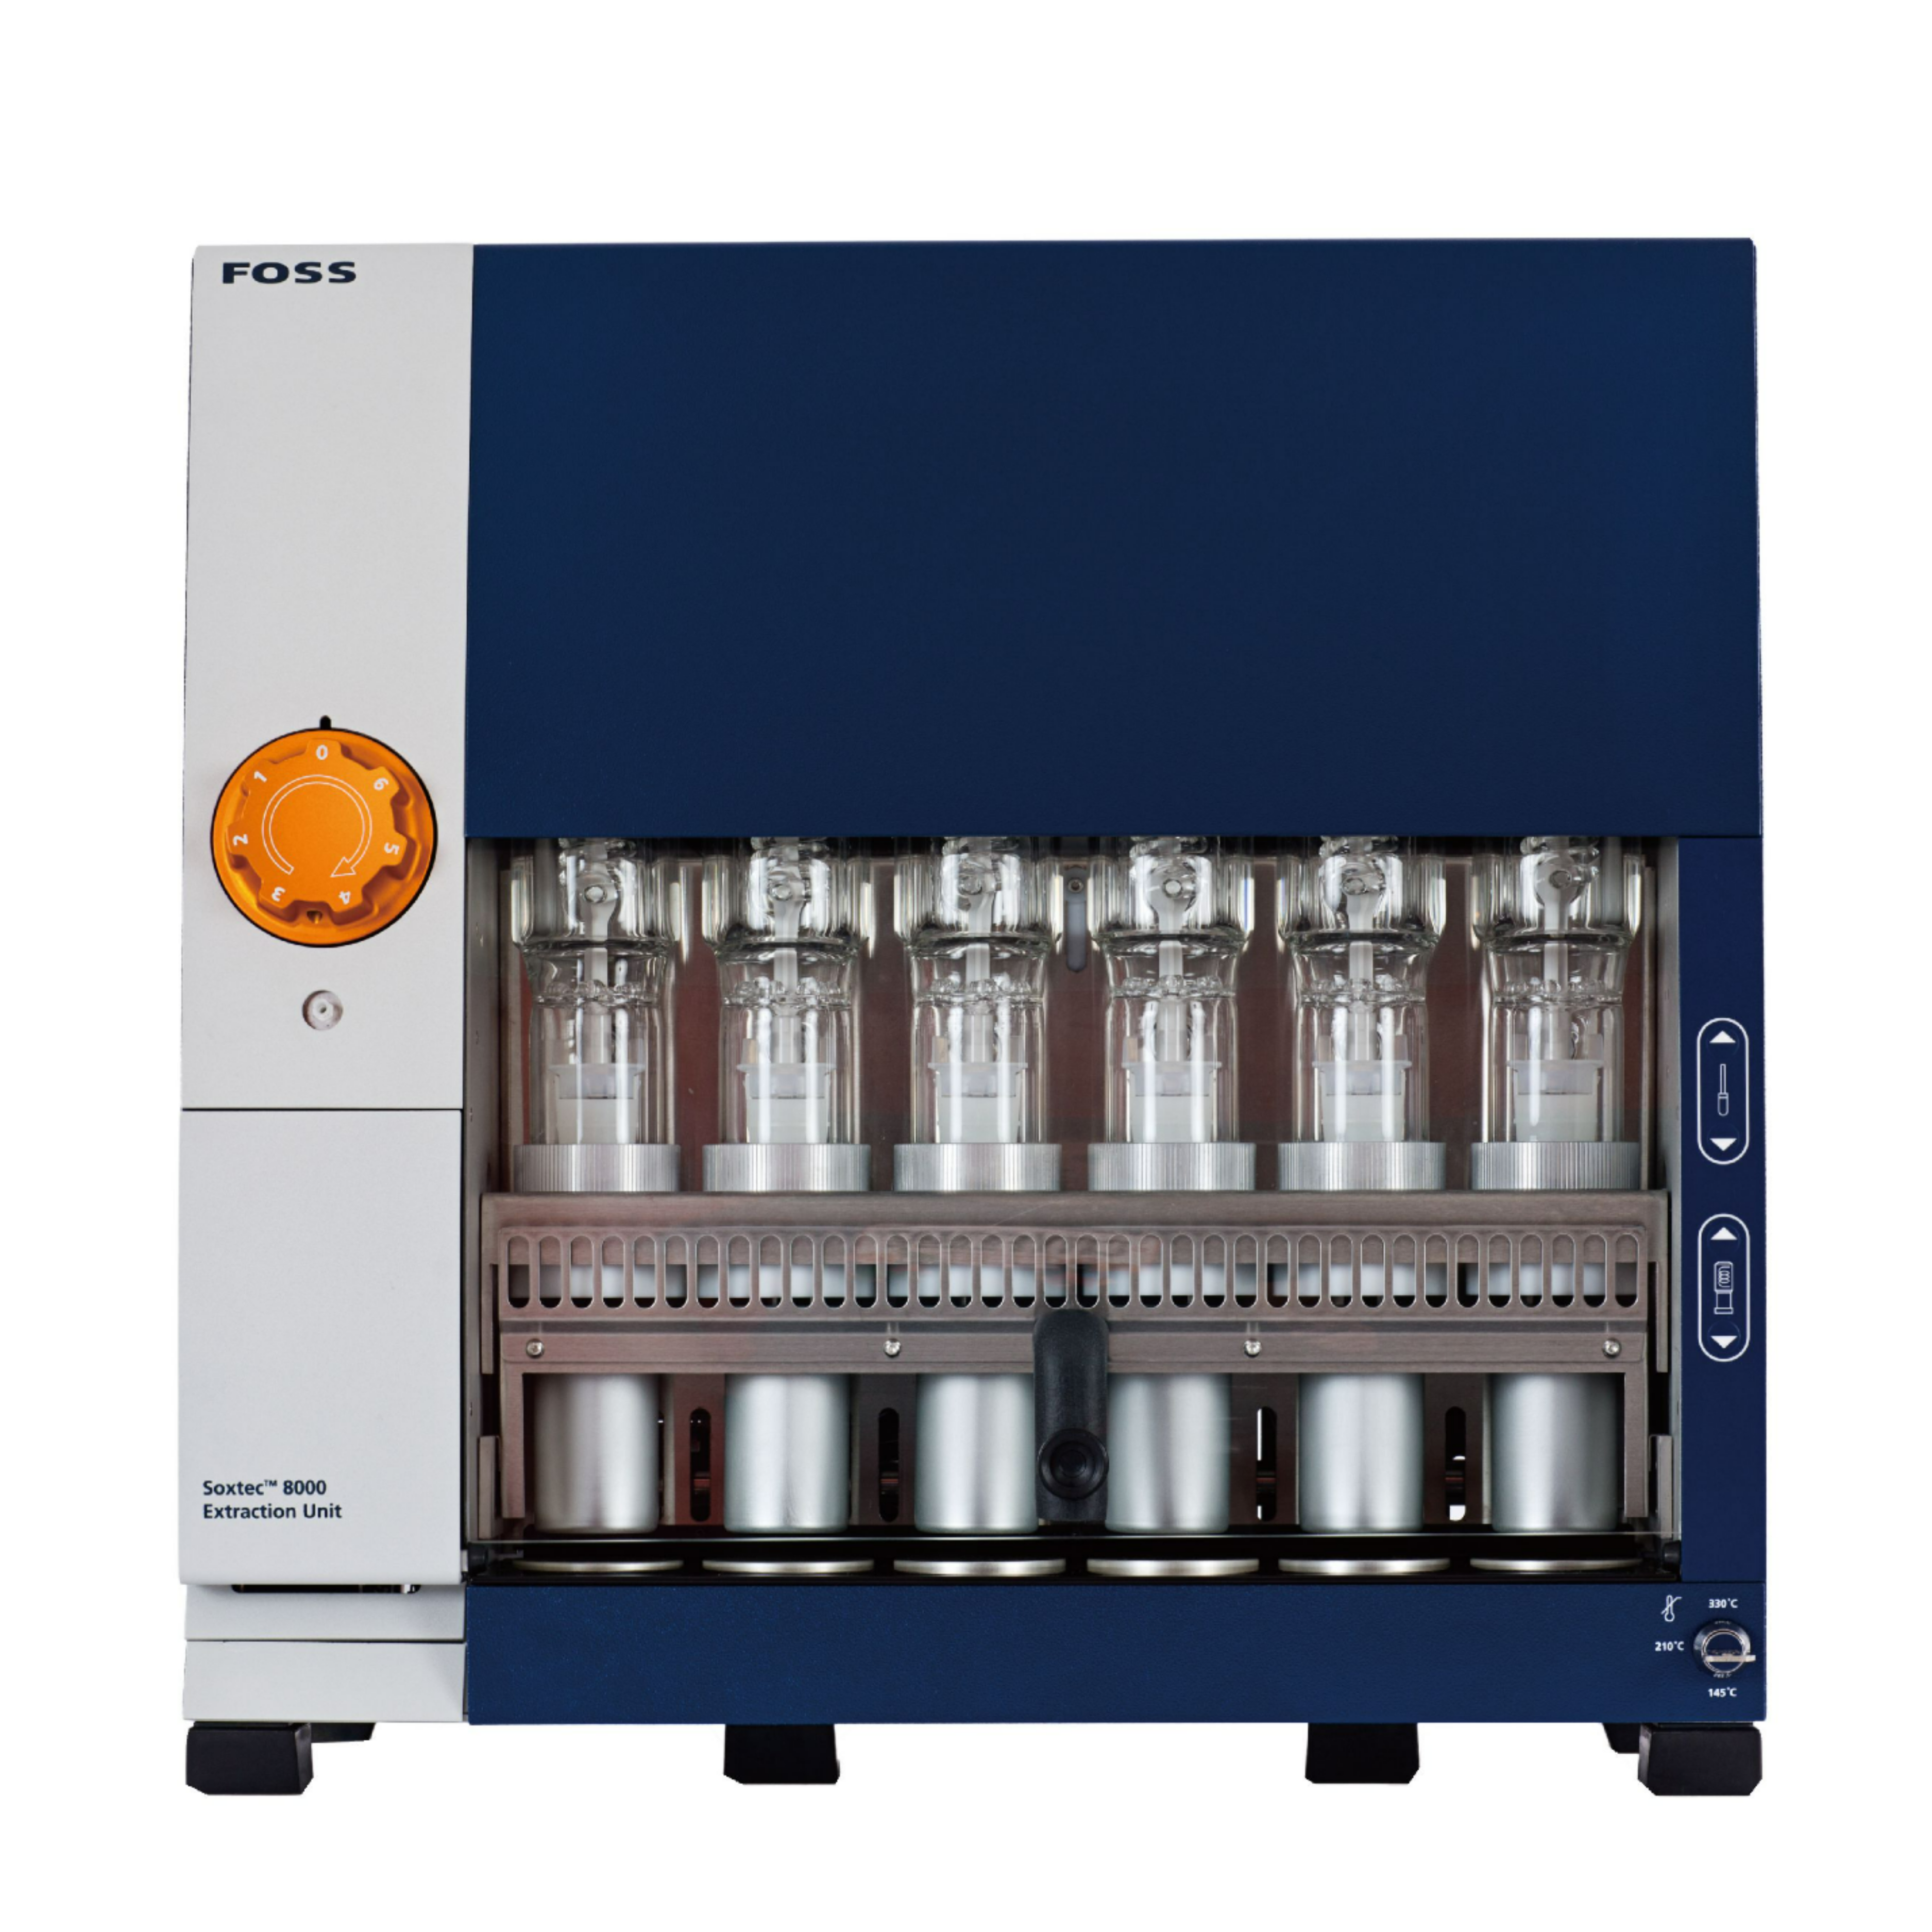
中国格哈特为您提供《虹鳟鱼排泄物中总脂肪检测方案(抽提萃取)》,该方案主要用于渔业中营养成分检测,参考标准《暂无》,《虹鳟鱼排泄物中总脂肪检测方案(抽提萃取)》用到的仪器有格哈特全自动超级总脂肪测定系统HT6+SOX416、格哈特凯氏消化系统KT8S、格哈特维克松废气实验室废物处理系统涤气VS、格哈特带自动进样器凯氏定氮仪VAP500C、德国移液器MM。
我要纠错


相关方案
 咨询
咨询