

方案详情文
智能文字提取功能测试中
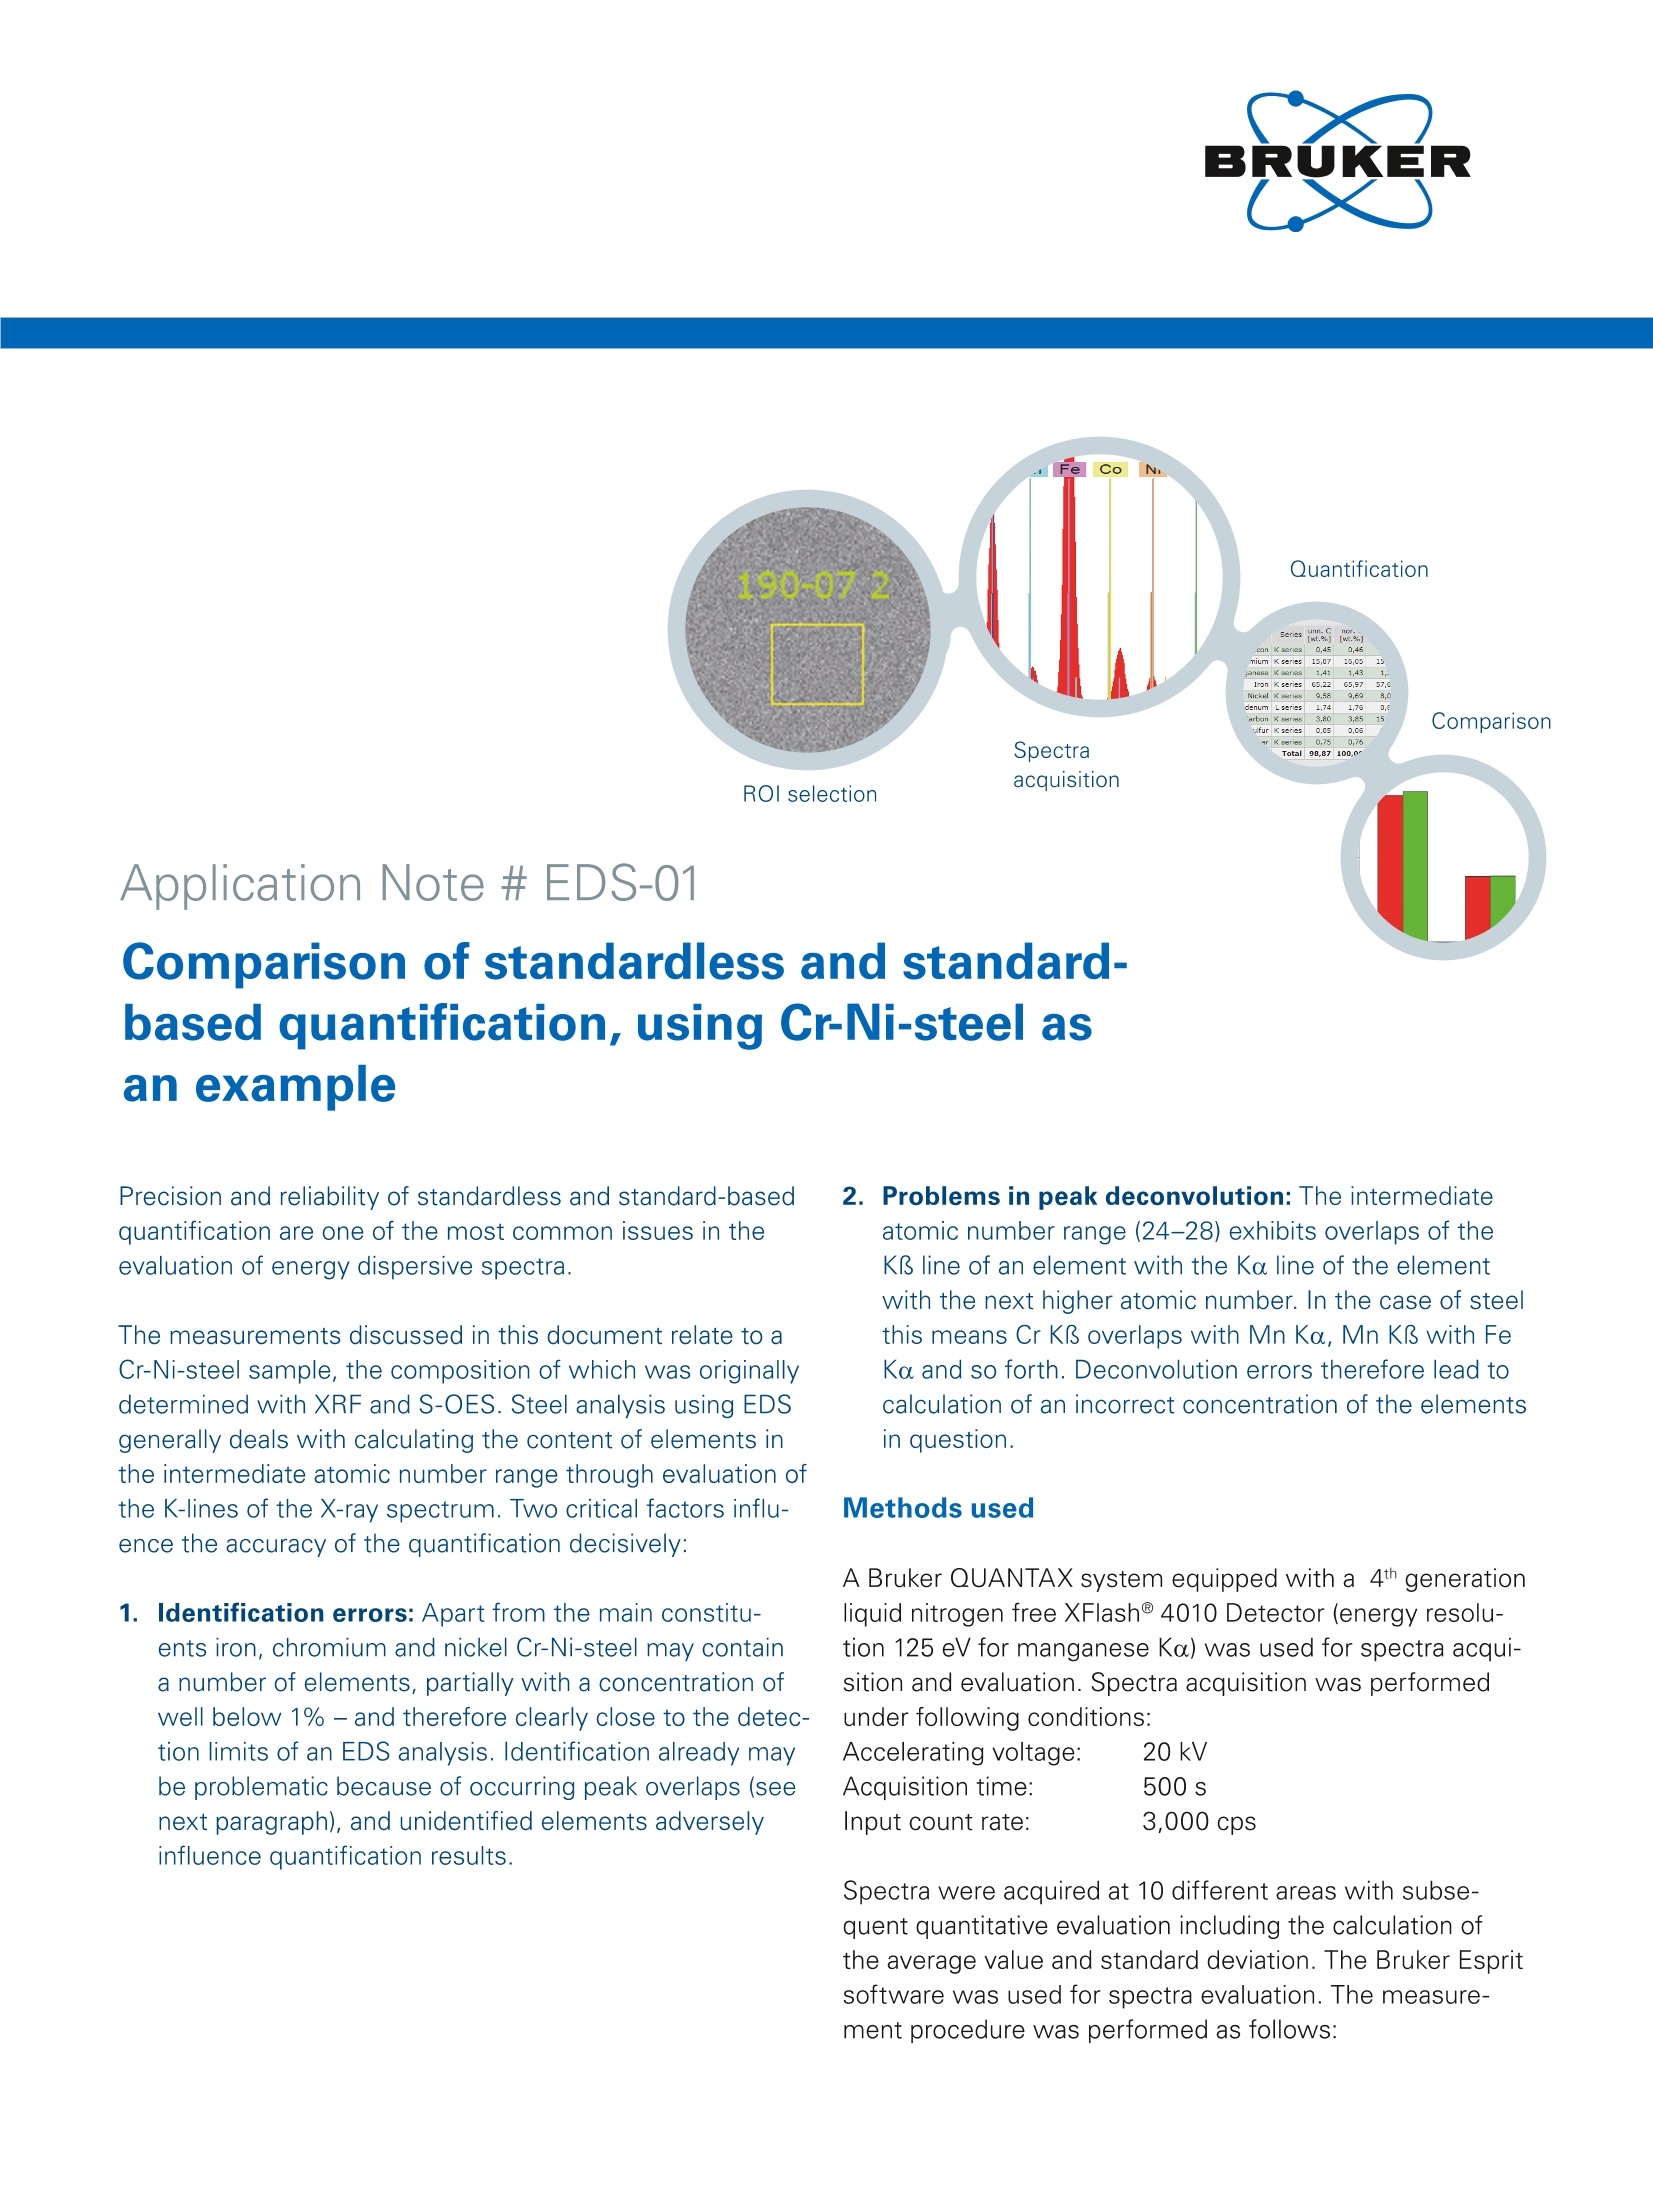
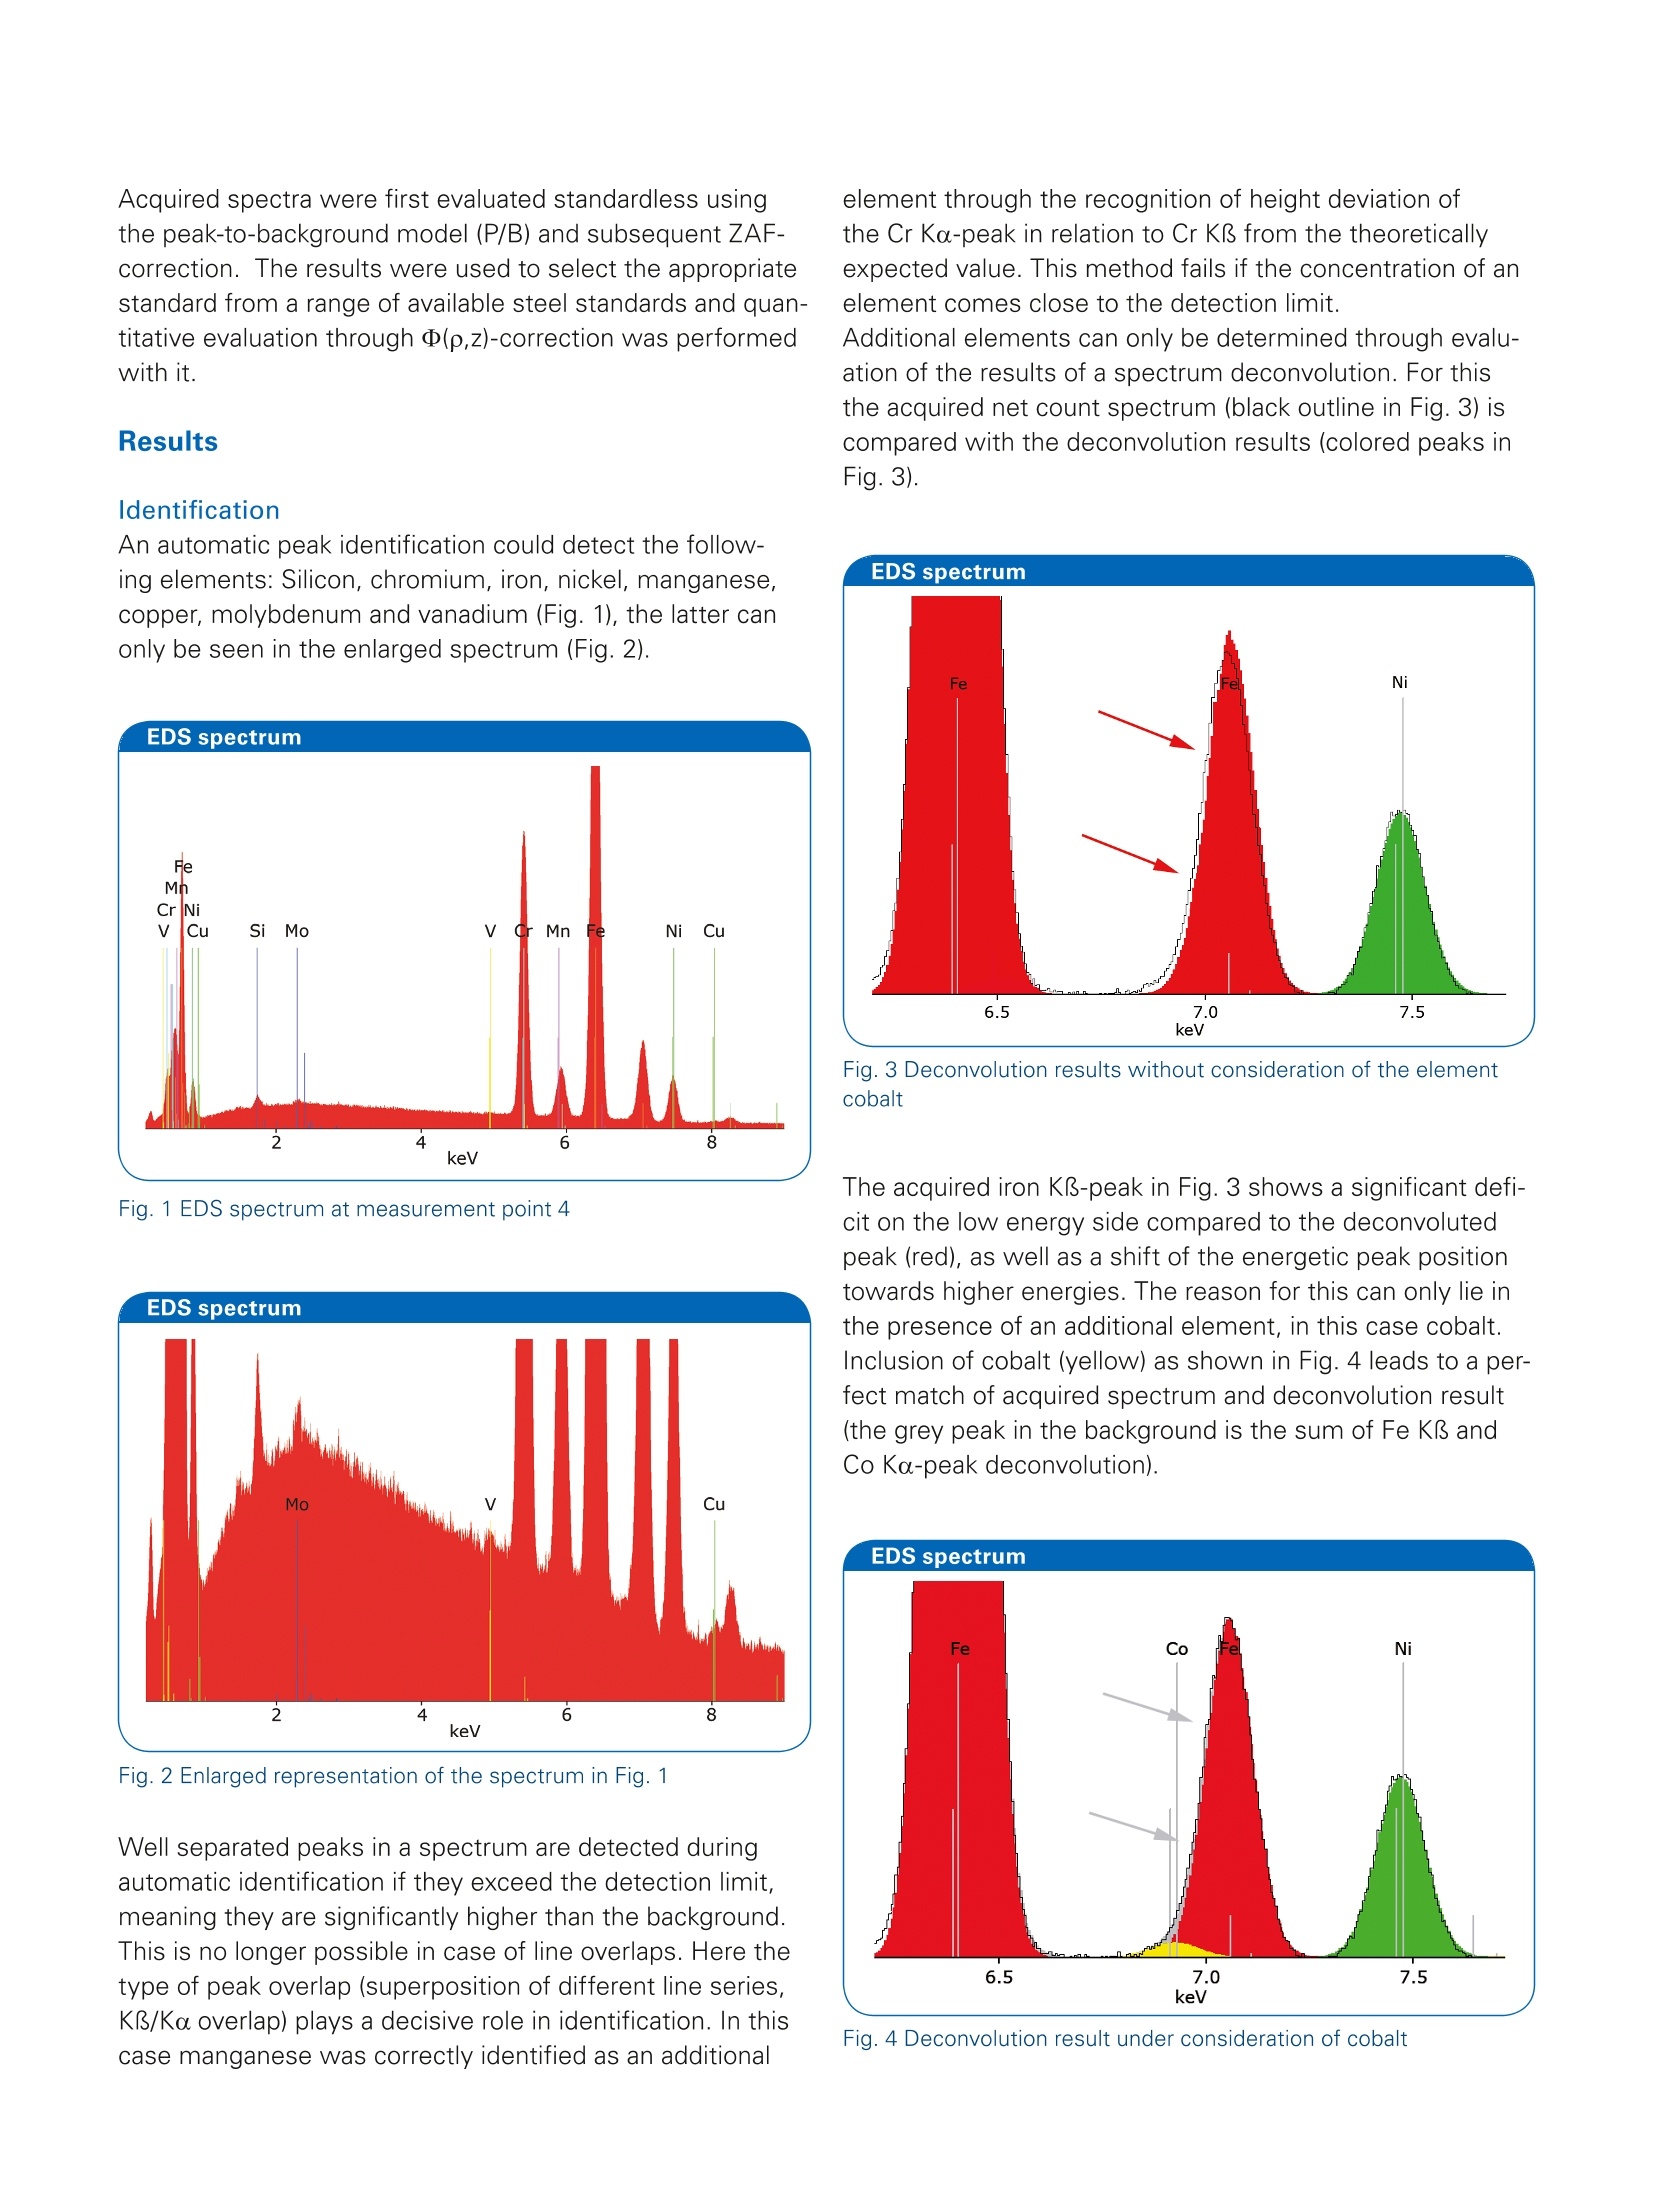
Quantitative Evaluationwww.bruker.com/quantax-eds-for-sem ROI selection Application Note # EDS-01 Comparison of standardless and standard-based quantification, using Cr-Ni-steel asan example The measurements discussed in this document relate to aCr-Ni-steel sample, the composition of which was originallydetermined with XRF and S-OES. Steel analysis using EDSgenerally deals with calculating the content of elements inthe intermediate atomic number range through evaluation ofthe K-lines of the X-ray spectrum. Two critical factors influ-ence the accuracy of the quantification decisively: 1. Identification errors: Apart from the main constitu-ents iron, chromium and nickel Cr-Ni-steel may containa number of elements, partially with a concentration ofwell below 1% - and therefore clearly close to the detec-tion limits of an EDS analysis.Identification already maybe problematic because of occurring peak overlaps (seenext paragraph), and unidentified elements adverselyinfluence quantification results. 2. Problems in peak deconvolution: The intermediateatomic number range (24-28) exhibits overlaps of theKB line of an element with the Ko line of the elementwith the next higher atomic number. In the case of steelthis means Cr KB overlaps with Mn Ka, Mn KB with FeKa and so forth.Deconvolution errors therefore lead tocalculation of an incorrect concentration of the elementsin question. Methods used A Bruker QUANTAX system equipped with a 4th generationliquid nitrogen free XFlash@ 4010 Detector (energy resolu-tion 125 eV for manganese Ka) was used for spectra acqui-sition and evaluation. Spectra acquisition was performed under following conditions: Accelerating voltage: 20 kV Acquisition time: 500 s Input count rate: 3,000 cps Spectra were acquired at 10 different areas with subse-quent quantitative evaluation including the calculation ofthe average value and standard deviation. The Bruker Espritsoftware was used for spectra evaluation. The measure-ment procedure was performed as follows: Acquired spectra were first evaluated standardless usingthe peak-to-background model (P/B) and subsequent ZAF-correction. The results were used to select the appropriatestandard from a range of available steel standards and quan-titative evaluation through (p,z)-correction was performedwith it. Results Identification An automatic peak identification could detect the follow-ing elements: Silicon, chromium, iron, nickel, manganese,copper, molybdenum and vanadium (Fig. 1), the latter canonly be seen in the enlarged spectrum (Fig. 2). Fig. 1 EDS spectrum at measurement point 4 Fig. 2 Enlarged representation of the spectrum in Fig. 1 Well separated peaks in a spectrum are detected duringautomatic identification if they exceed the detection limit,meaning they are significantly higher than the background.This is no longer possible in case of line overlaps. Here thetype of peak overlap (superposition of different line series,KB/Ka overlap) plays a decisive role in identification. In thiscase manganese was correctly identified as an additional element through the recognition of height deviation ofthe Cr Ko-peak in relation to Cr KB from the theoreticallyexpected value. This method fails if the concentration of anelement comes close to the detection limit.Additional elements can only be determined through evalu-ation of the results of a spectrum deconvolution. For thisthe acquired net count spectrum (black outline in Fig. 3) iscompared with the deconvolution results (colored peaks inFig.3). Fig. 3 Deconvolution results without consideration of the elementcobalt The acquired iron KB-peak in Fig. 3 shows a significant defi-cit on the low energy side compared to the deconvolutedpeak (red), as well as a shift of the energetic peak positiontowards higher energies. The reason for this can only lie inthe presence of an additional element, in this case cobalt.Inclusion of cobalt (yellow) as shown in Fig. 4leads to a per-fect match of acquired spectrum and deconvolution result(the grey peak in the background is the sum of Fe KB andCo Ko-peak deconvolution). Fig. 4 Deconvolution result under consideration of cobalt An adequate standard for the standard-based analysis using(p,z)-correction was selected according to the results ofthe standardless quantification (Tab.1). In case of the sample measured here the ideal conditionof an available standard containing all relevant elements,with the exception of vanadium, existed. As can be seenin Tab.2, the composition of this standard is very close tothe standardless calculated values of the specimen. The lack of vanadium in this standard was considered in thesubsequent standard-based evaluation through standardlessquantification of this element. The results of standardless and standard-based quantifica-tion (Tab. 1 and Tab. 3) are identical within the expectederror limits, with the exception of cobalt. Thereforean addi-tional standardless analysis was performed, calculating thecobalt content with a reference sample (Tab.4). Tab. 1 Standardless (P/B-ZAF) quantification Spectrum Si V Cr Mn Fe Co Ni Cu Mo Point 1 0.26 0.13 17.81 1.55 71.26 0.51 7.78 0.42 0.27 Point 2 0.26 0.11 17.36 1.58 71.31 0.71 8.09 0.31 0.27 Point 3 0.26 0.13 17.80 1.53 71.39 0.56 7.59 0.48 0.26 Point 4 0.28 0.12 18.00 1.55 71.22 0.47 7.48 0.57 0.31 Point 5 0.27 0.14 17.78 1.46 71.50 0.63 7.51 0.42 0.28 Point 6 0.26 0.13 17.97 1.55 71.25 0.56 7.61 0.39 0.29 Point 7 0.25 0.14 17.81 1.52 71.41 0.52 7.57 0.47 0.31 Point 8 0.29 0.15 17.41 1.56 71.26 0.62 8.04 0.38 0.29 Point 9 0.28 0.14 17.71 1.56 71.45 0.59 7.70 0.26 0.32 Point 10 0.27 0.12 17.91 1.54 71.15 0.50 7.64 0.54 0.33 Average 0.27 0.13 17.75 1.54 71.32 0.57 7.70 0.42 0.29 o(±wt.%) 0.01 0.01 0.22 0.03 0.11 0.07 0.21 0.10 0.02 Tab.2 Composition of the standard ACX-P07/97 Standard N Si Cr Mn Fe Co Ni Cu Mo AXC-P07/97 0.06 0.32 18.35 1.38 70.61 0.12 8.13 0.43 0.29 Tab. 3 Standard-based quantification (D(p,z)-correction) Spectrum Si V Cr Mn Fe Co Ni Cu Mo Point 1 0.32 0.12 18.22 1.52 70.78 0.11 8.26 0.38 0.29 Point 2 0.33 0.11 18.29 1.56 70.73 0.15 8.24 0.29 0.30 Point 3 0.31 0.13 18.24 1.50 71.02 0.12 7.99 0.42 0.27 Point 4 0.33 0.11 18.18 1.51 70.92 0.10 8.05 0.48 0.31 Point 5 0.33 0.13 18.27 1.44 71.12 0.14 7.90 0.37 0.30 Point 6 0.31 0.13 18.34 1.52 70.93 0.12 8.01 0.34 0.30 Point 7 0.30 0.14 18.25 1.49 71.04 0.11 7.95 0.40 0.32 Point 8 0.36 0.14 18.19 1.54 70.68 0.13 8.27 0.36 0.32 Point 9 0.34 0.13 18.33 1.54 70.97 0.13 7.99 0.25 0.34 Point 10 0.33 0.11 18.36 1.51 70.80 0.11 7.99 0.46 0.34 Average 0.33 0.13 18.27 1.51 70.90 0.12 8.07 0.37 0.31 o(±wt.%) 0.02 0.01 0.06 0.03 0.15 0.01 0.14 0.07 0.02 Spectrum Si Cr Mn Fe Co Ni Cu Mo Point 1 0.27 0.13 17.88 1.56 71.55 0.11 7.82 0.42 0.27 Point 2 0.26 0.11 17.45 1.59 71.71 0.15 8.14 0.31 0.28 Point 3 0.26 0.13 17.88 1.54 71.70 0.12 7.63 0.49 0.26 Point 4 0.28 0.12 18.06 1.56 71.49 0.10 7.51 0.58 0.31 Point 5 0.27 0.14 17.87 1.48 71.85 0.14 7.55 0.42 0.28 Point 6 0.26 0.13 18.05 1.56 71.56 0.12 7.64 0.39 0.29 Point 7 0.25 0.14 17.88 1.53 71.70 0.11 7.60 0.47 0.31 Point 8 0.29 0.15 17.50 1.57 71.60 0.13 8.08 0.38 0.29 Point 9 0.28 0.14 17.79 1.57 71.78 0.13 7.74 0.26 0.32 Point 10 0.27 0.12 17.97 1.55 71.43 0.11 7.68 0.54 0.33 Average 0.27 0.13 17.83 1.55 71.64 0.12 7.74 0.43 0.29 o(±wt.%) 0.01 0.01 0.21 0.03 0.13 0.02 0.21 0.10 0.02 Tab.5 Comparison of standardless (Co-reference) and standard-based analysis with composition obtained through S-OES and XRF Method Si Cr Mn Fe Co Ni Cu Mo P/B-ZAF,refer- 0.27 0.13 17.83 1.55 71.64 0.12 7.74 0.43 0.29 ence for cobalt D(p,z) standard- 0.33 0.13 18.27 1.51 70.90 0.12 8.07 0.37 0.31 based Comparison 0.33 0.09 18.30 1.61 70.56 0.14 8.13 0.37 0.29 S-OES, XRF Conclusions 1. In many cases automatic element ID is insufficient,especially when peak overlaps with elements of lowconcentration exist. In this case a powerful spectradeconvolution tool in combination with a detector ofexcellent resolution is an absolute necessity to producereliable results. c) Standard-based quantification for highest accuracy.If necessary, the hybrid method - as offered byQUANTAX- can be used in case of missingstandards for specific elements, these elementscan then be quantified standardless. 2.The procedure discussed in this paper proves a practicalapproach to quantitative analysis: 3. Standardless P/B-ZAF analysis can be further optimizedthrough references for critical elements. This is alsouseful for the analysis of rough surfaces. Initial standardless quantification Use of the results for selection of an appropriatestandard ( S ample court e sy of ACERINOX S.A. , Los Barrios (CADIZ), Sp a in . ) Bruker Nano GmbH Berlin·GermanyPhone +49 (30)670990-0Fax +49 (30) 670990-30 info.bna@bruker.com The measurements discussed in this document relate to aCr-Ni-steel sample, the composition of which was originallydetermined with XRF and S-OES. Steel analysis using EDSgenerally deals with calculating the content of elements inthe intermediate atomic number range through evaluation ofthe K-lines of the X-ray spectrum.
关闭-
1/4
-
2/4
还剩2页未读,是否继续阅读?
继续免费阅读全文产品配置单

布鲁克电子显微纳米分析仪器部为您提供《Cr-Ni钢中元素含量检测方案(X射线能谱仪)》,该方案主要用于粗钢中含量分析检测,参考标准《暂无》,《Cr-Ni钢中元素含量检测方案(X射线能谱仪)》用到的仪器有布鲁克 , EDS, 能谱仪, SEM, TEM、布鲁克 QUANTAX EDS 能谱仪(TEM)、布鲁克3D EDS/EBSD重构软件QUBE。
我要纠错
推荐专场
相关方案
 咨询
咨询