Up-Conversion Phosphors的量子产率测量
检测样品 稀土材料
检测项目 稀土元素、荧光,上转换,量子产率,近红外


方案详情文
智能文字提取功能测试中
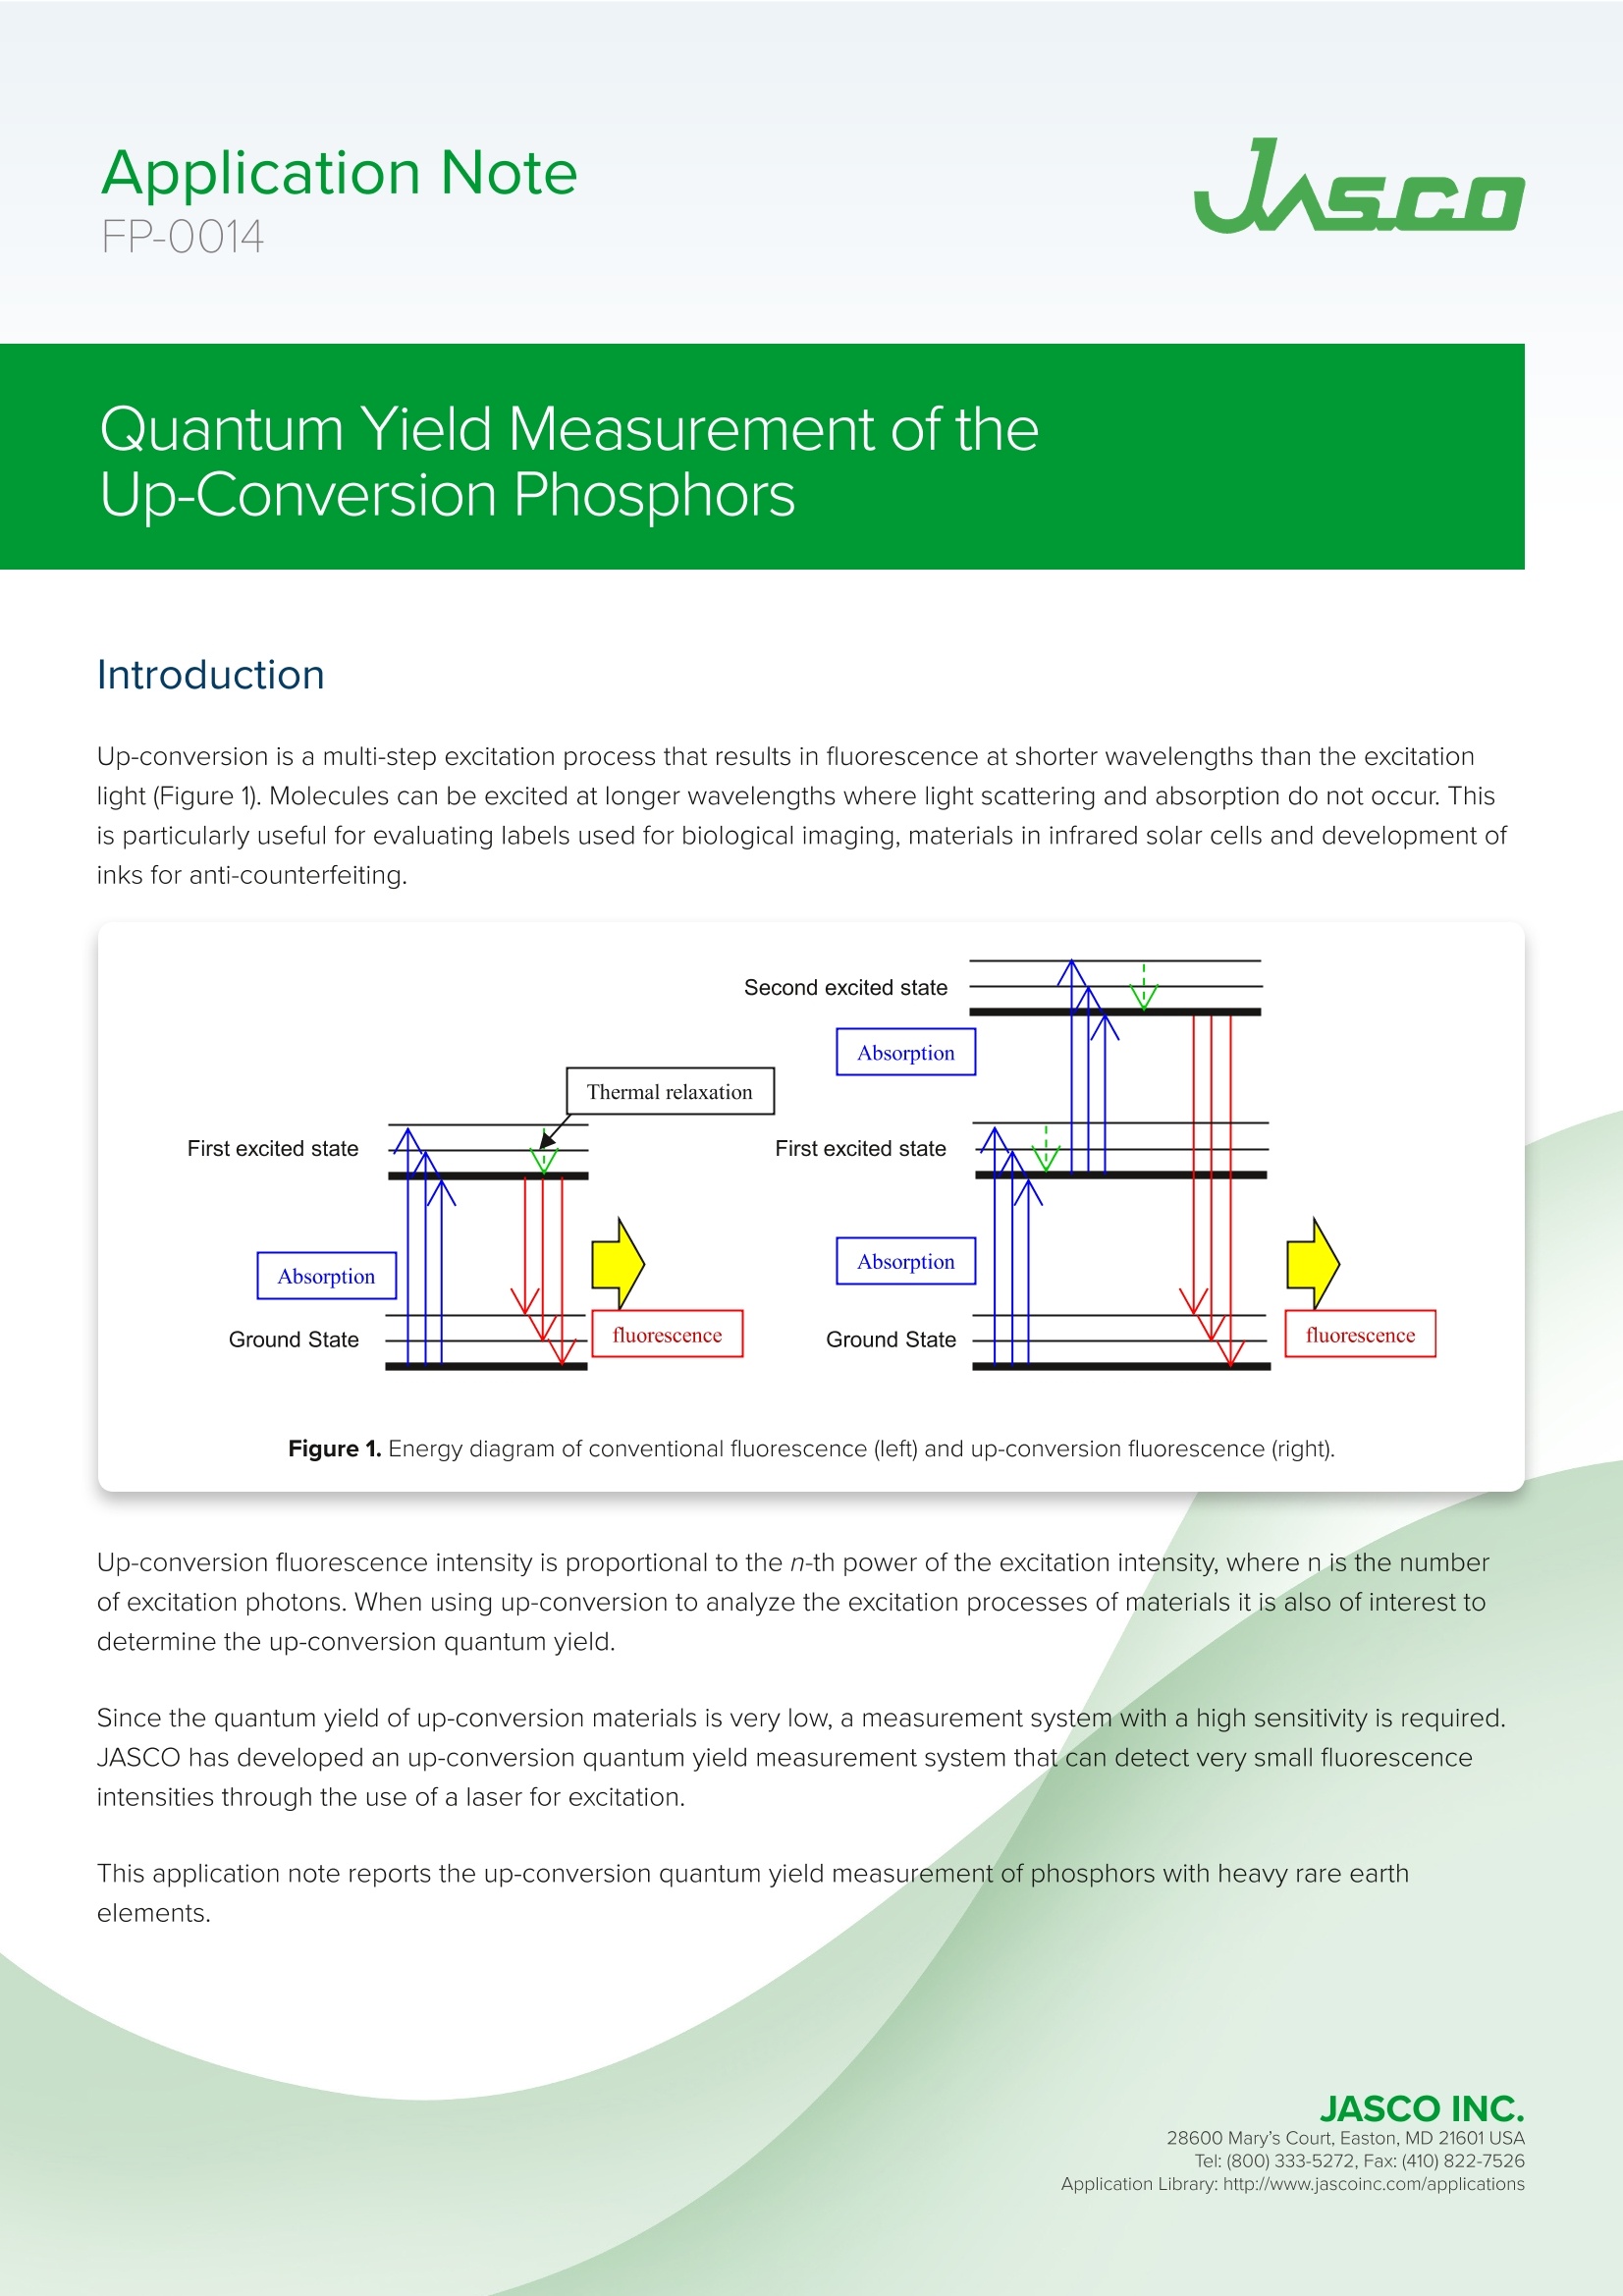
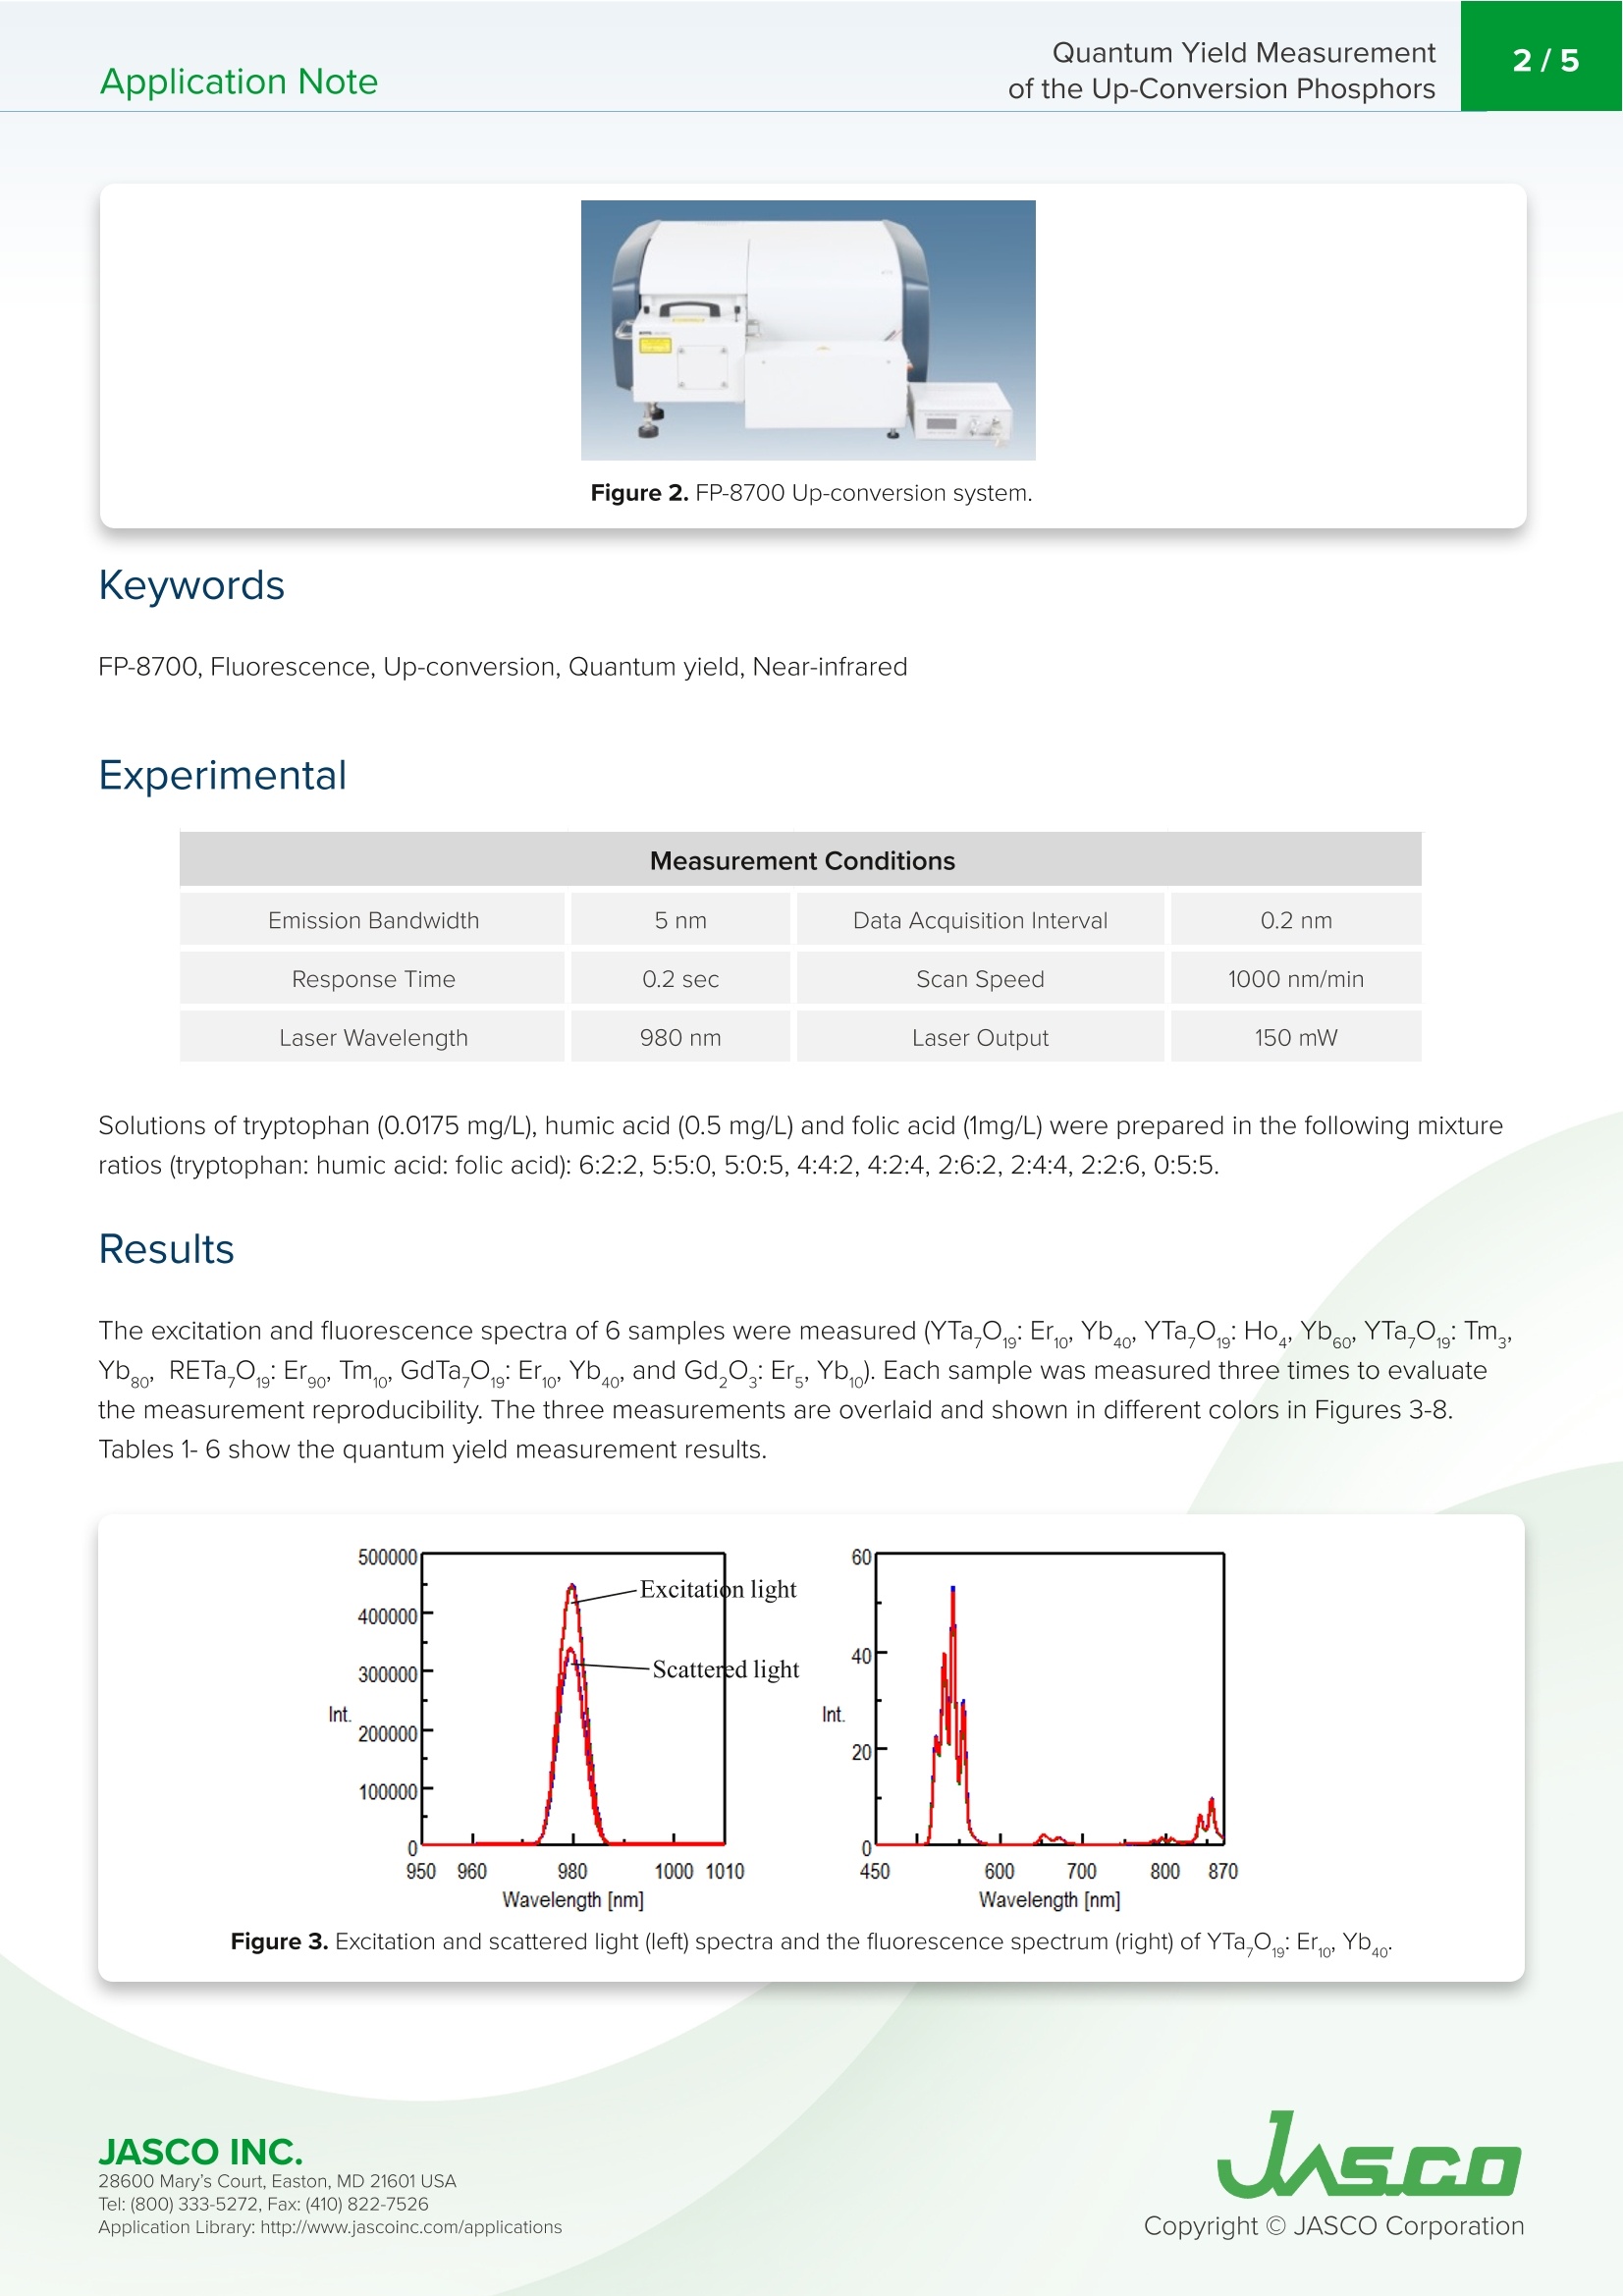
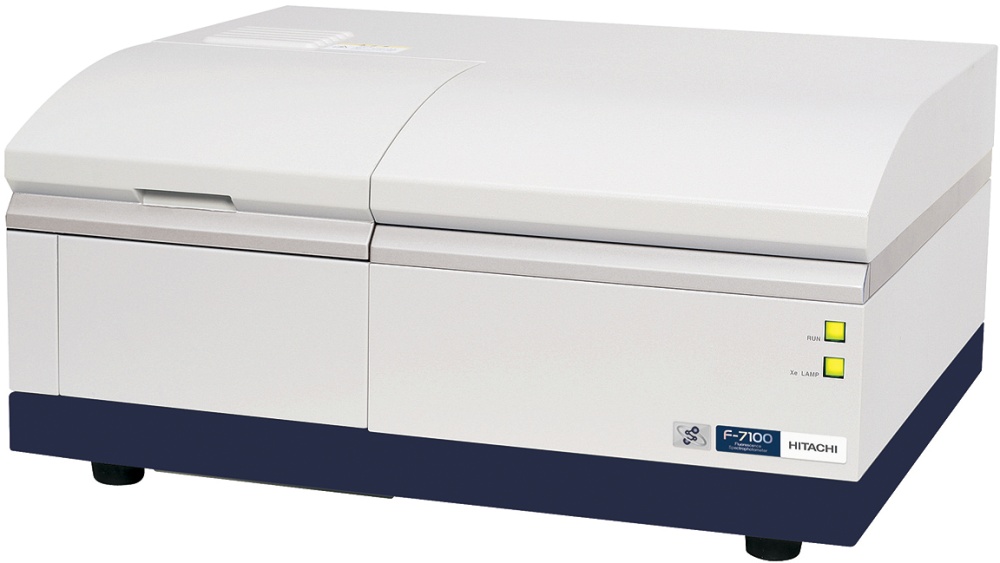
上转换是一个多步骤的激发过程,产生的荧光波长比激发光短(图1)。分子可以在不发生光散射和吸收的较长波长下被激发。这对于评估用于生物成像、红外太阳能电池材料和防伪油墨开发的标签特别有用。上转换荧光强度与激发强度的n次方成比例,其中n是激发光子的数量。当使用上转换来分析材料的激发过程时,确定上转换量子产率也是令人感兴趣的。由于上转换材料的量子产率非常低,因此需要具有高灵敏度的测量系统。JASCO开发了一种上转换量子产率测量系统,可以通过使用激光激发来检测非常小的荧光强度。Application NoteFP-0014 Quantum Yield Measurementof the Up-Conversion Phosphors2/5Application Note Quantum Yield Measurement of the Up-Conversion Phosphor s Introdu c tion Up-conversion is a mul t i -step exc i tation process t h a t results i n f luorescence a t shorter wavelengths than the excitation li g h t (Figu r e 1). Molecules can be excited at longer wavelengths where l ight scattering and abso r ption do not occu r . This i s particu l arly u seful for evaluating l abels used for biological im aging, mater i als i n i nf r ared solar cells a n d deve l opment of in ks for anti-cou n terfeiting . Figure 1. Energy diagram of conve n tiona l f l u oresce n ce (l ef t ) and up-conve r s i o n f lu or esce nc e (r ight). Up-conversion fluorescence in tens i ty is proport i onal to the n-t h power of the excitation intensity, where n is the number of excitat i on photons. Whe n using up-conversion to analyze the excitation processes of materials it i s also of interest to dete r mine the up-conversion quantu m yield. Si n ce t h e qua n tu m yie l d of up -conve r sion mat e r i als i s very l ow, a measurement system with a high sensit i vity is required.JASCO ha s developed an u p -conve r sion q u a n tum yield measuremen t system that can detect very small fluorescence in tensities th r ough the use of a laser for excitat i on . T h is appl i cation note report s the up-conversion quan t um yie l d measurement of phosphors with h eavy rare earth e l e m e nts. 28600 Ma r y 's C ou r t, Easton, M D 21601 US A Figure 2. FP -8700 Up -conversion syste m. K eyw o rd s FP-8700, Fluoresce n ce, Up-co n version , Quan t um y i eld, Near-infra r ed Exper i m e ntal Emission Bandwidth 5nm Data Acquisition Interval 0.2nm Response Time 0.2 sec Scan Speed 1000 nm/min Laser Wavelength 980 nm Laser Output 150mW Solut i ons of tryptophan (0.0175 m g/L), humic acid (0.5 mg/L) and folic acid (1mg/L) we r e prepared i n the following m i xture ratios (tryptophan: h umic acid: folic acid): 6:2:2,5:5:0,5:0:5,4:4:2,4:2:4,2:6:2,2:4:4,2:2:6,0:5:5. R esul t s The exci t at i on and f luorescence spec t ra of 6 sam p les were measured (YTa,o :Er,Y b a o, YTa,O:Ho,YbYTa,O ·Tm,Ybg o , RETa,Og ;Ero T mi o , GdTa,gEr.,Ybao,and GdO :Er, Yb,). Each s a mple was measu r ed t hree t i mes to evaluate the meas u rement reproducibility. The th ree measurements are over l aid a n d shown in di f ferent colors in Figures 3-8.Tables 1-6 show the quan t um yield measureme n t res u lts. Figure 3. Exc i t at i o n a n d scattered lig h t (left) s p ectra and the fl u oresce n ce spec t r u m (r i ght) of Y T a,O :Er ,Yb 28600 Mary's Cour t , E a s to n , M D 21601US A Table 1. Internal quantum yield measuremen t results of YTa,O gE r ,Y b a o Measurement 1 2 3 Area of Scattered Light 2.14-106 2.14·106 Sample Absorbance (%) Internal Quantum Yield (%) 1453.86 23.69 0.22 1378.84 21.57 0.23 1433.8 24.28 0.21 Figure 4. Excita t io n and sca t tered l i ght (left) s p ect r a and t h e fl u oresce n ce spectrum (r ight) of YTa,Og :H o ,Yb0 Table 2. Internal quantum y i e l d m eas ur eme n t r esults of Y T a,H o ,Yb o Measurement Area ofExcitation Light Area of Scattered Light 1 2.75-106 2.07.106 685000 2 2.80·106 3 Sample Absorbance (%) InternalQuantum Yield (%) 24.88 0.073 498.81 25.32 0.070 515.899 28.59 0.063 Figure 5. Excitation and scattered l i g h t (l ef t) spectra and the f l u o r esce n ce spectru m (r i g h t ) of YTa,O :Tm ,Y b g 28600 Mary's Cour t , E a s to n , M D 21601US A Table 3. I n ter n al quantum y i e l d measuremen t results of YTa,g .T m ,Y b s o Measurement Area of Excitation Light Area of Scattered Light 1 2.75-106 1.92.106 2 2.75-106 1.91-106 3 2.77-106 1.95·106 Area of Fluorescence Sample Absorbance (%) Internal Quantum Yield (%) 31500.1 30.32 3.78 32176.7 30.73 3.81 31277.2 29.55 3.82 Figure 6. Excitat i o n a n d scattered l i ght (le f t) s p ect r a and t h e fluoresce n ce spec t r u m (r i g h t) of R ETa,O :Er go Tmo Table 4. Inte r na l quant um yield m ea su re m e n t r esu lts of RE T a ,OE ro Tmio Measurement Area of Excitation Light Area of Scattered Light Area ofAbsorption Area ofFluorescence Sample Absorbance (%) Internal Quantum Yield (%) 1 2.74.10 2.14.10 594410 501.341 21.71 0.084 2 2.86·105 2.16·10 698340 446.071 24.44 0.064 3 2.76·106 2.14-106 620210 566.941 22.45 0.091 Figure 7. Excitat i o n and scattered lig h t (le f t ) spect r a a n d t h e fluoresce n ce spectr u m (r ight) of GdTa ,O :E r, Yb 28600 Mary's Cour t , E a s to n , M D 21601US A Table 5. I nte r na l quantu m yield m eas u re m e n t r esu l ts of GdTa,OEro , Yb40 Measurement Area of Excitation Light Area of Scattered Light Area ofAbsorption Area of Fluorescence Sample Absorbance(%) Internal Quantum Yield (%) 1 2.74.10 2.08-10 663190 908.777 24.22 0.14 2 2.83-10 2.16·10° 664660 863.496 23.51 0.13 3 2.85·106 2.20·10 654600 843.468 22.97 0.13 500000 400000 300000 In t 200000 100000 0 L L 950 960 980 10001010 W a v eleng t h [n m ] Figure 8. Exc i ta ti on an d scattered l i g ht (l e f t ) spec t ra and th e f luoresce n ce s pec t r um (r i ght ) of Gd ,O :E r ,Ybi o Table 6. Inter na l qu a ntum y i e l d measuremen t res u lts of Gd .o : Er , Y b ,o Measurement Area of Excitation Light Area of Scattered Light Area ofAbsorption Area of Fluorescence Sample Absorbance (%) InternalQuantum Yield (%) 1 2.74.105 2.08-10 663190 908.777 24.22 0.14 2 2.83-10 2.16·106 664660 863.496 23.51 0.13 3 2.85·10 2.20·10° 654600 843.468 22.97 0.13 C o nclu s io n With the exception of th e Y Ta ,O : T m ,Y b。com pl ex (Figure 6, T able 3), these r esu lt s demon s trate t h at the u p -co n ve r s i on system can ev a luate qu a n t um yie l d s at leve l s of l ess th an 1%. Dat a c o ur t esy of Dr. Ko uji Tom it a , D e p a r tmen t of Ch e mi str y, Sch o ol o f S c ie n c e, Toka i Un i v e r si ty JASCO INC. UASGO T el : (800) 333-5272, Fa x : (410) 822-7526 A ppli c a tio n Lib r ary: htt p://www.jas co in c .c o m/a pp l icatio n s
关闭-
1/5
-
2/5
还剩3页未读,是否继续阅读?
继续免费阅读全文产品配置单
佳士科商贸有限公司为您提供《Up-Conversion Phosphors的量子产率测量》,该方案主要用于稀土材料中稀土元素、荧光,上转换,量子产率,近红外检测,参考标准《暂无》,《Up-Conversion Phosphors的量子产率测量》用到的仪器有JASCOFP-8000系列荧光光谱仪。
我要纠错
推荐专场
相关方案
 咨询
咨询