-
+关注
私聊
-

第21楼2005/04/12
Accuracy and Time Stability of
Arsenic Redox Species in Acid Mine
Waters
Accuracy of Arsenic(T) Determinations
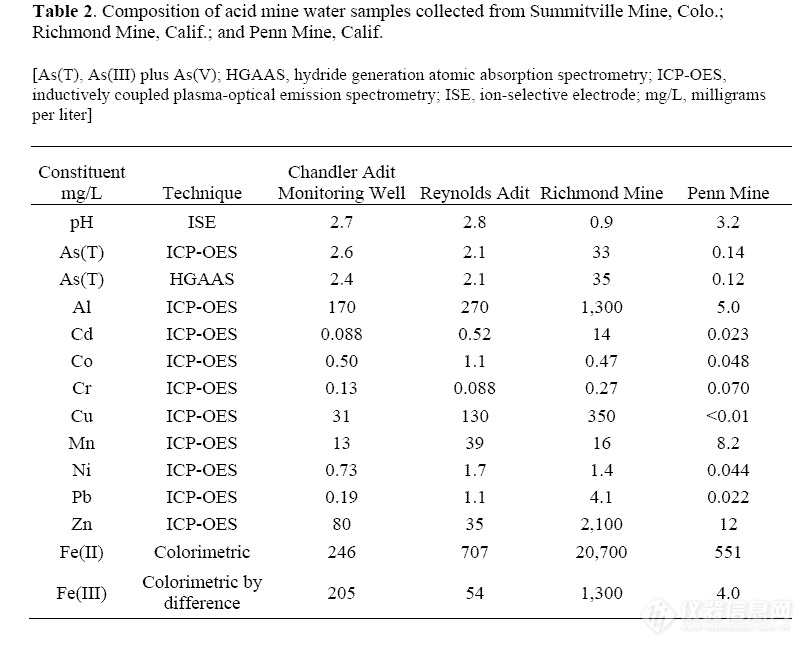
Acid mine water may contain up to 31
major metal species with concentrations that
can vary over several orders of magnitude
(Nordstrom and Alpers, 1999). Consequently,
interferences are likely during As redox
determinations by HGAAS for acid mine
waters. Samples of water collected from the
Reynolds Adit and a monitoring well near the
Chandler Adit on the Summitville Mine site,
the Richmond Mine, and the Penn Mine were
analyzed for many dissolved constituents
including As(T) and As(III). Concentrations
of potential interfering metals for these
samples are listed in Table 2. The samples
contain elevated concentrations of metals, as
determined using inductively coupled plasmaoptical
emission spectroscopy (ICP-OES) and
colorimetric determinations for Fe redox
species (To and others, 1999).
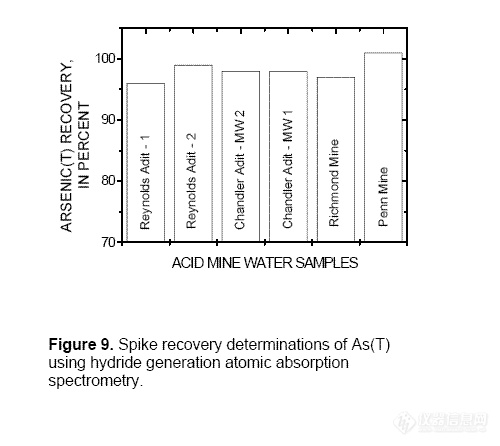
Accuracy of the As(T) method was
evaluated by performing a standard addition
on samples collected from the Summitville
Mine, Colo. (Reynolds Adit and a monitoring
well near Chandler Adit); the Richmond
Mine, Calif.; and the Penn Mine, Calif. Spike
recoveries for the samples ranged from 96 to
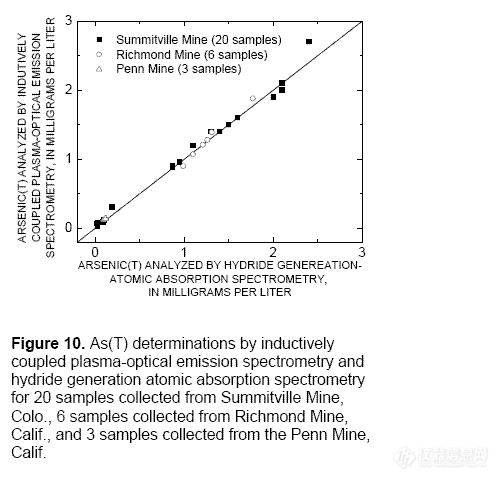
101 percent (fig. 9). Twenty samples from the
Summitville Mine site, 6 from the Richmond
Mine, and 3 from the Penn Mine were
analyzed by ICP-OES for As(T).
Concentrations compared well with As(T)
concentrations determined by hydride
generation (fig. 10). All As(T) determinations
were performed without cation-exchange
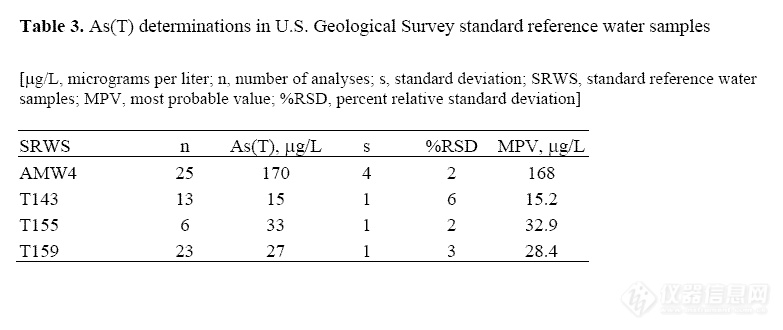
separation. As another measurement of
accuracy for As(T) determinations, USGS
standard reference water samples (SRWS)
AMW4, T143, T155, and T159 (Farrar, 2000)
were analyzed as unknowns along with the
acid mine water samples. Measured
concentrations compare well to the most
probable values (MPV) (table 3).
-
+关注
私聊
-
第27楼2005/04/12
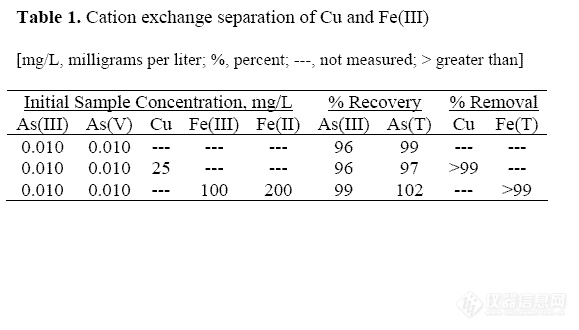
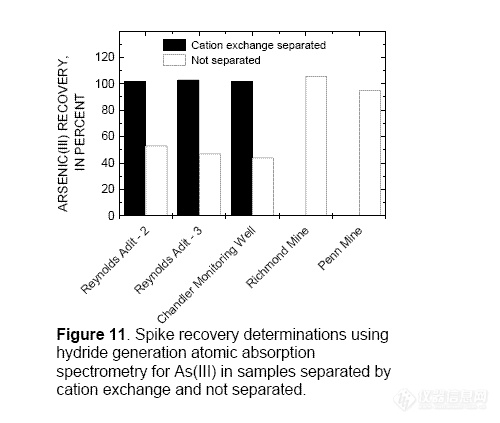
Accuracy of Arsenic(III) Determinations
Accuracy of As(III) determinations, both
with and without cation exchange, was
estimated by spiking samples collected from
the Summitville Mine (Reynolds Adit and
Chandler Adit), the Richmond Mine, and the
Penn Mine with As(III). Iron(III) and Cu(II)
interfere with the determination of As(III) in
samples collected from Summitville, but not
with the Richmond or Penn Mine samples (fig
11). Spike recoveries for Summitville Mine
samples not separated by cation exchange
were 44 to 53 percent, whereas recoveries for
the same samples separated by cation
exchange were 102 to 103 percent. The
Richmond and Penn Mine samples were not
separated with cation exchange resin because
the ratios of Fe(III) and Cu(II) to As(III) were
low enough that samples could be diluted to
Fe(III) and Cu(II) concentrations that did not
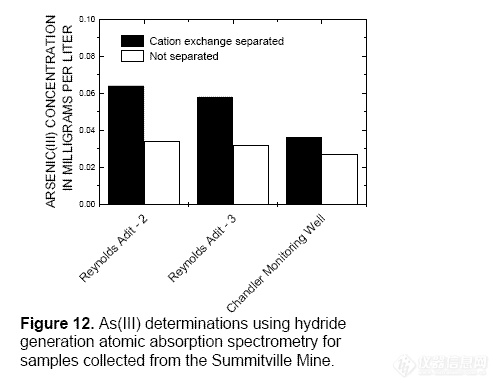
interfere with the determination. The As(III)
concentrations were underestimated in the
Summitville Mine samples not separated by
cation exchange (fig. 12). No USGS standard
reference water sample exists for As redox
species.
-
+关注
私聊
-
第30楼2005/04/12
Time Stability of Arsenic Redox Species
The time stability of As(III) was
monitored in 45 surface and ground water
samples from Yellowstone National Park,
Wyo.; Questa Mine site, N. Mex.,
Summitville Mine site, Colo., Richmond
Mine, Calif., Penn Mine, Calif., Ester Dome,
Alaska, Fallon, Nev., Mojave Desert, Calif.,
and Kamchatka, Russia. Samples were
filtered through a 0.1-μm membrane, acidified
to pH <2 with HCl, and stored in opaque
bottles at 4°C. Samples were reanalyzed as
many as 15 months after the initial
determination. The samples containing Cu(II)
or Fe(III) concentrations that interfered with
the As(III) determination were separated
using cation exchange. The change in As(III)
is represented by plotting percent difference
in As(III) concentration as a function of the
initial As(III)/As(T) ratio. The equation used
to calculate percent difference (Δ%) is: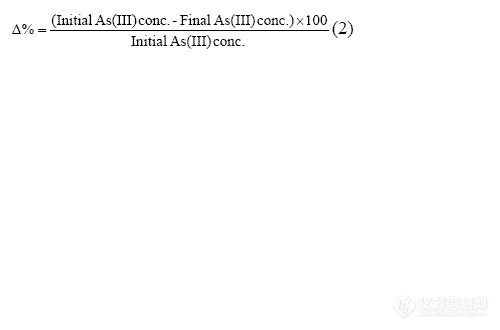
The As(T) concentration ranged from 0.006 to
33 mg/L and the initial As(III)/As(T) ratio
ranged from 0.01 to 1.0 (fig. 13). The curved
line is a Gaussian Fit. The average percent
difference (Δ%) for all samples was 0.2 with a
standard deviation of 7.