
方案摘要
方案下载| 应用领域 | 食品/农产品 |
| 检测样本 | 茶叶 |
| 检测项目 | 食品添加剂>咖啡因 |
| 参考标准 | 无 |
Sample: tea bags of green tea, black tea and coffee powder Sample amount: around 1g for each Absorption wavelength: 272nm Extracted solvent: dichloromethane
Sample: tea bags of green tea, black tea and coffee powder
Sample amount: around 1g for each
Absorption wavelength: 272nm
Extracted solvent: dichloromethane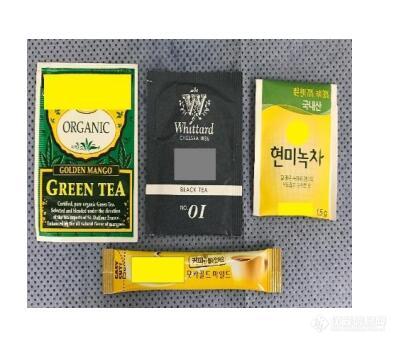
Extracting caffeine
For layer separation, using dichloromethane to extract caffeine dissolved in water is proceeded
while minimizing the interference of caffeine and other substances in the beverage.
Reference: Food Chemistry 108 (2008) 310-31
Experiment
Put around 1 g of each sample in a flask. Immerse the sample in about 50 ml of 30 ℃ distilled water for 30 minutes to extract the substance dissolved in the water. Filter the tea
leaves using a paper filter and move this water to the separate funnel. Add 30 ml of
dichloromethane into funnel, shaking enough to separate the layer. Once the separation is
confirmed, take the lower layer (Dichloromethane). Put the 30 ml of dichloromethane into the
separate funnel again. More than three times of layer separation is needed to be proceeded
until the caffeine does not exists in the water layer.
Calculation of absorption of caffeine (Gaussian fit)
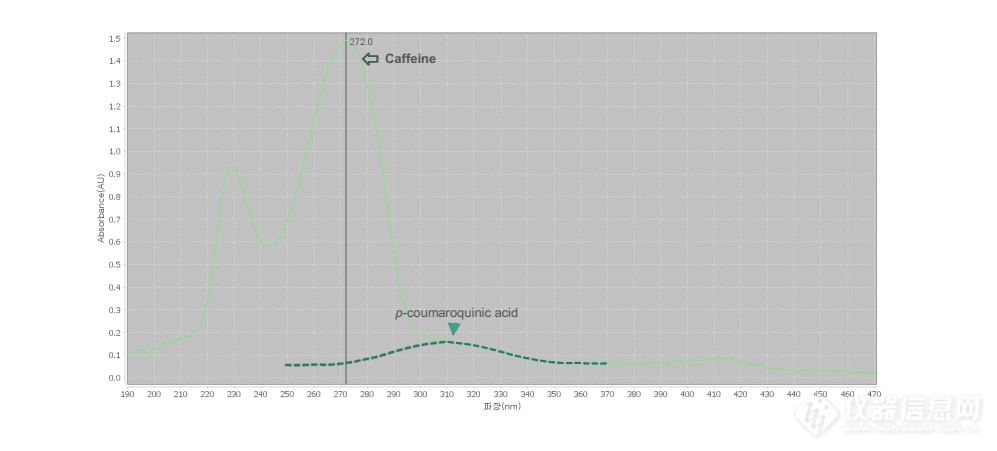
Among substances of beverages, p-coumaroquinic acid absorbs UV at 308-310nm, near the
absorption wavelength of caffeine. If the intensity of this peak is strong, it makes value of
surrounding caffeine peak higher, correcting the intensity of caffeine absorbance in the way of
Gaussian fit. Gaussian fit is that subtracting the value of absorbance overlapping the main peak
wavelength to obtain near absorbance intensity after bilateral symmetry of the peak of the
material disturbed. The absorption of peak of p-coumaroquinic acid in the green tea is tested
by Gaussian fit, and the effect of absorbance of p-coumaroquinic is negligible at the maximum
wavelength of 272nm.
Test result
Absorbance graph of caffeine from the each tea extracted by Dichloromethane
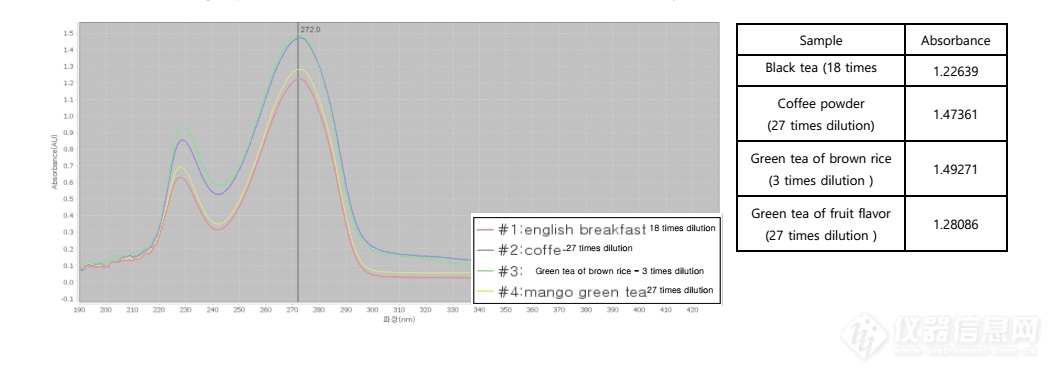
Standard curve graph obtained by dissolving caffeine in dichloromethan
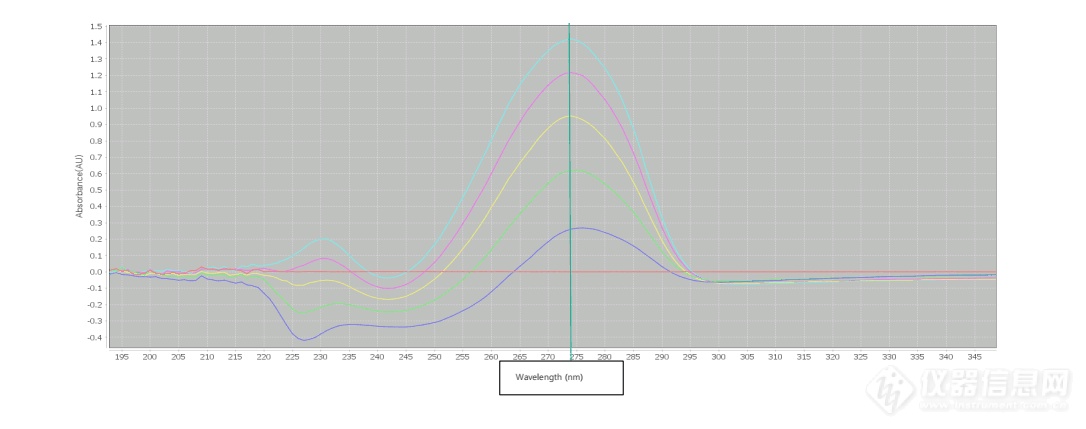
The standard curve of absorbance for each concentration is as below.

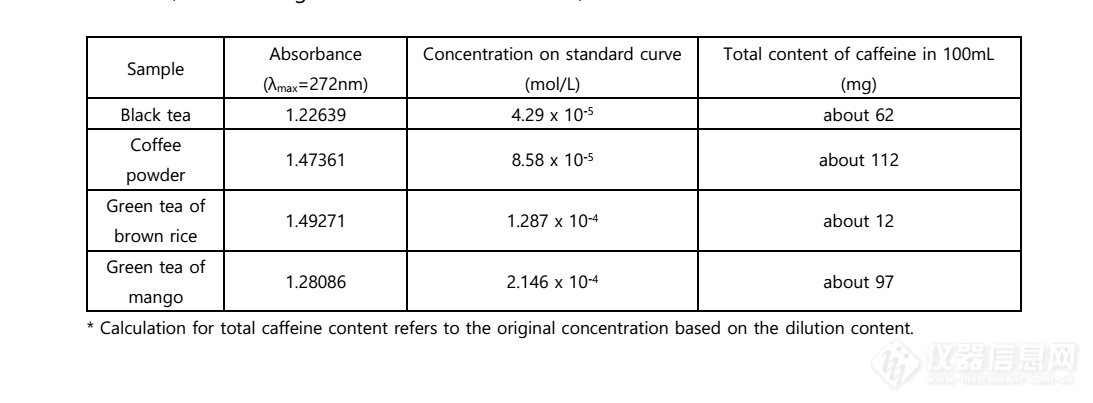
From the functional formula (absorbance (y)=11.792 * concentration(x) + 0.0086) showing
linearity of the above standard curve, the concentration of sample in the standard curve is
obtained, and the original concentration is as well, based on the dilution content.


关于可拉伸性的石墨烯半导体超疏水涂层的研究
压电晶体器件衬底超精密清洗的研究
利用金相显微镜测量微米级膜层厚度
相关产品

关注

拨打电话

留言咨询