方案详情文
智能文字提取功能测试中
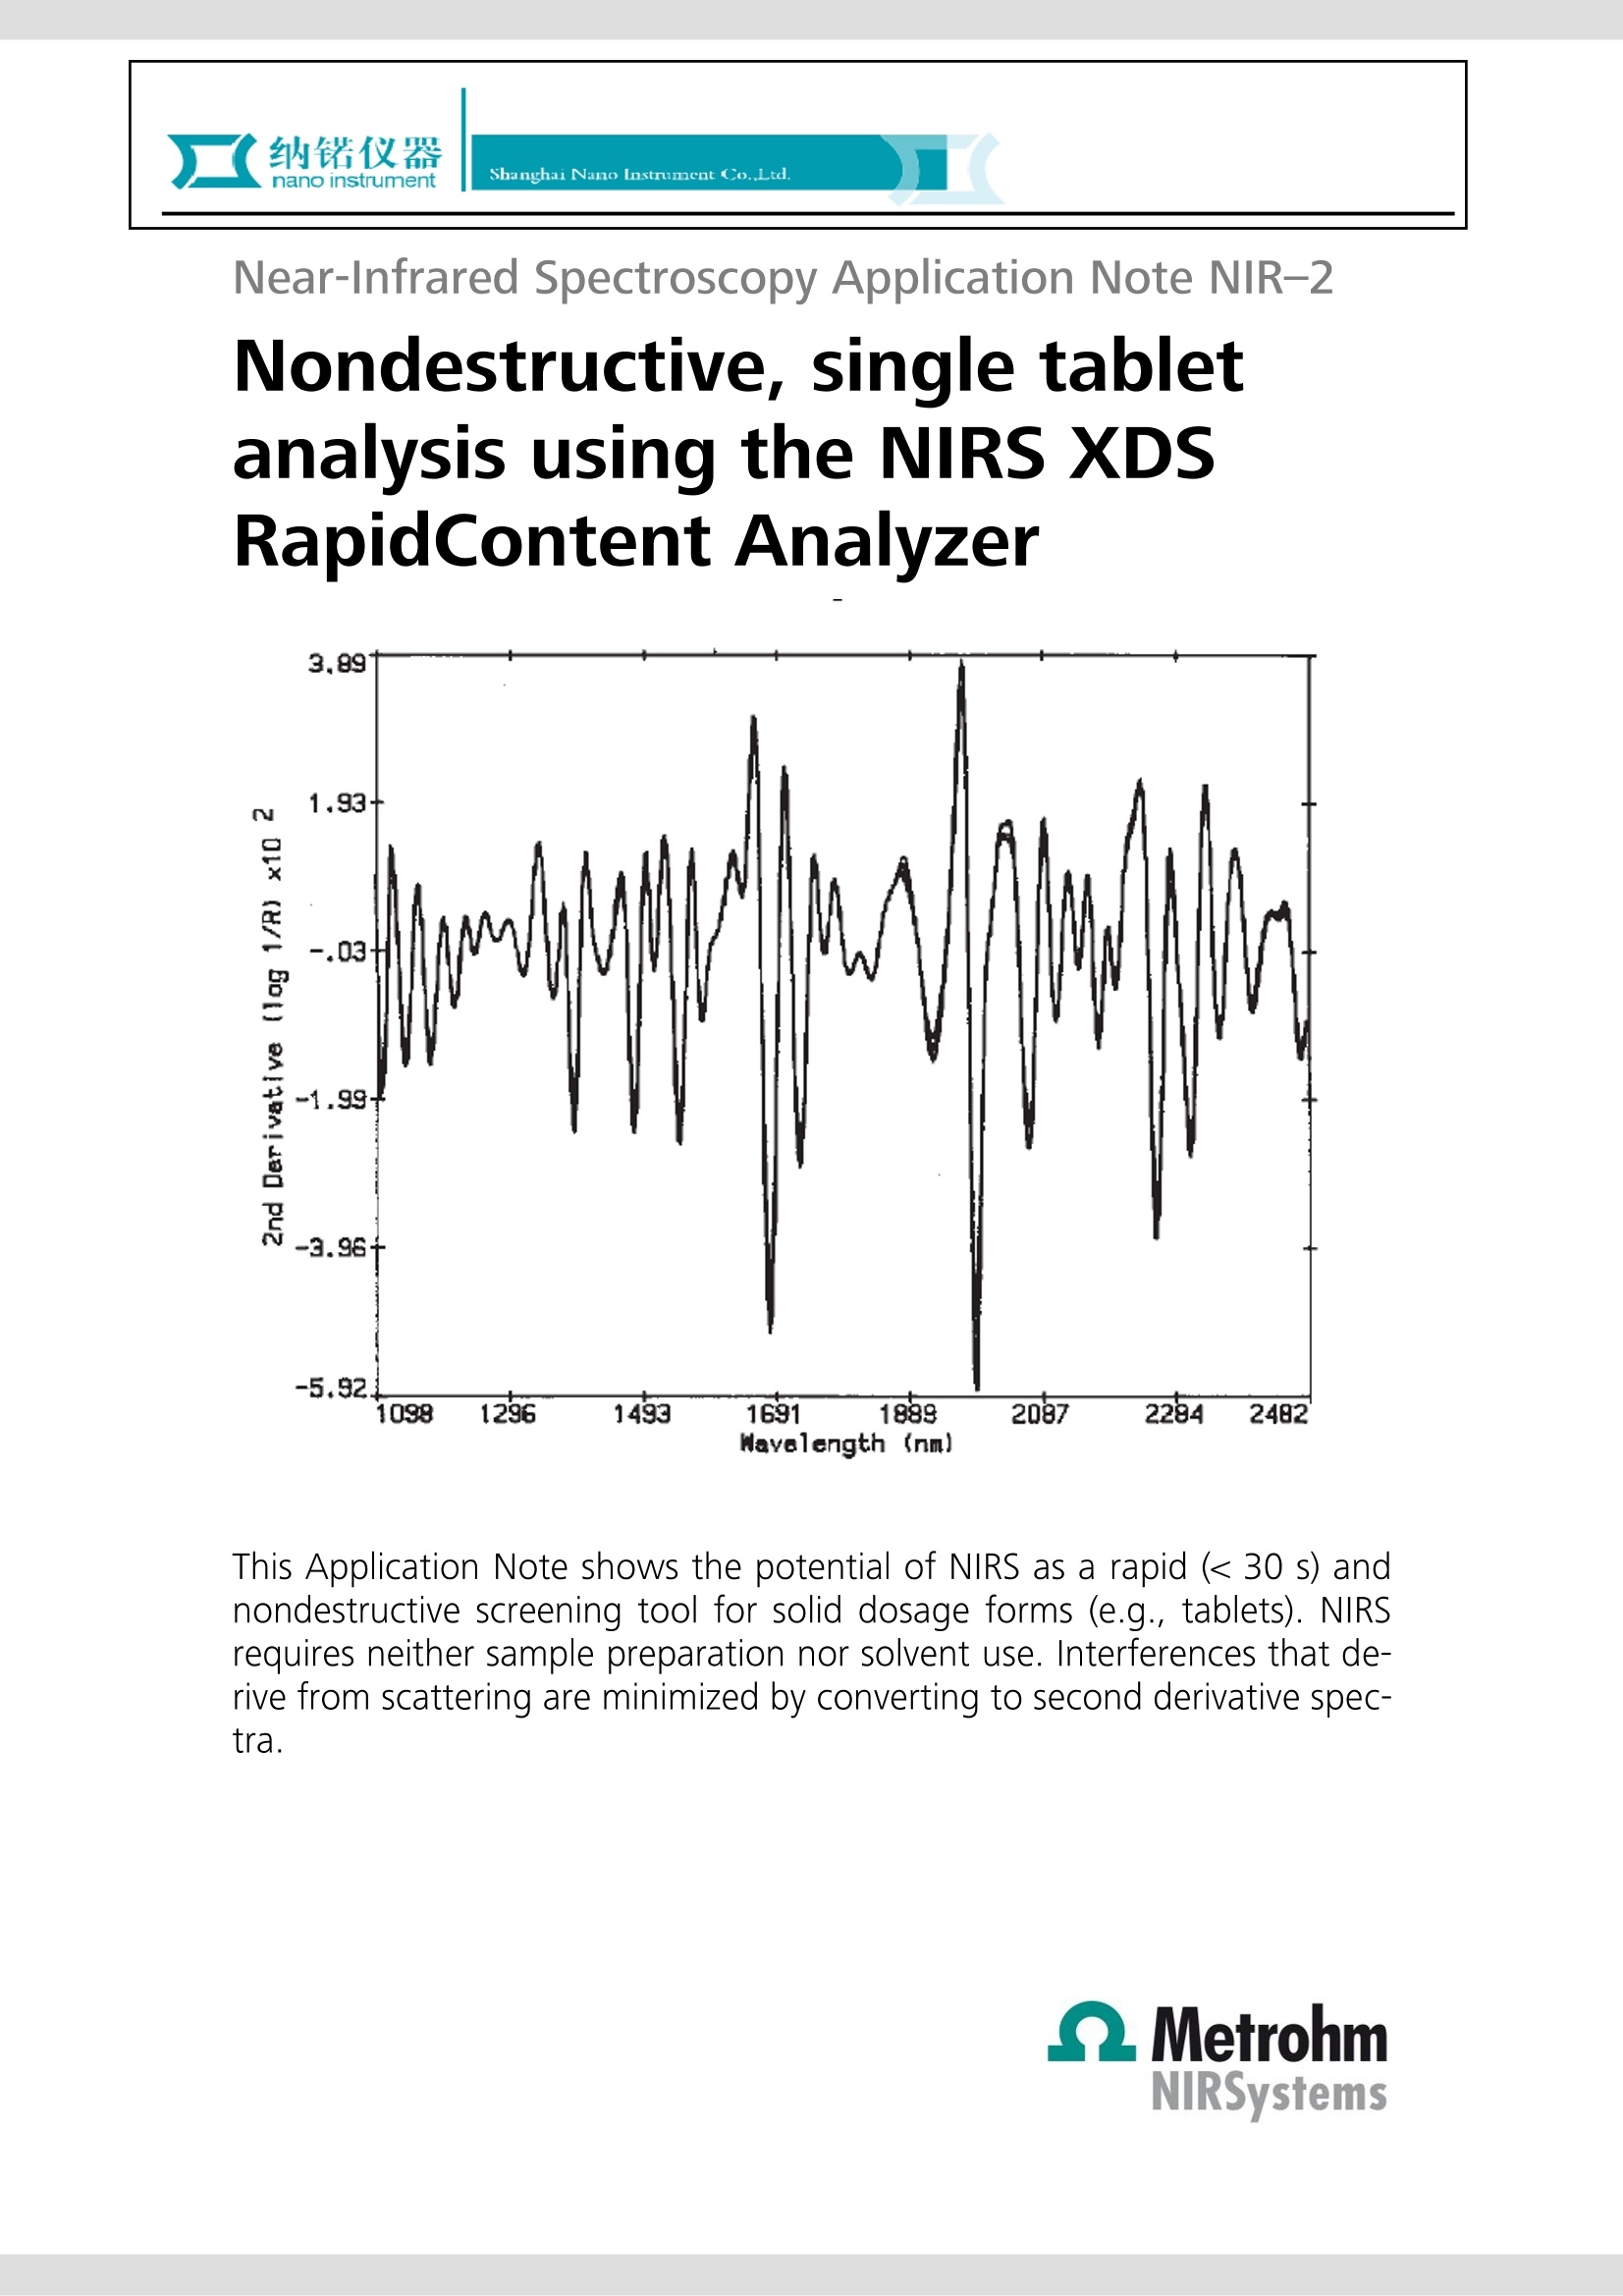
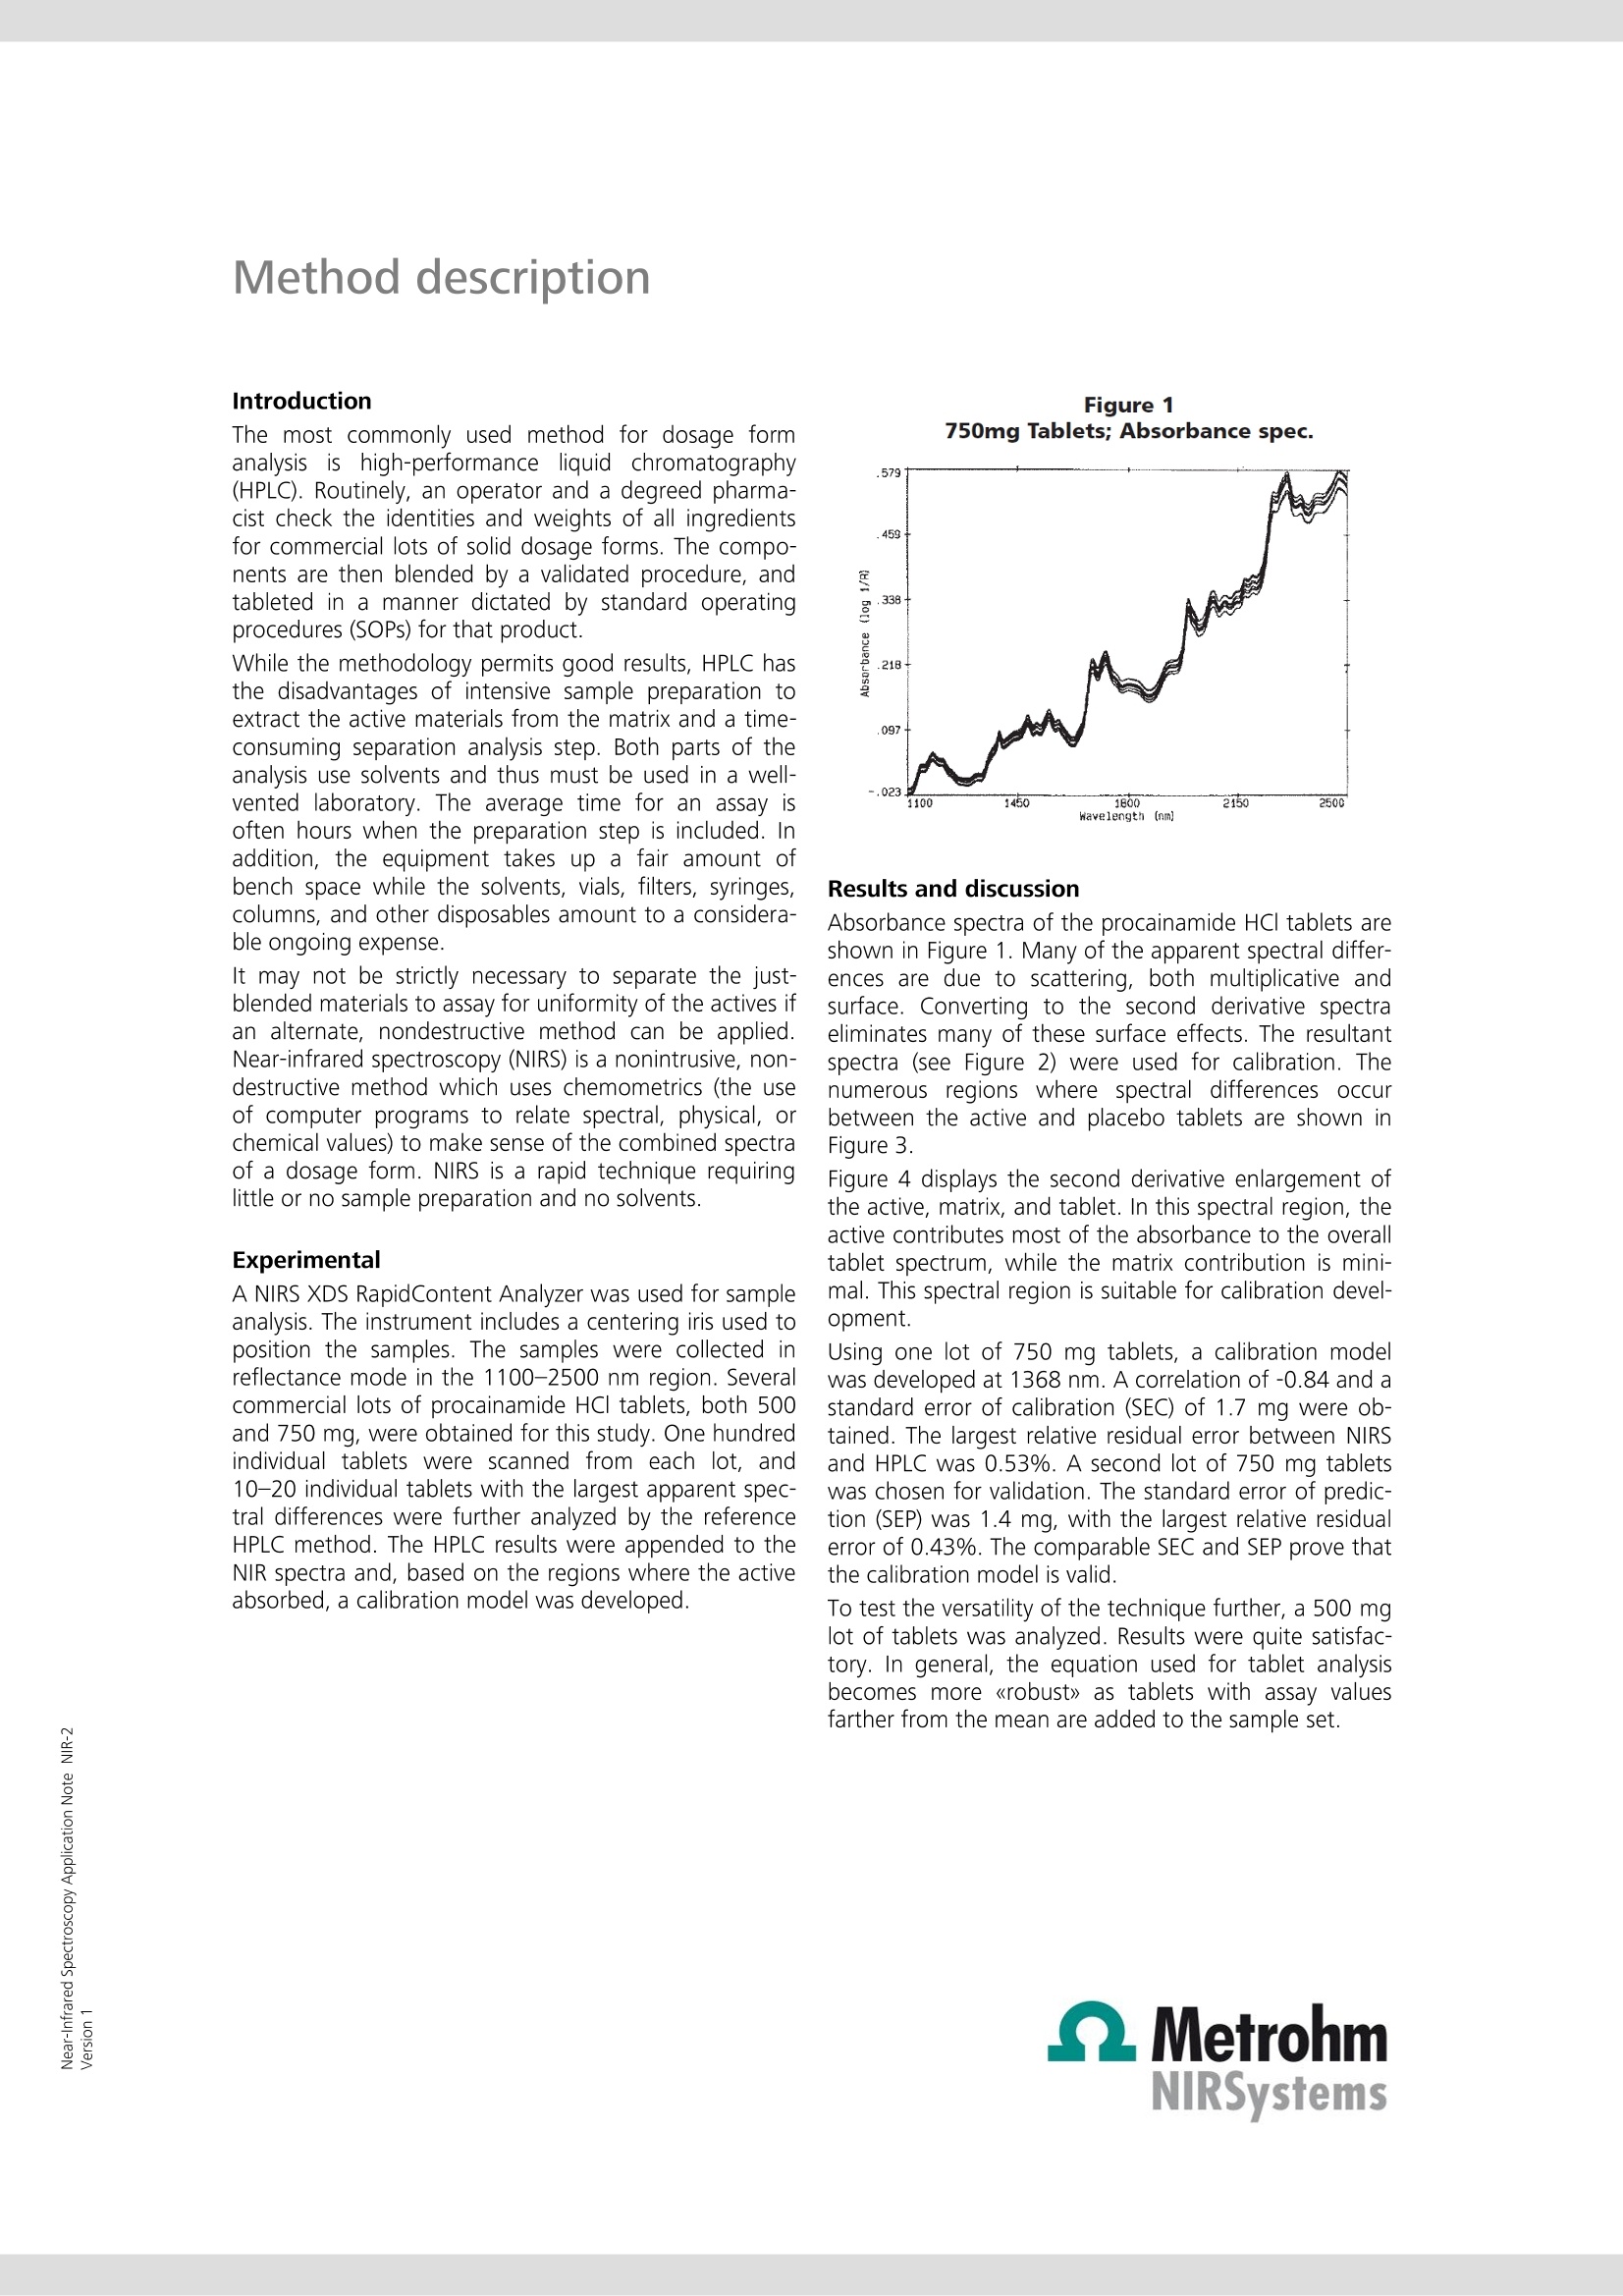
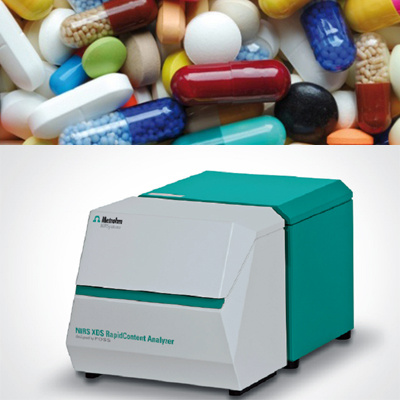
Near-Infrared Spectroscopy Application Note NIR-2 Nondestructive, single tabletanalysis using the NIRS XDSRapidContent Analyzer This Application Note shows the potential of NIRS as a rapid (< 30 s) andnondestructive screening tool for solid dosage forms (e.g., tablets). NIRSrequires neither sample preparation nor solvent use. Interferences that de-rive from scattering are minimized by converting to second derivative spec-tra. Introduction The most commonly used method for dosage formanalysis is high-performance liquid chromatography(HPLC). Routinely, an operator and a degreed pharma-cist check the identities and weights of all ingredientsfor commercial lots of solid dosage forms. The compo-nents are then blended by a validated procedure, andtableted in a manner dictated by standard operatingprocedures (SOPs) for that product. While the methodology permits good results, HPLC hasthe disadvantages of intensive sample preparation toextract the active materials from the matrix and a time-consuming separation analysis step. Both parts of theanalysis use solvents and thus must be used in a well-vented laboratory. The average time for an assay isoften hours when the preparation step is included. Inaddition, the equipment takes up a fair amount ofbench space while the solvents, vials, filters, syringes,columns, and other disposables amount to a considera-ble ongoing expense. It may not be strictly necessary to separate the just-blended materials to assay for uniformity of the actives ifan alternate, nondestructive method can be applied.Near-infrared spectroscopy (NIRS) is a nonintrusive, non-destructive method which uses chemometrics (the useof computer programs to relate spectral, physical, orchemical values) to make sense of the combined spectraof a dosage form. NIRS is a rapid technique requiringlittle or no sample preparation and no solvents. Experimental A NIRS XDS RapidContent Analyzer was used for sampleanalysis. The instrument includes a centering iris used toposition the samples. The samples were collected inreflectance mode in the 1100-2500 nm region. Severalcommercial lots of procainamide HCl tablets, both 500and 750 mg, were obtained for this study. One hundredindividual tablets were scanned from each lot, and10-20 individual tablets with the largest apparent spec-tral differences were further analyzed by the referenceHPLC method. The HPLC results were appended to theNIR spectra and, based on the regions where the activeabsorbed, a calibration model was developed. Figure 1 750mg Tablets; Absorbance spec. Results and discussion Absorbance spectra of the procainamide HCl tablets areshown in Figure 1. Many of the apparent spectral differ-ences are due to scattering, both multiplicative andsurface. Converting to the second derivative spectraeliminates many of these surface effects. The resultantspectra (see Figure 2) were used for calibration. Thenumerous regions where spectral differences occurbetween the active and placebo tablets are shown inFigure 3. Fiqure 4 displays the second derivative enlargement ofthe active, matrix, and tablet. In this spectral region, theactive contributes most of the absorbance to the overalltablet spectrum, while the matrix contribution is mini-mal. This spectral region is suitable for calibration devel-opment. Using one lot of 750 mg tablets, a calibration modelwas developed at 1368 nm. A correlation of -0.84 and astandard error of calibration (SEC) of 1.7 mg were ob-tained. The largest relative residual error between NIRSand HPLC was 0.53%. A second lot of 750 mg tabletswas chosen for validation. The standard error of predic-tion (SEP) was 1.4 mg, with the largest relative residualerror of 0.43%. The comparable SEC and SEP prove thatthe calibration model is valid. To test the versatility of the technique further, a 500 mglot of tablets was analyzed. Results were quite satisfac-tory. In general, the equation used for tablet analysisbecomes more 《robust》 as tablets with assay valuesfarther from the mean are added to the sample set. Method description Figure 22nd Derivative Spectra of Tablets Figure 3Placebo vs Active Tablet Since a normal, commercial tableting process is usuallywell within control, outliers are seldom encountered. Asthey are found, however, they are added to the sampleset to increase its range. The equation used for finishedproduct release will continue to improve as more diversevalues are added to the calibration set over time. Figure 4Matrix, Active, Tablet Conclusions Near-infrared spectroscopy may be used as a nonde-structive, rapid assay for solid dosage forms. The analy-sis takes approximately 30 seconds to perform, requiresno sample preparation and is location insensitive. Theassay may be performed in a conventional quality con-trol setting, i.e., a laboratory, or may be done on-site inproduction. In the second case, the time consumingprocedure of labeling, transporting, separating, thenassaying the product can be eliminated. 浙江办事处 地址:浙江杭州市莫干山路425号瑞祺大厦814室 电话:0571-8195457813107706400 邮箱: sales@nano-instru.com 传真:0571-81954579
关闭-
1/3
-
2/3
还剩1页未读,是否继续阅读?
继续免费阅读全文产品配置单
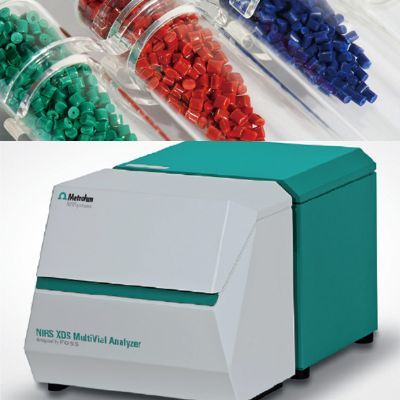
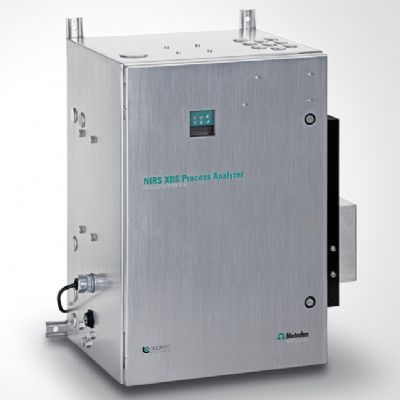
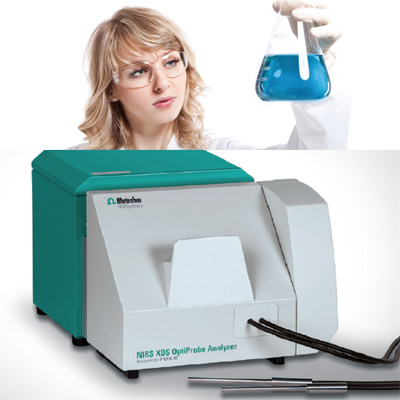
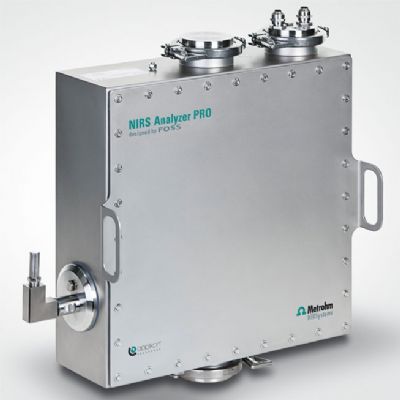
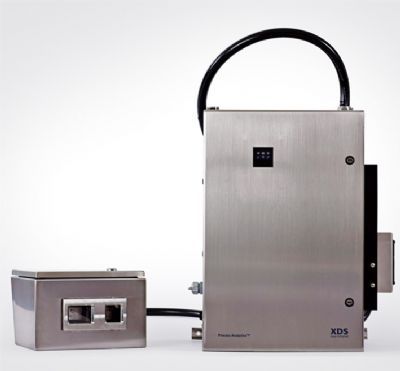
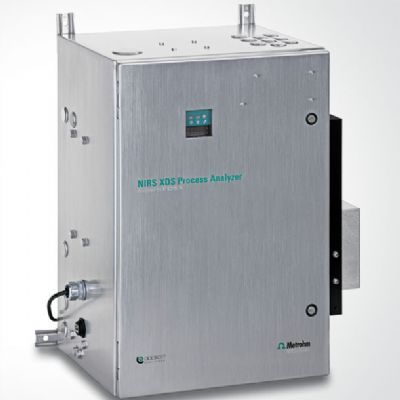
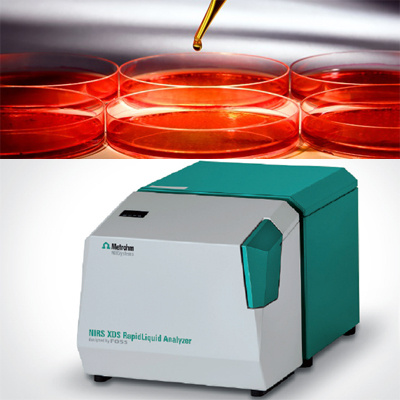
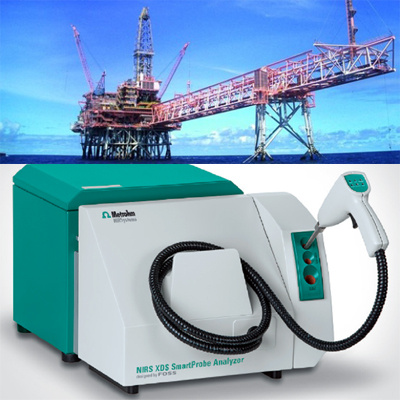
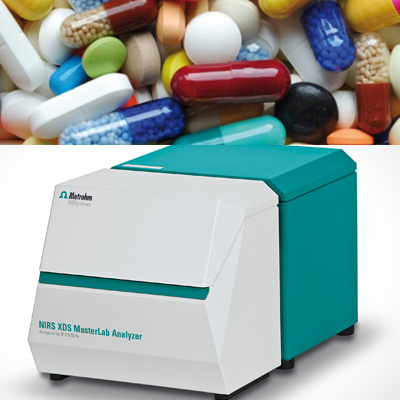
上海纳锘实业有限公司为您提供《化学药中有效成分含量分析检测方案 》,该方案主要用于化药制剂中含量测定检测,参考标准《暂无》,《化学药中有效成分含量分析检测方案 》用到的仪器有瑞士万通 DS 2500 近红外光谱分析仪、瑞士万通 XDS MultiVial 近红外光谱分析仪、瑞士万通 XDS近红外在线分析仪 –微光纤束型、瑞士万通 NIRS XDS TOPA 近红外光谱分析仪、瑞士万通 PRO 近红外在线分析仪、瑞士万通 XDS 近红外在线分析仪 ——直射光/非接触型、瑞士万通 XDS 近红外在线分析仪 -单光纤型、瑞士万通 XDS RLA 近红外光谱分析仪、XDS RCA 近红外光谱分析仪、瑞士万通 XDS SmartProbe 近红外光谱分析仪、瑞士万通 瑞士万通 XDS MasterLab 近红外光谱分析仪、瑞士万通 XDS IOPA 近红外光谱分析仪。
我要纠错
推荐专场
相关方案


 咨询
咨询