

方案详情文
智能文字提取功能测试中
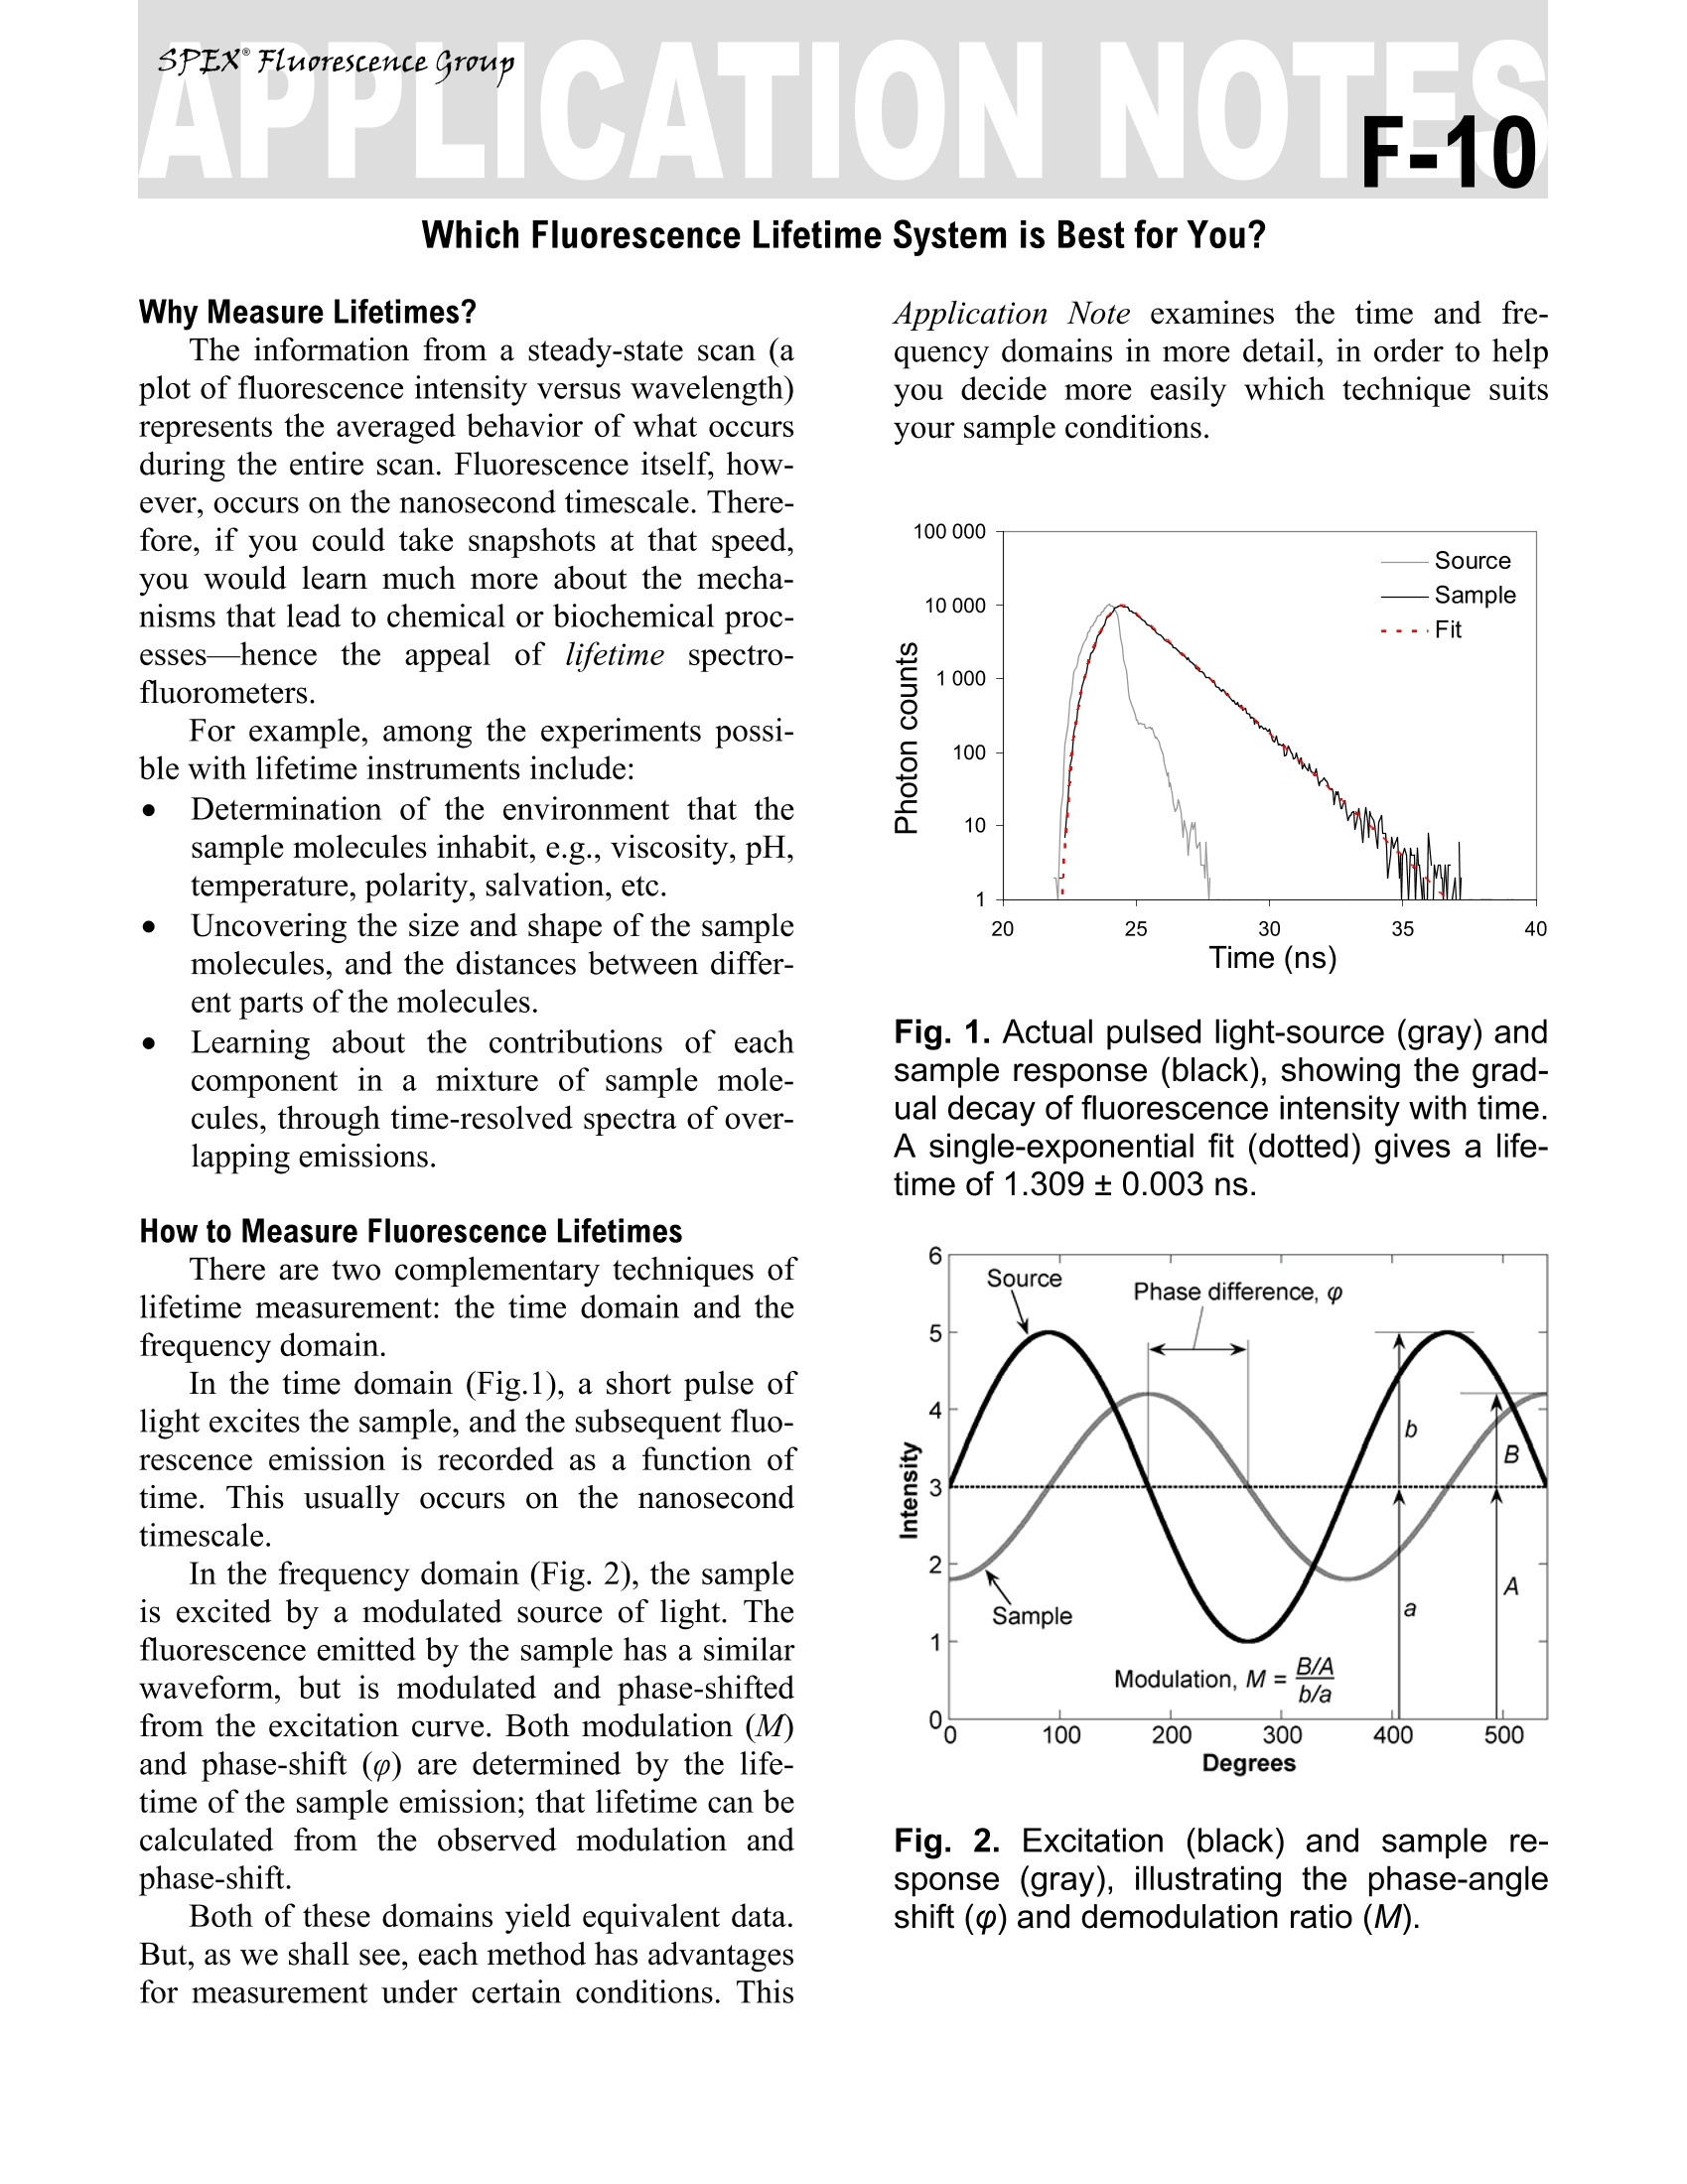
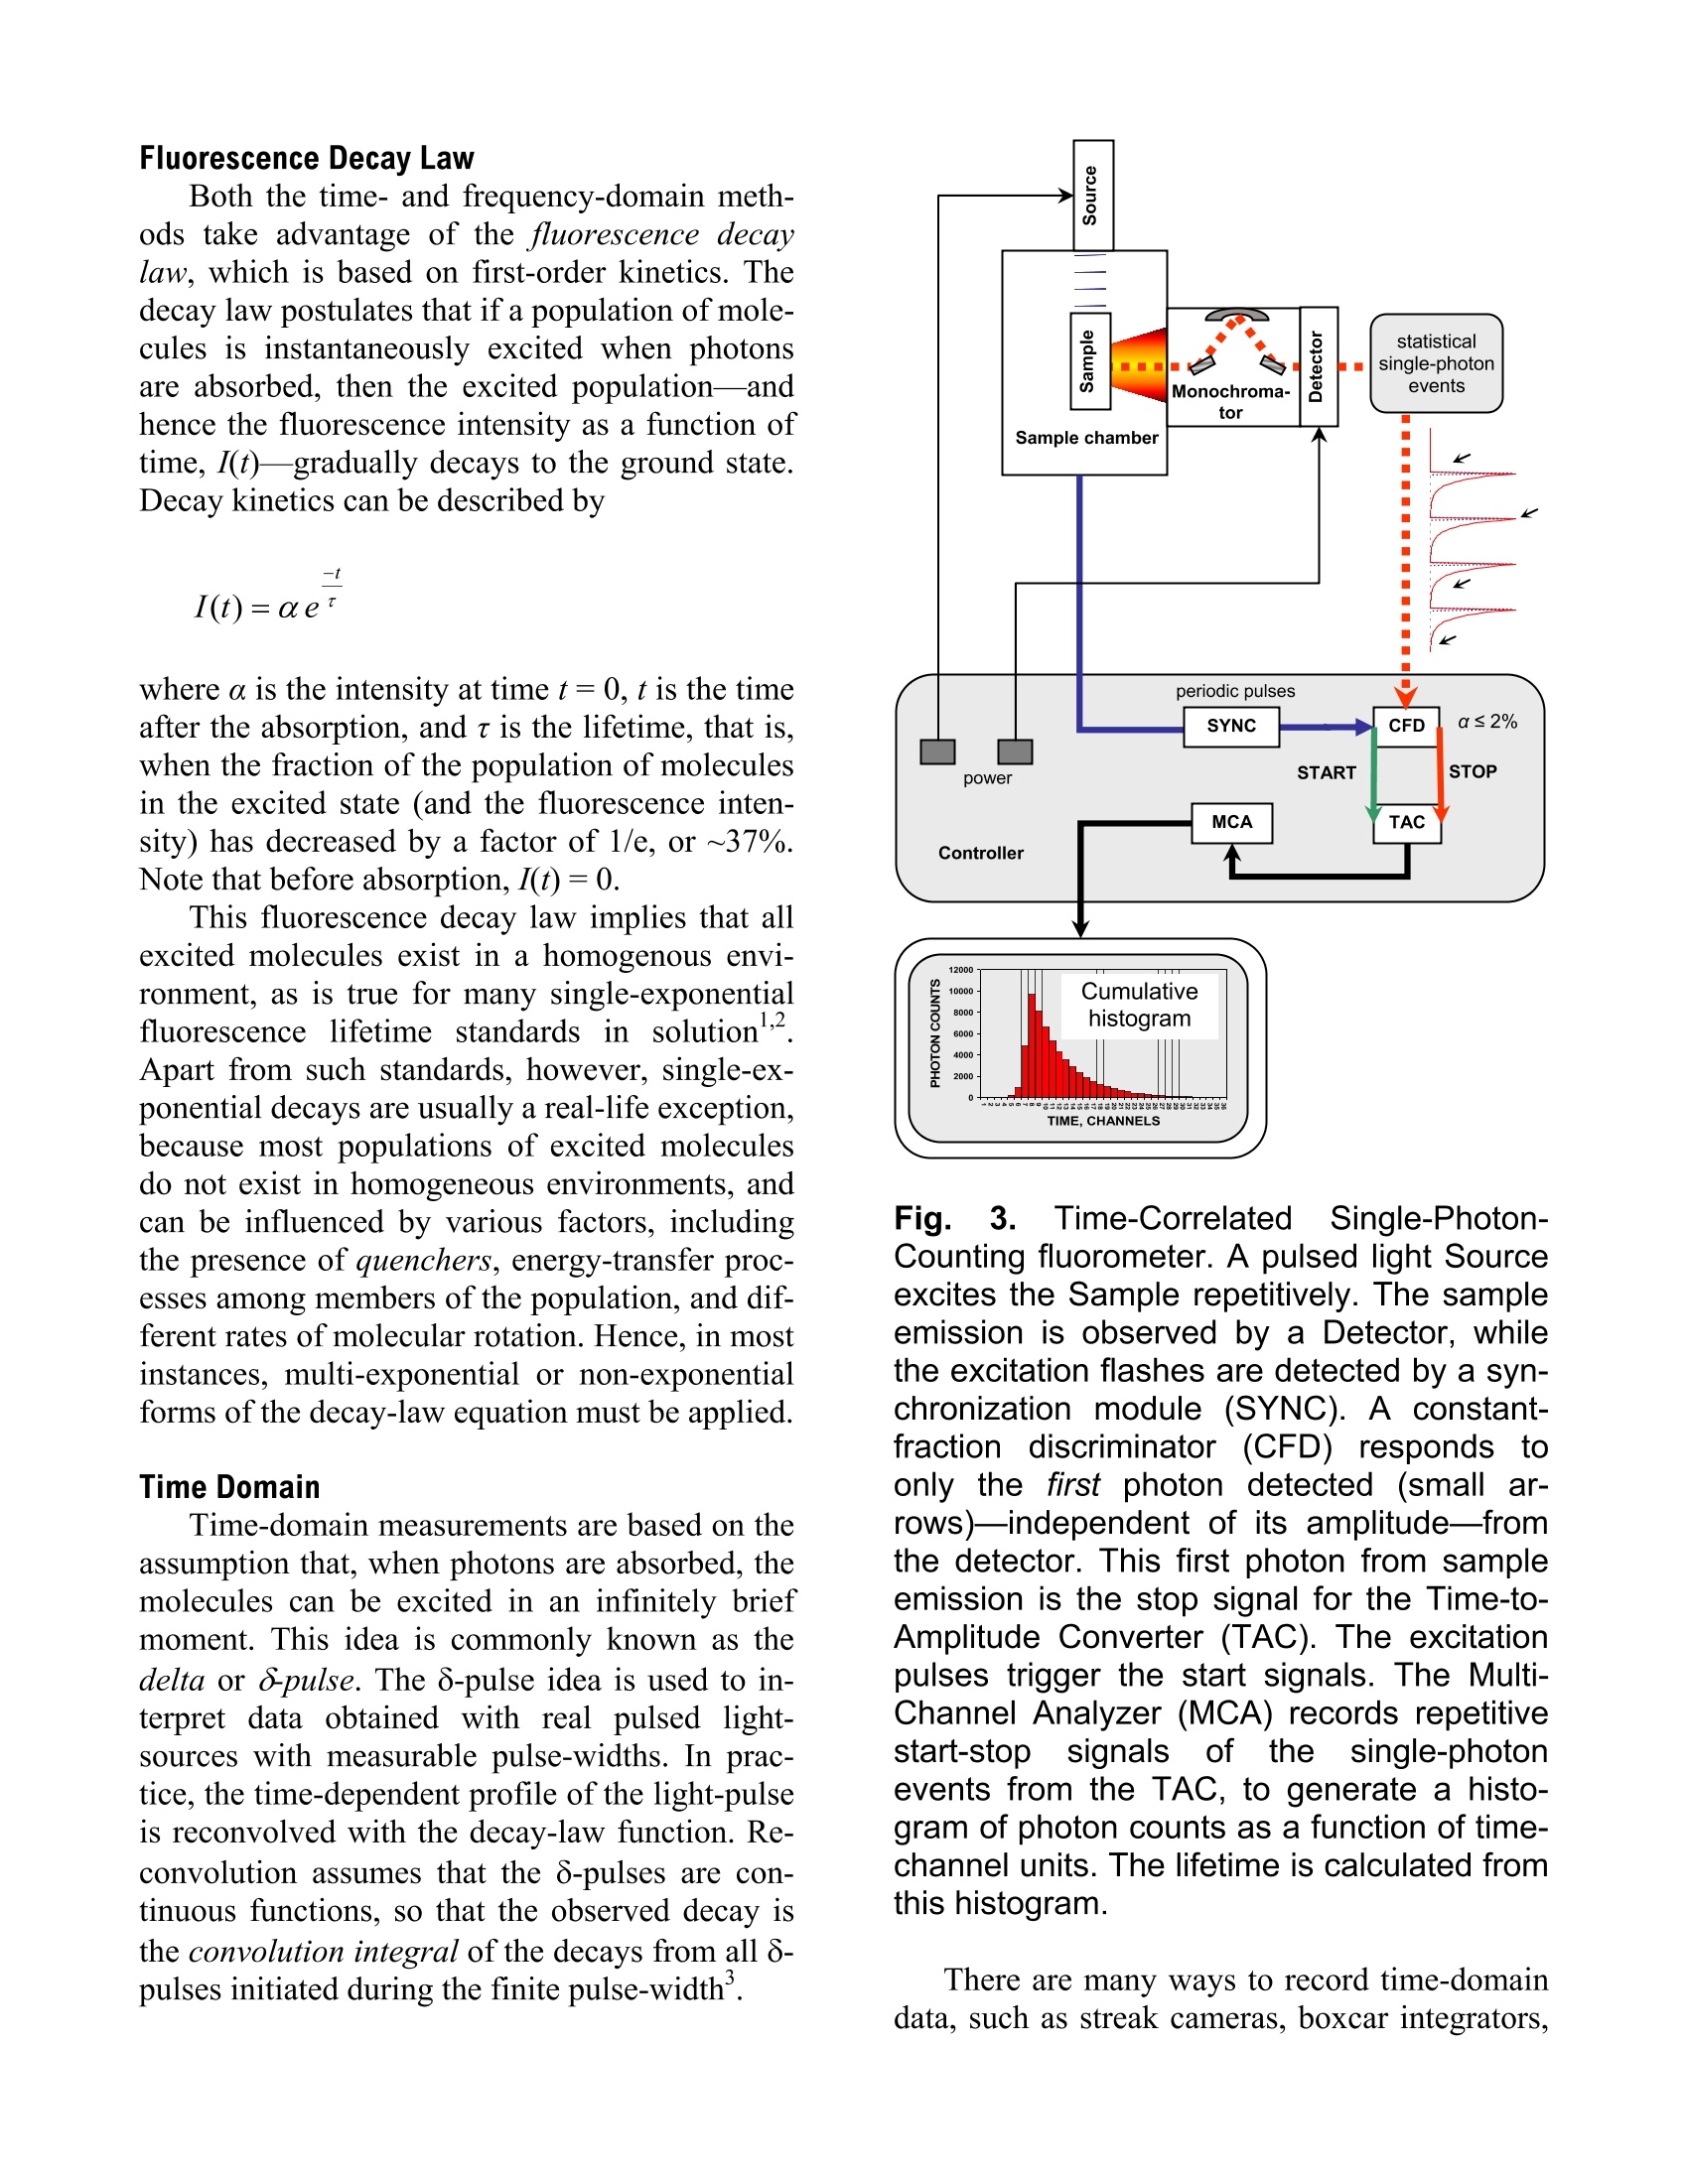
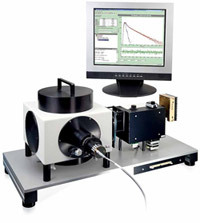
Explore the futureEMISSION·FLUORESCENCE·FORENSICS· GRAIINGS EOEM·OPIICAL SPECTROSCOPY·RAMAN·IHIN FILM Which Fluorescence Lifetime System is Best for You? Why Measure Lifetimes? The information from a steady-state scan (aplot of fluorescence intensity versus wavelength)represents the averaged behavior of what occursduring the entire scan. Fluorescence itself, how-ever, occurs on the nanosecond timescale. There-fore, if you could take snapshots at that speed,you would learn much more about the mecha-nisms that lead to chemical or biochemical proc-esses—hencsee tthe appeal of lifetime spectro-fluorometers. For example, among the experiments possi-ble with lifetime instruments include: Determination of the environment that thesample molecules inhabit, e.g., viscosity, pH,temperature, polarity, salvation, etc. Uncovering the size and shape of the samplemolecules, and the distances between differ-ent parts of the molecules. Learning about the contributions of eachcomponent in a mixture of sample mole-cules, through time-resolved spectra of over-lapping emissions. How to Measure Fluorescence Lifetimes There are two complementary techniques oflifetime measurement: the time domain and thefrequency domain. In the time domain (Fig.1), a short pulse oflight excites the sample, and the subsequent fluo-rescence emission is recorded as a function oftime. This usually occurs on the nanosecondtimescale. In the frequency domain (Fig. 2), the sampleis excited by a modulated source of light. Thefluorescence emitted by the sample has a similarwaveform, but is modulated and phase-shiftedfrom the excitation curve. Both modulation (M)and phase-shift () are determined by the life-time of the sample emission; that lifetime can becalculated from the observed modulation andphase-shift. Both of these domains yield equivalent data.But, as we shall see, each method has advantagesfor measurement under certain conditions. This Application Note examines the time and fre-quency domains in more detail, in order to helpyou decide more easily which technique suitsyour sample conditions. Fig. 1. Actual pulsed light-source (gray) andsample response (black), showing the grad-ual decay of fluorescence intensity with time.A single-exponential fit (dotted) gives a life-time of 1.309±0.003 ns. Fig. 2. Excitation (black) and sample re-sponse (gray), illustrating the phase-angleshift (p) and demodulation ratio (M). Fluorescence Decay Law Both the time- and frequency-domain meth-ods take advantage of the fluorescence decaylaw, which is based on first-order kinetics. Thedecay law postulates that if a population of mole-cules is instantaneously excited when photonsare absorbed, then the excited population—andhence the fluorescence intensity as a function oftime, I(t)-gradually decays to the ground state.Decay kinetics can be described by -t where a is the intensity at time t=0, t is the timeafter the absorption, and t is the lifetime, that is,when the fraction of the population of moleculesin the excited state (and the fluorescence inten-sity) has decreased by a factor of 1/e, or ~37%.Note that before absorption, I(t)=0. This fluorescence decay law implies that allexcited molecules exist in a homogenous envi-ronment, as is true for many single-exponentialfluorescence lifetime standards in solution’Apart from such standards, however, single-ex-ponential decays are usually a real-life exception,because most populations of excited moleculesdo not exist in homogeneous environments, andcan be influenced by various factors, includingthe presence of quenchers, energy-transfer proc-esses among members of the population, and dif-ferent rates of molecular rotation. Hence, in mostinstances, multi-exponential or non-exponentialforms of the decay-law equation must be applied. Time Domain Time-domain measurements are based on theassumption that, when photons are absorbed, themolecules can be excited in an infinitely briefmoment. This idea is commonly known as thedelta or 8-pulse. The 8-pulse idea is used to in-terpret data obtained with real pulsed light-sources with measurable pulse-widths. In prac-tice, the time-dependent profile of the light-pulseis reconvolved with the decay-law function. Re-convolution assumes that the 8-pulses are con-tinuous functions, so that the observed decay isthe convolution integral of the decays from all 8-pulses initiated during the finite pulse-width. Fig. 3.Time-CorrelatedSSingle-Photon-Counting fluorometer. A pulsed light Sourceexcites the Sample repetitively. The sampleemission is observed by a Detector, whilethe excitation flashes are detected by a syn-chronization module (SYNC). A constant-fraction discriminator (CFD) responds toonly the first photon detected (small ar-rows)-independent of its amplitude-fromthe detector. This first photon from sampleemission is the stop signal for the Time-to-Amplitude Converter (TAC). The excitationpulses trigger the start signals. The Multi-Channel Analyzer (MCA) records repetitivestart-stop signals of the single-photonevents from the TAC, to generate a histo-gram of photon counts as a function of time-channel units. The lifetime is calculated fromthis histogram. There are many ways to record time-domaindata, such as streak cameras, boxcar integrators, and so forth. Most agree, however, that themethod of single-photon counting is, by far, su-perior. Time-Correlated Single-Photon Counting(TCSPC) measurements are shown in Fig. 3.TCSPC uses a pulsed light-source and a circuitto detect single-photon events at a detector. In arepetitive series of many start-stop signals fromthe circuitry, a binned histogram in time chan-nels of single-photon counts is gradually gener-ated. TCSPC relies on a principle of Poissonianstatistics, that only one photon can be counted ata time and in any one channel, to avoid skewingthe time-dependent statistics in photon-pile-up.Pile-up thus limits the data-acquisition rate ofTCSPC to a few (typically 1-2) percent of therepetition rate. In practice, the single-photonlimit is not a major hindrance because the pile-uplimit can be monitored during the experiment,and decay times with sufficient photon counts incan be obtained in seconds to minutes with repe-tition rates in the MHz range. In addition, thePoissonian nature of the statistics allows the datato be rigorously analyzed. Frequency Domain The fluorescence decay parameters in the de-cay law’s impulse function may be obtainedbased on the relation of a sinusoidally modulatedexcitation beam to the fluorescence emission re-sponse (Fig.2). The emission occurs at the samefrequency as the excitation. Because of the lossof electron energy (Stokes’shift) between exci-tation and emission, the emission waveform isdemodulated and phase-shifted in comparison tothe excitation. Thus the demodulation ratio (M)and phase-angle shift (0) constitute two separateobservable parameters that are both directly re-lated, via a Fourier transformation", to the initialfluorescence intensity, a, and lifetime, t, for apopulation of fluorophores. Frequency-domainmeasurements are bestperformed using Multi-Frequency Cross-Corre-lation phase-and-modulation (MFCC), shown inFig. 4. A modulated beam excites the sample.The fluorescence emission is detected by a Pho-toMultiplier Tube (PMT) modulated at the samebase radio-frequency as the master plus a lowcross-correlation frequency (a few Hz). The base-frequency signals are filtered to reveal thecross-correlation frequency signal, which con-tains all the same demodulation (M) and phase-angle shift (() information as the fluorescenceemission. Fig.4..Multi-Frequency Cross-Correlationfluorometer. An unmodulated light Sourceemits a spectrum of continuous-wave light.Theexcitation monochromator(Excit.Mono.) selects an excitation wavelength. Anamplified (Amp1) master synthesizer (Mas-ter) drives the Pockels cell (Pockels) at abase frequency, Rf, which modulates theexcitation beam. The modulated beam ex-cites the Sample, causing the sample toemit modulated fluorescence also at thebase Rf. Anemission monochromator(Emis. Mono.) selects one wavelength ofmodulated fluorescence. The photomultipliertube (PMT) is modulated by an amplified(Amp 2) slave synthesizer (Slave) at thebase Rf plus a low-frequency cross-correla-tion note (Af). The sample emission at Rfcancels the slave Rf+Af frequencies to yieldthe Af signal containing the same phase-an-gle shift (p) and demodulation ratio (M) asthe Rf fluorescence. Usually the sample is scanned over a range(10-16) of frequencies because of the intrinsiclimitations of resolving mixtures using only onefrequency. In theory, for a single-exponentialemitter, one should observe the same lifetimeusing the observed p and M at any given fre-quency. However, for mixtures of components,p is biased towards the faster decay componentsand M is weighted toward the slower compo-nents. Hence, resolving separate fluorescencelifetime parameters for mixtures requires a rangeof frequencies to be statistically valid. On theother hand, the MFCC technique is not con-strained by the Poissonian single-photon detec-tion limits of TCSPC. Therefore, rapid acquisi-tion at a high signal-to-noise ratio to resolvecomplex mixtures is possible. Which Method is Best for Your Sample? In principle, both methods can yield identicalresults for a wide variety of experimental sam-ples and conditions. A user may choose oneSpex-IBH fluorescencelifetimeinstrumentmethod over the other for a variety of reasons: The frequency domain, for example, iscompatible with a strong, tunable continuous-wave xenon excitation source that seamlesslycovers a wide spectral range. With the frequencydomain, lifetimes as short as 10 picoseconds canbe measured with a continuous source, tunablefrom the UV to the near-IR. All other conditionsbeing equal, frequency domain is usually fasterthan time domain. Time-domain instruments have no conti-nuously tunable, pulsed source from the UV toIR, so the choice of excitation wavelength ismore limited. Because of pulse-width, lifetimesare usually limited to no shorter than just under ananosecond with a flash lamp, though they canoperate at picosecond timeframes with inexpen-sive diode sources. On the other hand, TCSPC iscompatible with precise and inexpensive pulsedlight-emitting diodes and diode-laser sources.The single-photon detection method is preferred In the USA: Jobin Yvon Inc.3880 Park Avenue, Edison, NJ 08820In France:Tel:+1-732-494-866016-18, rue du CanalFax:+1-732-549-515791165 Longjumeau cedexE-Mail: info@jobinyvon.comTel:+33 (0) 1 6454 13 001-800-533-5946Fax: +33 (0)169 0993 19 when photon emission istoo weak for fre-quency-domain detection. There is a sacrifice inavailable wavelengths for UV excitation, impor-tant for some biological samples, when the flashlamp is used, and may be inconvenient and slow. Most important for you, Jobin Yvon, unitingSpexand IBH, now offers both time- and fre-quency-domain instruments to optimize your re-search time and effort. The choice is yours. Copyright C 2004 Jobin Yvon, Inc. R.A. Lampert, et al., Anal. Chem., 55:68-73, 1983. J.R. Lakowicz, et al.,J. Fluor., 1(2):87-93, 1991. G. Hungerford and D.J.S.Birch, Meas. Sci. Tech., 7:121-135,1996. "D.M. Jameson and T.L. Hazlett, Biophysical and Bio-chemical Aspects of Fluorescence Spectroscopy, PlenumPress, New York, pp. 105-133,1991. E. Gratton, et al., Ann. Rev. Biophys. Bioeng.,13:105-124,1984. ( Japan:+81 (0)358230140 China: +86 (0)10 68492216 Germany:+49 (0) 89 462317-0 I taly:+39 0 2 57604762U.K.: +44(0)82048142 )
关闭-
1/4
-
2/4
还剩2页未读,是否继续阅读?
继续免费阅读全文产品配置单
天津东方科捷科技有限公司为您提供《荧光寿命测试技术-时域或频域》,该方案主要用于其他中null检测,参考标准《暂无》,《荧光寿命测试技术-时域或频域》用到的仪器有HORIBA 超快时间分辨荧光光谱仪 DeltaFlex。
我要纠错
推荐专场
相关方案
 咨询
咨询