方案详情文
智能文字提取功能测试中
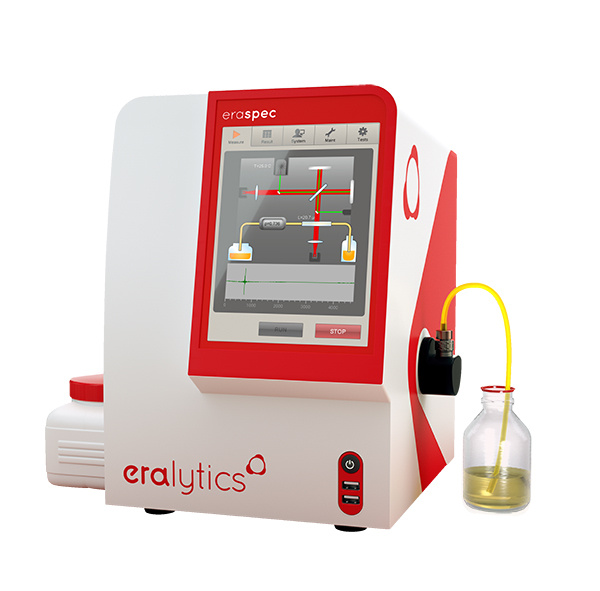
Analytical Instrumentation34 On-site Fuel andLubricant Quality Controlby Portable FTIR Analysers Dr. Christoph Wagner, Eralytics GmbH Lohnergasse 3,A- 1210 Vienna, Austria Tel: +43 1 890 50 33-0·Email: wagner@eralytics.com·Web: www.eralytics.com In today’s quickly moving business there is an increased demand for rapid quality control and conditionmonitoring analysis of fuels and lubricants. This has sparked the development of portable analysers allowing on-site analysis with performances comparable to laboratory instruments. Their dedicated design also enablescomplex analysis to be carried out by non-experts, and the time from sampling to decision can be shortenedsignificantly compared to testing at an off-site laboratory. Quality control of gasoline, Diesel fuel and jet fuel includes fuel composition analysis as well asthe determination of fuel properties, such as Octane numbers (RON, MON) or Cetane index. Forcondition monitoring of lubricant oils, the degradation of the base oil due to oxidation,concentrations of additives and contaminants like water and ethylene glycol as well as propertiessuch as Total Acid Number (TAN) and Total Base Number (TBN) are key parameters.For such applications infrared (IR) spectroscopy is the method of choice due to several reasons.The IR spectrum contains information about the sample on a molecular level. Because eachmolecular species has a unique signature, or fingerprint, in the IR part of the spectrum, it ispossible to determine the concentration of multiple species from a single spectrum. Theevaluation and interpretation of IR spectra can be fully automated, enabling non-experts torapidly carry out complex chemical analysis. Additionally, no sample preparation steps are neededresulting in easy-to-operate analysers that only require a power connection for operation. Themeasurement device itself, called Fourier transform infrared (FTIR) spectrometer, can be made verycompact, stable and robust so that it can be deployed in the field. Principle of FTIR spectroscopy Infrared radiation is an electromagnetic radiation with a wavelength between 0.7 pm and100 pm. This range is further divided in the Near-IR (NIR) range (wavelengths 0.7 pm to roughly 4pm), mid-IR (wavelengths 4 um to roughly 20 pm), and far-IR (wavelengths 20 pm to 100 pm).For analytical applications, mostly NIR and mid-IR spectroscopy are used. In IR spectroscopy, IR radiation is directed through the sample to be analysed and the intensity ofthe transmitted radiation is measured as a function of wavelength. When the wavelength of thelight matches the energy difference between the ground and excited vibrational state of amolecule in the sample the light will be absorbed. The absorption of light is given by the Beer-Lambert law, stating that the absorbance A is given by A=c*l*x(v), where c is theconcentration, I is the sample path length and α(v) is a molecule specific constant.From this equation we can conclude that A increases linearly with both sample concentration andthe sample path length. Generally, a molecule has multiple vibrational modes resulting inabsorption of IR light. This implies that α(v) depends on wavelength. This is how concentrationsof many different substances can be determined simultaneously by IR spectroscopy. In mid-IR spectroscopy the fundamental molecular vibrations, which are typically narrow andsubstance specific signals, are excited. Moreover, a substance exhibits different vibrational modesat different frequencies helping to identify individual compounds even if partial overlap of bandsoccurs. Evaluating the whole spectrum enables the separation of chemically similar substances,such as ethanol and methanol and quantitative analysis of both substances at the same time.Contrary to mid-IR spectroscopy, near-IR spectroscopy probes vibrational overtone andcombination transitions. These bands are typically much broader than in the mid-IR and onlycharacteristic for some groups, such as CH or OH groups. The near-IR spectrum shows only a fewbroad and highly overlapping bands. The lack of chemical selectivity in this spectral region makesit difficult to measure additives present at lower concentrations and the analysis of the spectrarelies heavily on chemometric methods requiring extensive calibration and validation. Due to the nature of near-IR signals all the information is present in the mid-IR spectrum as well.The mid-IR, however, has the advantage of more distinct features that exhibit higher signalintensities. Therefore mid-IR spectroscopy is better suited for quantitative analysis resulting in lower limits of detection due to the higher signal intensities observed. The aforementioned mid-IR signals can be measured in different ways. A cheap but limited way isthe use of optical filters selecting only one of the various bands in the mid-IR range specific forone substance. Such analysers do not obtain a whole spectrum, which highly limits their use forcomplex samples such as fuels. Nowadays the instrument of choice to measure complete spectrais the FTIR instrument which replaced the older technique of dispersive grating spectrometers. FTIR instruments use an interferometer for the measurement of the sample spectrum. It splits thelight emitted from a source into two equal parts by a beam splitter typically made of ZnSe. Thisallows the measurement of spectra in the range of 1.5-18 um (6660-550 cm-1) covering allrelevant signals for fuel and lubricant analysis. The two light beams are directed onto a mirrorreflecting the IR light back towards the beam splitter where they recombine and are directedtowards the detector. If both mirrors are positioned at the same distance from the beam splitterno phase shift between the two parts is introduced. During a measurement one of the twomirrors moves away from the beam splitter at a constant speed. When the displacement of themirror equals one quarter of the wavelength of the light, the combined beams are out of phaseresulting in destructive interference. In this case no light hits the detector. As the mirror isscanned, the light intensity measured by the detector will show a modulation. The intensitymeasured by the detector as a function of the mirror displacement is called an interferogram. Fora monochromatic source, the interferogram will be a sine wave. For polychromatic light, which isemitted by typical IR light sources exhibiting a broad wavelength distribution, the interferogramwill be the sum of sine waves of all frequencies present in the source. A Fourier transform of theinterferogram gives the spectrum. By referencing the spectrum of the sample to that of thesource, the (sample) absorption spectrum is obtained. The absorption spectrum will show a set ofbands corresponding to frequencies where the sample absorbed light. The spectral resolution, a parameter influencing the separation of two nearby bands in the finalspectrum, depends on how far the mirror is moved. For a spectral resolution of 4 wavenumbers(cm) the mirror needs to be moved 0.25 cm whereas it has to be moved 0.5 cm for the higherspectral resolution of 2 cm-1. Considerations for building the ideal FTIR system The goal for building an FTIR analyser is always to measure the desired samples with the bestsignal to noise ratio (SNR) for the most accurate quantitative analysis. Therefore the carefulselection and attuning of the spectrometer's components, such as light source, detector,interferometer and electronics, are crucial for building high quality instruments. Because absorption means attenuation of light, very high absorption means that little lightreaches the detector. This implies that very high absorption cannot be measured accurately. Onthe other hand, if the absorption is too low, meaning that little light is absorbed by the sample,the signal might be smaller than the noise of the instrument. In both cases the SNR will limit theaccuracy of the qualitative analysis. The best SNR ratio is obtained when approximately 70% ofthe light is absorbed by the sample. It is therefore obvious from the formula A=c*l*o(v) that formolecules with highly different α(v) or concentrations, the value of the path length (I) of thesystem has to be adopted so that the absorption falls within a range where it can be measuredwith high accuracy. To be able to separate similar spectral features, it is necessary to measure the spectrum at asufficient resolution. Figure 1 shows spectra from a methanol-ethanol mixture at different spectralresolutions (2, 4, 8 and 16 cm-l). lf the spectral resolution is too low the two signals (one formethanol and one for ethanol) cannot be separated anymore. It becomes impossible todistinguish between them at a spectral resolution of around 16 cm-. It can also be seen that theintensity of the signals decreases as the resolution is lowered. The spectral resolution not onlyaffects the signal strength but also the noise level. Figure 2 shows how the noise of the baselineincreases going from a spectral resolution of 4 to 2 cm1. For quantitative analysis the parameterthat needs to be optimised is the repeatability i.e. the variation between consecutivemeasurements of the same sample. Figure 3 shows the repeatability as a function of resolutionfor MTBE (a gasoline additive). Higher spectral resolutions lead to an increased deviation of themeasured absorbance deteriorating the repeatability of the measurement. These figures strikinglyillustrate that a compromise has to be made between repeatability and spectral separation ofoverlapping features. Inspecting figure 4, showing a spectrum of gasoline, it becomes clear that no spectrainformation is lost at a spectral resolution of 4cm-1. This is not surprising because the natural Figure 1: Spectra of a mixture ofethanol and methanol at different spectral resolutions Spectral baseline noise Figure 2: Noise increase of the spectral baseline with higher spectral resolution Repeatability of an MTBE signal Figure 3: Influence of spectral resolution on the repeatability of the measurement Figure 4: Gasoline spectra at different spectral resolutions linewidth of vibrations for molecules found in gasoline is larger than 10 cm1. To resolve thesebands a resolution of 4 cm-as described in ASTM standards is sufficient. Increasing the spectralresolution further only leads to a decrease of the signal to noise ratio as illustrated in figure 3.Additionally spectra at a spectral resolution of 4 cm- are measured in half the time as at aresolution of 2 cm1 because the moving mirror has to move a shorter distance. This helps tc. shorten analysis time and to increase sample throughput. Fuel and lubricant analysis using FTIR spectroscopy Fuels are complex mixtures of alkanes (paraffins), alkenes (olefins) and aromatics. Moreover, theyare blended with a wide range of additives to enhance combustion and exhaust emissionparameters. Therefore typically oxygenates are used such as MTBE, ethanol or methanol,whichcan be readily monitored by IR spectroscopy according to ASTM D5845. Other components haveto be monitored because they are strictly regulated by authorities due to environmental and. health concerns. Benzene for example can be monitored according to ASTM D6277 and EN 238using IR spectroscopy. In recent years the increasing desire to use renewable fuel sources led to blending of bio-ethanolto gasoline. FAME, an ester produced from vegetable oil, is often added as a COz-neutracomponent to Diesel fuel (ASTM D7806, EN 14078). All these components are present in modernfuels in typically high concentrations. However, there are fuel additives such as MMT or 2-EHNwhich have a significant effect on fuel properties already at very low concentrations. 50 mg/lMMT for example boosts the RON by typically 2.5 and 250 mg/l of 2-EHN the Cetane number by 1.7. It is therefore of high importance to measure these parameters as accurately as possiblealongside other additives that are present at much higher concentrations. As described earlier, longer path lengths of the transmission cell lead to higher signals allowinglower limits of detections. Components of high concentrations will lead to strong or even totalabsorption of light if the path length is too long. To be able to measure additives present inboth high and low concentrations accurately, ERASPEC, an FTIR fuel analyser by eralytics, offers adual cell system. Typically, additives present in high concentrations like ethanol (up to 25 Vol%)are measured in a 20 pm cell while additives present at low concentration like MMT (added in theppm range) are measured in a 100 pm cell. Component concentrations, however, are not the only interesting values of fuels. There arevarious parameters such as RON, MON, distillation properties, evaporation points and vapourpressure, which are of high interest as well. Such fuel parameters cannot be pinned to specificsignals in a spectrum because they do not correlate with single fuel components. Using variousfrom a spectrum. For most accurate results it is not enough to measure the spectrum as different signals and applying advanced statistical methods such parameters can be calculatedaccurately as possible but the analyser has to use a spectral database for the correlation of theparameters. Therefore the result also highly depends on the quality of the reference data, forexample the knock engine results for the octane numbers or the vapour pressure measured usingone of the available mini methods. To obtain reliable predictions using such a model the predictedvalue also has to fall within the calibrated range of the model. If only samples with octanenumbers between 90 and 92 have been used for calibration, the analyser will not be capable tocalculate accurate results for gasoline with an octane number of 95. Additionally, due to thecomplexity of fuels and their regional variations no overall database can be created. ERASPEC,with several hundred installations worldwide, therefore offers comprehensive databases for different regions in order to achieve most accurate results Another field of application of IR spectroscopy is the condition monitoring of lubricants. Incontrast to fuel analysis the main interest is to monitor chemical changes of the oil during useaffecting its performance. Parameters such as oxidation (ASTM D7414), nitration (ASTM D7624),sulphation (ASTM D7415) and phosphate antiwear additive depletion (ASTM D7412) as well asantioxidant depletion (ASTM D2668) can be readily monitored in the mid-IR spectrum. Inaddition, IR offers a quick screening for various contaminants like water, glycol, fuels or sootaccording to ASTM E2412. ERASPEC OIL also calculates total acid and base numbers using adatabase spanning all relevant values of the sample range. IR spectroscopy is a versatile tool for various analytical questions concerning fuels and lubricantsThorough design regarding the spectrometer itself combined with intelligent spectral analysisusing extensive databases is the key element for reliable fuel or lubricant analysis.ERASPEC andERASPEC OIL by eralytics are portable and rugged analysers offering tailor-made solutions for fueland lubricant analysis. They deliver precise analysis results in the lab as well as in the field. Figure 5: Portable ERASPEC analyser by eralytics (www.eralytics.com) -PETRO--IndustryNewsl JUNE / JULY WWW.PETRO-ONLINE.COM
关闭-
1/2

-
2/2
产品配置单
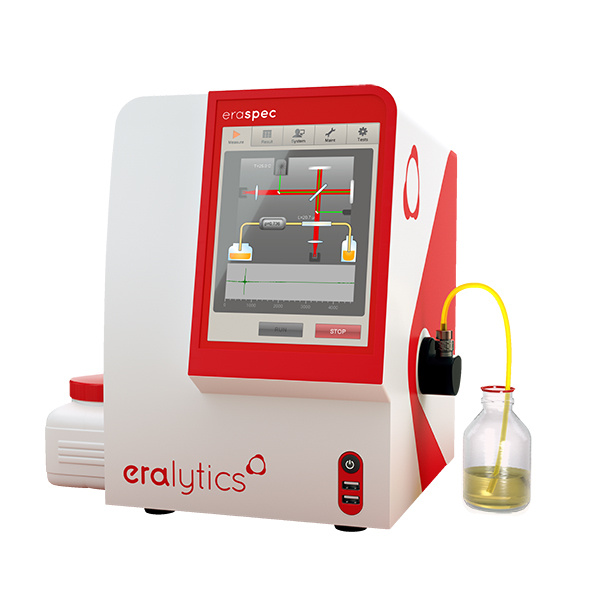
培安有限公司为您提供《燃料油中元素分析检测方案 》,该方案主要用于燃料油中元素分析检测,参考标准《暂无》,《燃料油中元素分析检测方案 》用到的仪器有ERASPEC 中红外汽油柴油航煤分析仪、ERASPEC Diesel 中红外柴油分析仪、ERASPEC 中红外航煤分析仪、ERASPEC JET 中红外航煤分析仪。
我要纠错
相关方案





 咨询
咨询
